Abstract
In response to environmental changes, the connections (“arrows”) in gene regulatory networks determine which genes modulate their expression, but the quantitative parameters of the network (“the numbers on the arrows”) are equally important in determining the resulting phenotype. What are the objectives and constraints by which evolution determines these parameters? We explore these issues by analyzing gene expression changes in a number of yeast metabolic pathways in response to nutrient depletion. We find that a striking pattern emerges that couples the regulatory architecture of the pathway to the gene expression response. In particular, we find that pathways controlled by the intermediate metabolite activation (IMA) architecture, in which an intermediate metabolite activates transcription of pathway genes, exhibit the following response: the enzyme immediately downstream of the regulatory metabolite is under the strongest transcriptional control, whereas the induction of the enzymes upstream of the regulatory intermediate is relatively weak. This pattern of responses is absent in pathways not controlled by an IMA architecture. The observation can be explained by the constraint imposed by the fundamental feedback structure of the network, which places downstream enzymes under a negative feedback loop and upstream ones under a positive feedback loop. This general design principle for transcriptional control of a metabolic pathway can be derived from a simple cost/benefit model of gene expression, in which the observed pattern is an optimal solution. Our results suggest that the parameters regulating metabolic enzyme expression are optimized by evolution, under the strong constraint of the underlying regulatory architecture.
A classic paradigm of gene regulation is the regulation of metabolic enzyme expression in response to changes in external nutrient levels. By regulating enzyme levels, cells not only control the metabolic program, but also save resources and energy by not expressing enzymes that are not needed at a particular time. To achieve this regulation, a variety of strategies can be used, involving different interplay between metabolites, enzymes, and regulatory proteins. In many cases involving model organisms, the regulatory framework that controls this process is known, and research over past decades has revealed a number of different regulatory strategies (1–4).
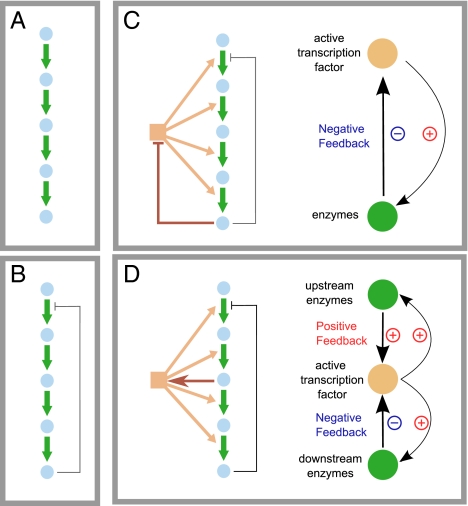
For a linear biosynthetic pathway, a general strategy for controlling the pathway flux is end product feedback inhibition, typically acting on the first enzyme of the pathway (Fig. 1 B–D) and serving as the main sensor of product depletion. In addition, the expression of enzymes is often controlled at the transcriptional level, by transcription factors (TFs) that can sense either the end product or an intermediate metabolite, giving rise to different regulatory architectures (Fig. 1 C and D). Potentially any one of the regulatory architectures in Fig. 1 B–D can solve the problem of keeping the pathway flux low when there is a sufficient external nutrient supply, but turning the pathway on and restoring product levels if the external flux disappears, and for a given architecture, there is a large space of parameters (the numbers on the arrows, such as the binding affinity to the promoters, rate of transcription, etc.) that allow the network to fulfill its general function. However, different parameter choices can lead to quantitatively different behaviors, e.g., the dynamic features such as the speed of the response and the settling time (5, 6). How are these numbers picked by nature? Are they picked purely by historical accident or are there some basic principles underlying their selection?
Fig. 1.
A sample of regulatory network architectures for a linear metabolic pathway. Metabolism can be regulated by simple mass action (A), by allosteric regulation of enzyme activity (B), or, typically, by a combination of allosteric regulation and transcriptional regulation of enzyme levels (C and D). Two classic examples of transcriptional regulatory architectures are the end product inhibition (EPI) network (C) and the intermediate metabolite activation (IMA) network (D). The two networks create different feedback structures.
In trying to address these questions, we have explored gene regulation in a number of metabolic pathways and discovered a unique pattern of gene expression that couples to the feedback architecture of the system. The generality of the pattern in different pathways prompted us to search for a common principle underlying the observed phenomena. Previous studies based on theoretical considerations and experiments in Escherichia coli suggested that the strength of the regulation of metabolic enzymes may be derived by optimizing an objective function that incorporates cost and benefit of protein expression (7–9). By further developing this idea to investigate how different regulatory architectures may lead to different performance and different parameter choices, we find that the observed pattern can be captured by a simple theoretical model and thus provide a plausibility argument that it is a consequence of optimization by natural evolution.
Results
Gene Expression Profiles in Amino Acid and Nucleotide Biosynthesis Pathways in Saccharomyces cerevisiae.
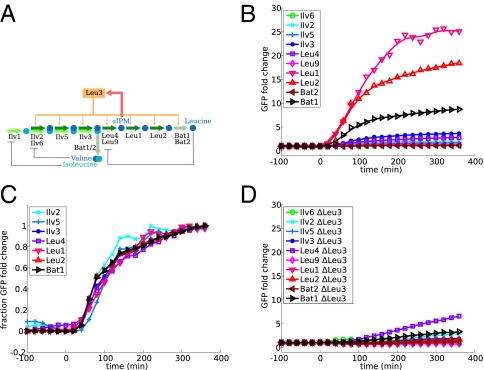
To examine the relationship between regulatory architecture and expression dynamics, we measured the transcriptional response to starvation in a number of amino acid and nucleotide biosynthesis pathways in S. cerevisiae. We examined four pathways: biosynthesis of leucine, lysine, adenine, and arginine. All four are basically linear pathways with minimal branching whose transcriptional regulation has been extensively studied. In all four, a single transcription factor or transcription factor complex is responsible for the majority of the transcriptional regulation in response to depletion of the pathway end product. The architecture of the network, however, differs. In leucine, lysine, and adenine biosynthesis, the transcription factor is activated by the accumulation of one of the intermediate metabolites of the pathway (intermediate metabolite activation, IMA), whereas for arginine biosynthesis, the transcription factor directly senses the concentration of the end product (end product inhibition, EPI). All four pathways share the motif of allosteric inhibition of the first enzyme of the pathway by the end product. The respective network diagrams are shown in Figs. 2A, 3A, 4A, and 5A.
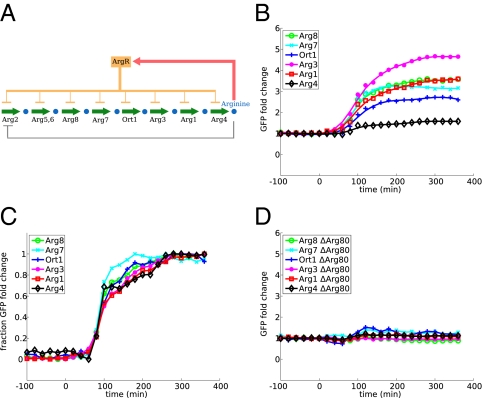
Fig. 2.
Dynamic profiles of leucine biosynthesis enzymes. (A) The leucine biosynthesis pathway in yeast is an IMA network regulated by the transcription factor Leu3, which senses the intermediate metabolite αIPM. (B) Mean GFP fluorescence levels normalized to the level before environmental shift. (C) GFP levels normalized to both initial and final levels (ynormalized = (y − y0)/(yfinal − y0)). Genes with negligible fold changes are not shown. (D) GFP fluorescence levels in response to the environmental shift in a leu3Δ background. In Figs. 2–5, data shown are an average of two independent experiments done on the same day. Data from identical experiments on different days were also quantitatively consistent.
Fig. 3.
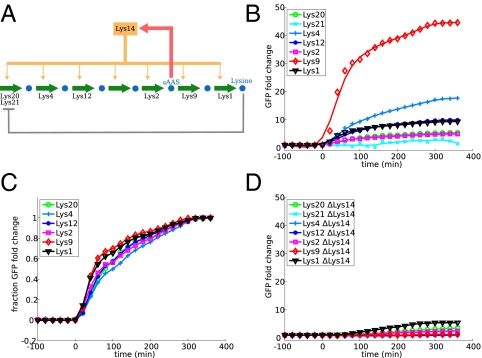
Dynamic profiles of lysine biosynthesis enzymes. See Fig. 2 legend for an explanation of the panels.
Fig. 4.
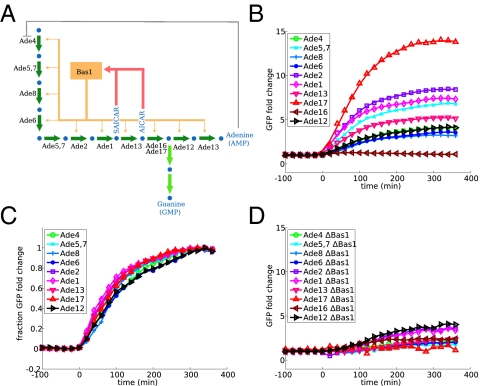
Dynamic profiles of adenine biosynthesis enzymes. See Fig. 2 legend for an explanation of the panels.
Fig. 5.
Dynamic profiles of arginine biosynthesis enzymes. See Fig. 2 legend for an explanation of the panels.
We measured expression of all pathway enzymes by using fluorescent reporter strains, constructed by putting yeast-enhanced green fluorescent protein (yeGFP) (10) under the control of the natural promoter of each gene. The strains were grown in rich media, then moved quickly to media lacking one of the amino acids or adenine. Throughout the time course, fluorescence in single cells was monitored by flow cytometry, using an automated system for sample injection and data collection. The induction profiles for the four pathways are shown in Figs. 2B, 3B, 4B, and 5B.
The expression of leucine biosynthesis enzymes in response to leucine depletion had been studied in some detail by Chin et al. (5) using reporter strains with protein–GFP fusions. Here we reconfirm the results and show that the most highly induced enzyme in the pathway is Leu1, with about 20-fold induction (Fig. 2). Leu1 is the enzyme immediately downstream of the regulatory intermediate alpha-isopropyl-malate (αIPM). Leu2, the next downstream enzyme, also had an induction of about 10-fold, larger than any of the enzymes upstream of αIPM.
We also observed the pattern of the most induced enzyme being immediately downstream of the regulatory intermediate in the other IMA pathways. For lysine biosynthesis, this is the protein Lys9, which has an induction ratio of over 40-fold, much higher than any other enzyme in the pathway (Fig. 3). The other enzyme downstream of the intermediate, Lys1, had an intermediate level of induction that was largely unaffected by a deletion of the transcription factor Lys14, suggesting that it may be regulated by a different mechanism (also suggested by previous data in ref. 11).
For the third IMA pathway, adenine biosynthesis, it is clear that one (or both) of the two metabolites AICAR and SAICAR induces transcriptional activation via the transcription factor Bas1; however, it is not fully understood which is the major regulator (2). We find that the enzyme Ade17 has a higher induction than any other enzyme in the pathway (Fig. 4). On the basis of our observations in the leucine and lysine pathways as well as the theoretical work that we discuss later, we suggest that AICAR, the metabolite converted by Ade17, is likely to be the more important regulator of the pathway. Ade16, an isoenzyme of Ade17, is known to contribute only a small fraction of the catalytic activity and not to be regulated by adenine levels (12).
To investigate whether such a pattern is a consequence of IMA architecture, we explored for contrast the arginine biosynthetic pathway, which has an EPI architecture: the transcription factor complex ArgR is activated by arginine to repress expression. In this case (Fig. 5) we see no clear outlier with high fold induction as we did in the three pathways with IMA architecture.
In all four pathways, we did not observe significant timing differences between the enzymes when the expression profiles were normalized to the initial and final values (Figs. 2C, 3C, 4C, and 5C), suggesting that all genes in the pathway sense the stimulus at the same time.
We confirmed that the enzymes in the pathway are in fact induced by the transcription factor that we have attributed to them. We performed identical experiments in strains with deletions for the transcription factors Leu3, Lys14, Bas1, and Arg80 (one of the proteins in the ArgR complex). With the exception of Lys1 (mentioned above) and Leu4 [discussed in some detail by Kohlhaw (1) and Chin et al. (5)], none of the enzymes showed any measurable induction when the transcription factor was deleted (Figs. 2D, 3D, 4D, and 5D).
Theoretical Cost/Benefit Model.
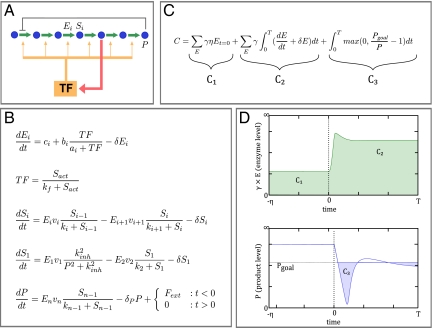
Our observation of similar expression patterns across several metabolic pathways with IMA architecture suggests that there may be a common design principle underlying their regulation. The contrast between IMA and EPI also indicates that the feedback structure of the regulatory network can severely constrain the gene expression response. To explore whether optimization by natural evolution can create the observed pattern, we developed a theoretical model to quantitatively analyze the effect of different gene induction profiles on cellular growth. The key element of the model is the tradeoff between the costs of making a protein (energy and metabolic resources) and the benefits of making it (its cellular function), a fundamental idea in gene regulation. This tradeoff has been observed in vivo in a number of studies across different organisms in which higher fitness was observed for cells that did not express unnecessary genes (9, 13–15). The basic structure of the model is shown in Fig. 6 (see SI Text for more details). There are three terms that correspond to reduced growth due to (i) basal level enzyme production, (ii) enzyme production upon starvation, and (iii) lack of product during starvation. Assigning weights to the three terms results in three metaparameters, which can also be thought of as environmental or evolutionary parameters because they have clear interpretations in terms of the environment in which regulation of the pathway evolved. These are γ, which corresponds to the cost (growth reduction) from synthesizing one additional unit of enzyme; η, the amount of time spent in nonstarvation conditions; and T, the amount of time spent in starvation conditions.
Fig. 6.
A cost/benefit model for gene expression in a metabolic pathway upon nutrient depletion. (A) Generalized linear pathway with one possible regulatory architecture. (B) Set of differential equations describes the dynamics of enzyme induction and product formation. A complete explanation of parameters and variables used in the model and the cost function is provided in SI Text. (C) Cost function used for optimization of regulatory parameters is an estimate of the growth penalty imposed by insufficient product flux or unneeded protein expression. See main text and SI Text for a detailed explanation of the model variables. (D) Graphical illustration of the cost function components.
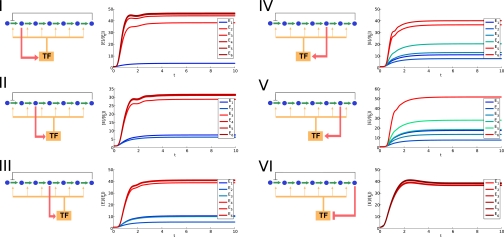
We used our model to address the question of whether evolution may have selected for particular gene expression patterns across different network architectures. For each regulatory architecture, we search for the “optimal” gene expression pattern that minimizes the cost function, allowing only the parameters related to transcriptional regulation to vary. In doing so, we make the implicit assumption that more optimal cis-regulation can evolve much faster than network structure and enzyme properties, an assumption consistent with a number of studies that have suggested that cis-regulatory regions evolve more rapidly than protein coding regions (16, 17) and are under more efficient selection (18–20). We considered a linear pathway of six enzymatic steps, and therefore six different regulatory strategies, which corresponded to each metabolite directly affecting transcription factor activity. For each one, we optimized the cost function using numerical methods. Interestingly, the different networks showed different gene expression strategies when allowed to evolve optimal regulation (Fig. 7).
Fig. 7.
Predicted optimal dynamic profiles of gene induction under six different regulatory network architectures. Expression is measured as fold change as opposed to absolute level because the latter can be scaled by scaling kcat for a particular enzyme, whereas the relative level is insensitive to the particular enzyme parameters. Some curves that overlap perfectly have been artificially separated by a small offset for visibility.
In particular, for networks I–V, in which an intermediate metabolite controls transcription factor activity (IMA networks), the optimal network response involves a separation of responses: strong induction for enzymes downstream of the controlling intermediate and weaker induction for enzymes upstream of the controlling intermediate. This separation of responses is similar to our observed dynamics in the yeast leucine, lysine, and adenine biosynthesis pathways and can be explained by a simple observation. Looking at the network topology from the point of view of the intermediate metabolite, up-regulation of the upstream genes creates a positive feedback loop, because higher levels of upstream enzymes lead to higher levels of the intermediate metabolite. However, up-regulation of downstream genes creates a negative feedback loop, because higher enzyme levels deplete the intermediate metabolite (Fig. 1 C and D). Strong negative feedback has long been a well-known design principle for strong and fast up-regulation of gene expression (21, 22). Although strong positive feedback is invaluable in switching or bistable systems, it can often have deleterious consequences in adaptive systems (23).
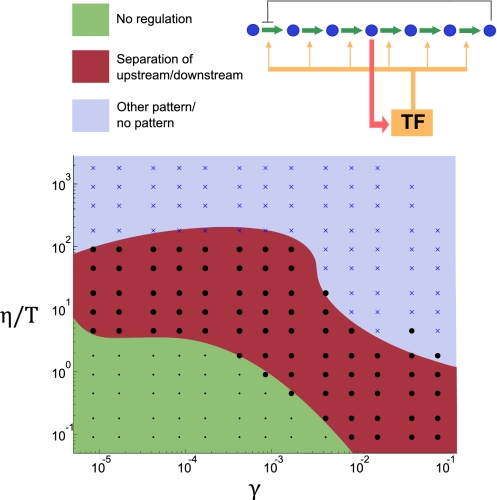
The aforementioned results were obtained by choosing reasonable values for the evolutionary parameters γ, η, and T. Because the true values are largely unknown, we repeated the analysis using a wide range of values for these parameters, creating a phase diagram of network behaviors. The results for network III are shown in Fig. 8. For a wide range of parameters, we see the behavior observed previously, with a separation of responses between upstream and downstream genes. Similar results were obtained for the other IMA networks (Fig. S1).
Fig. 8.
Phase diagram of optimal expression dynamics for an IMA network. Each point in the graph corresponds to a pair of values (γ, η/T) represents an optimization of the cost function over the regulatory parameters. Each solution was classified on the basis of the resulting enzyme expression dynamics. The red region corresponding to intermediate values of the evolutionary parameters shows a pattern of separation of enzyme dynamics before and after the regulatory metabolite. The green region consists of parameters where the optimal solution involved no regulation at all, whereas the blue region contains other types of expression patterns. The blue region is likely to involve unrealistic parameter values because these solutions typically involve fold changes of over 104.
For network VI, in which the end product of the pathway regulates the transcription factor, we found the optimal response to involve almost identical expression profiles for every enzyme in the pathway. This behavior was found to be robust for a very wide range of environmental parameters. In this network, there is no positive feedback loop, and thus no constraint on induction of the enzymes at the top of the pathway. This agrees with our observations in the yeast arginine biosynthesis pathway where all enzymes had similar induction dynamics.
Similar results were obtained for models with different numbers of enzymes. We also explored the phase diagrams for other environmental parameters. These are included in Figs. S2 and S3.
Discussion
We have shown that in a number of biosynthetic pathways in yeast, gene expression dynamics depend on the underlying regulatory architecture. In particular, we have observed that under the IMA, the enzyme immediately downstream of the regulatory intermediate is induced much more strongly than any other enzyme in the pathway and that this is a universal feature of all of the pathways with the IMA architecture we examined. In some cases, other enzymes downstream of the intermediate also have a relatively strong induction level. In arginine biosynthesis, which is regulated by the EPI architecture, we did not observe significant differences in gene induction among pathway enzymes.
By using a theoretical model to balance the relative costs and benefits of gene expression level, we have shown that organisms are likely to evolve different patterns of gene expression depending on the regulatory architecture used to control the pathway. In particular, for networks in which an intermediate metabolite interacts with the transcriptional regulator, the theoretical model predicts that the optimal gene expression dynamics involve a much stronger induction for enzymes downstream of the intermediate than for those upstream of the intermediate. Combining the theoretical analysis with the experimental observations, our results suggest that the strengths of regulation of the pathway enzymes may have been optimized by evolution and that the cost/benefit model captures the basic features of the objective function.
Although we have concentrated on the prediction of gene expression profiles for individual networks, our model also predicts a final cost value for each network, and we can compare the costs between the six networks in Fig. 7. We find that across virtually the entire phase space, network VI consistently has the lowest cost, followed by networks I, II, III, IV, and V in that order. This finding is somewhat intuitive because this is the order in which the networks sense the starvation signal, from earliest (directly sensing lack of product) to latest (the last intermediate in the pathway). However, it does create the question of why all biological pathways do not use the least costly regulatory topology. We hypothesize that this is due to the high evolutionary barrier of switching the regulatory program. A switch in regulatory program must involve the evolution of a new metabolite–TF interaction, as well as a concurrent evolution of each of the promoters involved, and is likely to create a very unfavorable intermediate state. Another possibility is that the chemical structure of certain end products makes it difficult to interact with transcription factors.
We note also that the model predicts virtually identical expression profiles for all enzymes downstream of the control point in IMA networks, whereas our data only show consistently a strong induction for the enzyme immediately after the control point. There are several reasons why this could be the case. One possibility is that we are observing some natural variation away from the optimal solution, which is lower for the enzyme immediately after the control point than for other downstream enzymes. Indeed we show (Fig. S4) that of all of the downstream enzymes, the sensitivity of the cost function is highest to parameters that affect the expression of the enzyme immediately downstream; that is, changing expression of the first enzyme downstream of the intermediate is more detrimental to the behavior of the system than changing the expression of other downstream enzymes. This is because this expression level tightly controls the level of the regulatory metabolite and will affect expression in the entire pathway. Intuitively, having insufficient induction of the enzyme immediately downstream may lead to an effective positive feedback loop for the system when the two feedback loops of opposite signs are combined (Fig. 1D). Because such positive feedback can lead to an unstable situation that results in overexpression of the whole pathway, the regulatory architecture would put the strongest constraint on the expression of the enzyme immediately downstream. A slightly different but related possibility is that it may be beneficial to reduce stochastic fluctuations, as strong negative feedback is known to do (24).
Although we have restricted our experiments to one organism, the model results suggest that the phenomenon should be general. Indeed, for pathways with IMA architecture, additional evidence from a recent study suggests that the expression patterns we observed in yeast may also hold true in E. coli. We obtained time course data for expression of a number of amino acid biosynthesis genes under depletion for six different amino acids in E. coli from Yamada et al. (25) (reproduced in Figs. S5–S7 and found to have similar patterns). The clearest example is in the lysine biosynthesis pathway in E. coli, regulated by the transcription factor LysR, which binds the metabolic intermediate diaminopimelate to become active (26). LysA, the enzyme downstream of the regulatory intermediate, has a significantly higher level of induction than any of the other measured enzymes. In the methionine pathway, where homocysteine regulates the transcription factor MetR (27), the downstream enzyme MetE also has higher induction than the other enzymes in the pathway. For the cysteine and valine biosynthesis pathways, we also see high induction of the enzyme immediately downstream, which may suggest a similar pattern, but is insufficient to make a definite conclusion.
One might expect fewer instances of differential regulation of enzymes in the pathway in bacterial systems, due to the common constraint of cotranscription of pathway enzymes in one operon. However, in fact, in none of the above cases do we observe cotranscription of genes corresponding to upstream and downstream enzymes (although several upstream enzymes might in fact be found in one operon). This observation might argue that evolution has found it necessary to separate the regulation of upstream and downstream enzymes when a pathway is regulated by an IMA network.
We have also noted that we do not observe timing differences between enzymes in the yeast metabolic pathways that we have studied, including three pathways with IMA and one with EPI architecture. This is in contrast to the “just-in-time” pattern reported by Zaslaver et al. (8) where E. coli amino acid biosynthesis enzymes in several pathways were activated in sequential order according to their position in the pathways. Our observations suggest that just-in-time behavior in metabolic pathways is not as general as it may be perceived, despite several groups having presented a general argument for it on the basis of theoretical grounds (7, 8). Although the argument seems intuitive (best to produce enzymes only when you need them), the intuition relies on the assumption that the timing of each enzyme's induction can be independently tuned without incurring significant cost, and this may be feasible only under very particular conditions. Within the context of the simple regulation in our model, these conditions require very unusual parameter values and are likely to be the exception rather than the norm (Fig. S8). If more complicated regulatory schemes were used, it would be possible to control timing of the induction independently from the amplitude, but the benefit of saving protein synthesis with just-in-time expression must then be weighed against the cost of investing in complicated regulatory schemes.
There are two design principles for the regulation of metabolic pathways that we have introduced in this work: (i) optimal patterns of gene induction are strongly dependent on the underlying network architecture and (ii) under the IMA, strong induction of enzymes downstream of the intermediate is highly favorable. The latter is one application of the more general principle of using strong negative feedback for stability and fast response. Nevertheless, it is striking that these results can be deduced from an extremely simple mathematical model of evolutionary optimality. Although the model is a drastic simplification of reality, we feel that it captures the basic principles behind the phenomenon and that the key finding of strong dependence of expression profiles on network architecture (and in particular on the feedback structure) will be robust as more interesting models for cellular fitness are considered.
Materials and Methods
Strains, Media and Flow Cytometry.
All yeast strains are derived from S288c MATα ura3-52. For promoter–GFP constructs, 720 bp directly upstream of each gene was used. For flow cytometry, cultures were grown in deep-well 96-well plates, with a volume of 500 μL per well. Exponential phase cells growing in SD-complete media and having reached steady-state GFP levels were collected by centrifugation and resuspended in dropout media. A customized robotic liquid handler periodically diluted the cultures with fresh media and delivered samples to an LSRII flow cytometer (Beckton-Dickinson). Cell populations were filtered by gating on the forward and side scatter values, and total GFP fluorescence was normalized to side scatter to give an approximate measure of GFP concentration (28).
Cost/Benefit Model and Parameter Optimization.
All computation was done using software written by the authors. Five independent simulations were done for each optimization problem, and variation in the final objective function was typically below 1%.
Supplementary Material
Acknowledgments
We acknowledge M. Guo, P. Kimmig, E. McCullagh, and J. Stewart-Ornstein for technical assistance, and H. El-Samad, H. Madhani, and C. Tang for comments and editorial assistance. This work was supported by National Institutes of Health (NIH) Grant R01 GM070808 and a Packard Fellowship in Science and Engineering (to H.L.) and by NIH Center for Systems and Synthetic Biology Grant P50 GM081879.
Footnotes
The authors declare no conflict of interest.
This article is a PNAS Direct Submission. T.H. is a guest editor invited by the Editorial Board.
This article contains supporting information online at www.pnas.org/lookup/suppl/doi:10.1073/pnas.1114235109/-/DCSupplemental.
References
- 1.Kohlhaw GB. Leucine biosynthesis in fungi: Entering metabolism through the back door. Microbiol Mol Biol Rev. 2003;67:1–15. doi: 10.1128/MMBR.67.1.1-15.2003. [DOI] [PMC free article] [PubMed] [Google Scholar]
- 2.Rébora K, Desmoucelles C, Borne F, Pinson B, Daignan-Fornier B. Yeast AMP pathway genes respond to adenine through regulated synthesis of a metabolic intermediate. Mol Cell Biol. 2001;21:7901–7912. doi: 10.1128/MCB.21.23.7901-7912.2001. [DOI] [PMC free article] [PubMed] [Google Scholar]
- 3.Jacob F, Monod J. Genetic regulatory mechanisms in the synthesis of proteins. J Mol Biol. 1961;3:318–356. doi: 10.1016/s0022-2836(61)80072-7. [DOI] [PubMed] [Google Scholar]
- 4.Artz SW, Broach JR. Histidine regulation in Salmonella typhimurium: An activator attenuator model of gene regulation. Proc Natl Acad Sci USA. 1975;72:3453–3457. doi: 10.1073/pnas.72.9.3453. [DOI] [PMC free article] [PubMed] [Google Scholar]
- 5.Chin C-S, Chubukov V, Jolly ER, DeRisi J, Li H. Dynamics and design principles of a basic regulatory architecture controlling metabolic pathways. PLoS Biol. 2008;6:e146. doi: 10.1371/journal.pbio.0060146. [DOI] [PMC free article] [PubMed] [Google Scholar]
- 6.Prill RJ, Iglesias PA, Levchenko A. Dynamic properties of network motifs contribute to biological network organization. PLoS Biol. 2005;3:e343. doi: 10.1371/journal.pbio.0030343. [DOI] [PMC free article] [PubMed] [Google Scholar]
- 7.Klipp E, Heinrich R, Holzhütter H-G. Prediction of temporal gene expression. Metabolic opimization by re-distribution of enzyme activities. Eur J Biochem. 2002;269:5406–5413. doi: 10.1046/j.1432-1033.2002.03223.x. [DOI] [PubMed] [Google Scholar]
- 8.Zaslaver A, et al. Just-in-time transcription program in metabolic pathways. Nat Genet. 2004;36:486–491. doi: 10.1038/ng1348. [DOI] [PubMed] [Google Scholar]
- 9.Dekel E, Alon U. Optimality and evolutionary tuning of the expression level of a protein. Nature. 2005;436:588–592. doi: 10.1038/nature03842. [DOI] [PubMed] [Google Scholar]
- 10.Heim R, Cubitt AB, Tsien RY. Improved green fluorescence. Nature. 1995;373:663–664. doi: 10.1038/373663b0. [DOI] [PubMed] [Google Scholar]
- 11.Ramos F, Dubois E, Piérard A. Control of enzyme synthesis in the lysine biosynthetic pathway of Saccharomyces cerevisiae. Evidence for a regulatory role of gene LYS14. Eur J Biochem. 1988;171:171–176. doi: 10.1111/j.1432-1033.1988.tb13773.x. [DOI] [PubMed] [Google Scholar]
- 12.Tibbetts AS, Appling DR. Characterization of two 5-aminoimidazole-4-carboxamide ribonucleotide transformylase/inosine monophosphate cyclohydrolase isozymes from Saccharomyces cerevisiae. J Biol Chem. 2000;275:20920–20927. doi: 10.1074/jbc.M909851199. [DOI] [PubMed] [Google Scholar]
- 13.Suiter AM, Bänziger O, Dean AM. Fitness consequences of a regulatory polymorphism in a seasonal environment. Proc Natl Acad Sci USA. 2003;100:12782–12786. doi: 10.1073/pnas.2134994100. [DOI] [PMC free article] [PubMed] [Google Scholar]
- 14.Lang GI, Murray AW, Botstein D. The cost of gene expression underlies a fitness trade-off in yeast. Proc Natl Acad Sci USA. 2009;106:5755–5760. doi: 10.1073/pnas.0901620106. [DOI] [PMC free article] [PubMed] [Google Scholar]
- 15.Gore J, Youk H, van Oudenaarden A. Snowdrift game dynamics and facultative cheating in yeast. Nature. 2009;459:253–256. doi: 10.1038/nature07921. [DOI] [PMC free article] [PubMed] [Google Scholar]
- 16.Kellis M, Patterson N, Endrizzi M, Birren B, Lander ES. Sequencing and comparison of yeast species to identify genes and regulatory elements. Nature. 2003;423:241–254. doi: 10.1038/nature01644. [DOI] [PubMed] [Google Scholar]
- 17.Chin C-S, Chuang JH, Li H. Genome-wide regulatory complexity in yeast promoters: Separation of functionally conserved and neutral sequence. Genome Res. 2005;15:205–213. doi: 10.1101/gr.3243305. [DOI] [PMC free article] [PubMed] [Google Scholar]
- 18.Wray GA, et al. The evolution of transcriptional regulation in eukaryotes. Mol Biol Evol. 2003;20:1377–1419. doi: 10.1093/molbev/msg140. [DOI] [PubMed] [Google Scholar]
- 19.Stern DL. Perspective: Evolutionary developmental biology and the problem of variation. Evol. 2000;54:1079. doi: 10.1111/j.0014-3820.2000.tb00544.x. [DOI] [PubMed] [Google Scholar]
- 20.Wray GA. The evolutionary significance of cis-regulatory mutations. Nat Rev Genet. 2007;8:206–216. doi: 10.1038/nrg2063. [DOI] [PubMed] [Google Scholar]
- 21.Rosenfeld N, Elowitz MB, Alon U. Negative autoregulation speeds the response times of transcription networks. J Mol Biol. 2002;323:785–793. doi: 10.1016/s0022-2836(02)00994-4. [DOI] [PubMed] [Google Scholar]
- 22.Alon U. An Introduction to Systems Biology: Design Principles of Biological Circuits. 1st Ed. New York: Chapman and Hall; 2006. [Google Scholar]
- 23.Wilhelm T. The smallest chemical reaction system with bistability. BMC Syst Biol. 2009;3:90. doi: 10.1186/1752-0509-3-90. [DOI] [PMC free article] [PubMed] [Google Scholar]
- 24.Thattai M, van Oudenaarden A. Intrinsic noise in gene regulatory networks. Proc Natl Acad Sci USA. 2001;98:8614–8619. doi: 10.1073/pnas.151588598. [DOI] [PMC free article] [PubMed] [Google Scholar]
- 25.Yamada T, et al. Relationship between noise characteristics in protein expressions and regulatory structures of amino acid biosynthesis pathways. IET Syst Biol. 2010;4:82–89. doi: 10.1049/iet-syb.2008.0158. [DOI] [PubMed] [Google Scholar]
- 26.Stragier P, Danos O, Patte JC. Regulation of diaminopimelate decarboxylase synthesis in Escherichia coli. II. Nucleotide sequence of the lysA gene and its regulatory region. J Mol Biol. 1983;168:321–331. doi: 10.1016/s0022-2836(83)80021-7. [DOI] [PubMed] [Google Scholar]
- 27.Urbanowski ML, Stauffer GV. Role of homocysteine in metR-mediated activation of the metE and metH genes in Salmonella typhimurium and Escherichia coli. J Bacteriol. 1989;171:3277–3281. doi: 10.1128/jb.171.6.3277-3281.1989. [DOI] [PMC free article] [PubMed] [Google Scholar]
- 28.Salzman GC. Light scatter: Detection and usage. Curr Protoc Cytom. 2001 doi: 10.1002/0471142956.cy0113s09. Chapter 1:Unit 1.13. [DOI] [PubMed] [Google Scholar]
Associated Data
This section collects any data citations, data availability statements, or supplementary materials included in this article.


