

Abstract
Rapamycin, an inhibitor of mechanistic target of rapamycin complex 1 (mTORC1), extends the lifespans of yeast, flies, and mice. Calorie restriction, which increases lifespan and insulin sensitivity, is proposed to function by inhibition of mTORC1, yet paradoxically, chronic administration of rapamycin substantially impairs glucose tolerance and insulin action. We demonstrate that rapamycin disrupted a second mTOR complex, mTORC2, in vivo and that mTORC2 was required for the insulin-mediated suppression of hepatic gluconeogenesis. Further, decreased mTORC1 signaling was sufficient to extend lifespan independently from changes in glucose homeostasis, as female mice heterozygous for both mTOR and mLST8 exhibited decreased mTORC1 activity and extended lifespan, but had normal glucose tolerance and insulin sensitivity. Thus, mTORC2 disruption is an important mediator of the effects of rapamycin in vivo.
Age-related diseases, including cancer, neurodegenerative disorders, cardiovascular disease, type II diabetes, and many others, are the major contributors to morbidity and mortality in Western society. The high frequency of these diseases in the elderly limits the benefit that can be obtained by targeting them individually (1). However, targeting the aging process directly may offer a way to delay the incidence of many age-related diseases simultaneously. To date, the only molecule that appears to influence the intrinsic rate of aging in mammals, as evidenced by a robust extension of maximum lifespan, is rapamycin, an inhibitor of mechanistic (previously referred to as mammalian) target of rapamycin complex 1 (mTORC1) (2, 3).
mTOR is a kinase that integrates inputs from many nutrients and growth factors. mTOR is found in two distinct protein complexes: mTORC1, which regulates numerous cellular processes related to growth and differentiation, and mTORC2, which has a regulatory role in the insulin signaling cascade. Genetic attenuation of mTORC1 signaling promotes longevity in diverse organisms, including Saccharomyces cerevisiae, Caenorhabditis elegans, and Drosophila melanogaster, and rapamycin-induced lifespan extension has been reported in S. cerevisiae, D. melanogaster, and mice (2-7). Moreover, deletion of the mTORC1 substrate S6 kinase 1 (S6K1) is sufficient to confer increased lifespan in female mice (8). These findings strongly implicate mTOR in the regulation of mammalian longevity.
Calorie restriction (CR), a reduction in caloric intake while maintaining adequate nutrition, improves health and extends lifespan in many organisms, including primates, through a mechanism that is not understood (9, 10). Yeast that lack the mTOR homolog TOR1 have an extended replicative lifespan that is not further enhanced by CR, suggesting a common mechanism (4), but in flies, rapamycin increases lifespan beyond the maximum achieved by CR, and thus may act through additional mechanisms (11). Improved glucose tolerance and insulin sensitivity are hallmarks of CR in mammals, and a common feature of many models of increased longevity (12-16), although mice lacking insulin receptor substrate (IRS) proteins 1 or 2 provide a notable counterexample (17, 18). One possible mechanism for enhanced insulin sensitivity during CR is reduced negative feedback through a signaling loop mediated by mTORC1 and S6K1 (19). Indeed, deletion of S6K1 is sufficient to improve insulin sensitivity and extend life in mice (8), suggesting that rapamycin might act in a similar manner.
In contrast to the prediction that rapamycin would mimic the effects of CR or S6K1 deletion on glucose tolerance and insulin sensitivity, recent evidence suggests that chronic treatment with rapamycin impairs glucose homeostasis. Prolonged treatment with rapamycin leads to glucose intolerance in mice (20), as well as insulin resistance in rats (21, 22), and possibly humans (23, 24). We explored the mechanism by which rapamycin treatment impairs glucose homeostasis. Chronic rapamycin treatment, at approximately the same dose that was used to extend lifespan (~2 mg/kg/day), led to glucose intolerance and insulin resistance in both male and female C57BL/6 mice (fig. S1, A and B). In rats, rapamycin-induced glucose intolerance results, in part, from increased hepatic gluconeogenesis (22). We found that rapamycin-treated mice had increased expression of the gluconeogenic genes Phosphoenolpyruvate carboxykinase (PEPCK) and Glucose 6-Phosphatase (G6Pase) in their livers, and had substantially impaired tolerance to pyruvate, indicating a failure to suppress gluconeogenesis (fig. S1, C and D).
We used a hyperinsulinemic-euglycemic clamp to measure insulin sensitivity in rapamycin-treated mice (Fig 1, A to F). Briefly, mice received a constant infusion of insulin, and radio-labeled glucose was co-infused as needed to prevent hypoglycemia. Calculating whole-body glucose uptake and hepatic glucose production, based on the fraction of labeled glucose in the circulation, revealed marked hepatic insulin resistance in rapamycin-treated mice (Fig. 1, C and D). In contrast, uptake of labeled glucose into white adipose and skeletal muscle was unaffected under clamp conditions (Fig. 1E and F). In rapamycin-treated animals, plasma insulin was unchanged during fasting, and higher after re-feeding (Fig. 1G), suggesting an adaptive response to insulin resistance, rather than a defect in insulin production by pancreatic beta cells. These results indicate that hepatic insulin resistance is a major contributor to the impairment of glucose homeostasis by rapamycin, and that white adipose tissue and skeletal muscle take up glucose normally in response to continuous insulin stimulation, despite inhibition of mTORC1 signaling to S6K1 in all three tissues (Fig. 1H and fig. S2 A and B).
Figure 1.
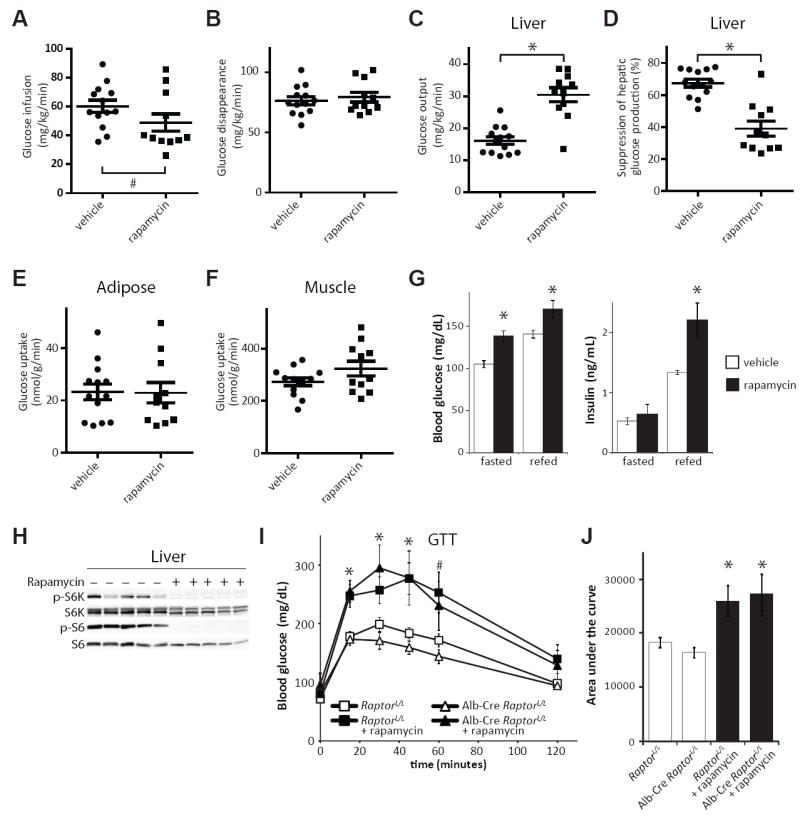
Rapamycin-induced insulin resistance is independent of hepatic mTORC1. A-F) Glucose infusion rate (A), rate of disappearance of glucose from the circulation (B), hepatic gluconeogenesis (C) and insulin responsiveness (D), as well as glucose uptake by white adipose tissue (E) and skeletal muscle (F) were determined during a hyperinsulinemic-euglycemic clamp in mice treated with 2 mg/kg/day rapamycin or vehicle control for two weeks. (Each dot represents a single animal, n = 13 vehicle-treated mice, 11 rapamycin-treated mice, * = P < 1×10⁻⁵, Student’s t-test; # = P < 0.045 by Brown-Mood k-sample median test.) G) Serum glucose and insulin concentration in rapamycin-treated mice during fasting and after re-feeding for 4 hours (* = P < 0.02). H) Phosphorylation of the mTORC1 substrate S6K1 T389 and subsequent phosphorylation of S6 in the livers of rapamycin-treated mice. I,J) Glucose tolerance with or without rapamycin treatment in mice lacking hepatic Raptor (* = P < 0.05, # = P < 0.06 for rapamycin treated groups vs. untreated). All bars indicate mean and SEM.
We specifically disrupted hepatic mTORC1 signaling by expressing Cre under the control of the liver-specific albumin promoter in mice carrying a conditional allele of the mTORC1 subunit Raptor (fig. S2C). Alb-Cre RaptorloxP/loxP mice, despite lacking hepatic mTORC1 activity, had normal glucose tolerance and remained responsive to rapamycin treatment (Fig. 1I and J). These results indicate that disruption of hepatic mTORC1 signaling cannot account for the effects of rapamycin on glucose homeostasis. Although rapamycin is generally considered to be a specific inhibitor of mTORC1, extended treatment of cells with rapamycin can also physically disrupt mTORC2, independently from changes in protein expression in certain cell lines (25). We therefore examined mTORC2 signaling in livers, white adipose tissue, and muscles from rapamycin-treated mice. Mice were fasted overnight, and then stimulated by re-feeding or by intraperitoneal injection of insulin. Phosphorylation of mTORC2 substrates, including the protein kinases PKCα S657 and Akt S473, as well as the SGK substrate NDRG1 T346 (Fig. 2, A to D) was attenuated in all three tissues. To confirm that these effects resulted from mTORC2 disruption, we immunoprecipitated mTOR from the liver, white adipose tissue, and skeletal muscle of mice treated with rapamycin, and visualized components of mTORC1 and mTORC2 by protein immunoblotting (Fig. 2, E to G). Chronic rapamycin treatment disrupted the association of mTOR with both Raptor (mTORC1) and Rictor (mTORC2) in all three tissues. Therefore, direct disruption of mTORC2 is a second molecular mechanism that may contribute to the effects of rapamycin in vivo. Although rapamycin inhibited the phosphorylation of hepatic PKCα and the activity of SGK (as evidenced by decreased phosphorylation of the SGK substrate NDRG1 (26)) in animals that were fasted and re-fed for 45 minutes, the phosphorylation of hepatic Akt S473 was inhibited by rapamycin only in animals stimulated with insulin (49.7% of wild-type level, p = 0.013) (Fig. 2, A and B) (25). This may indicate that a small amount of residual mTORC2 is sufficient for basal, but not maximal signaling to Akt.
Figure 2.
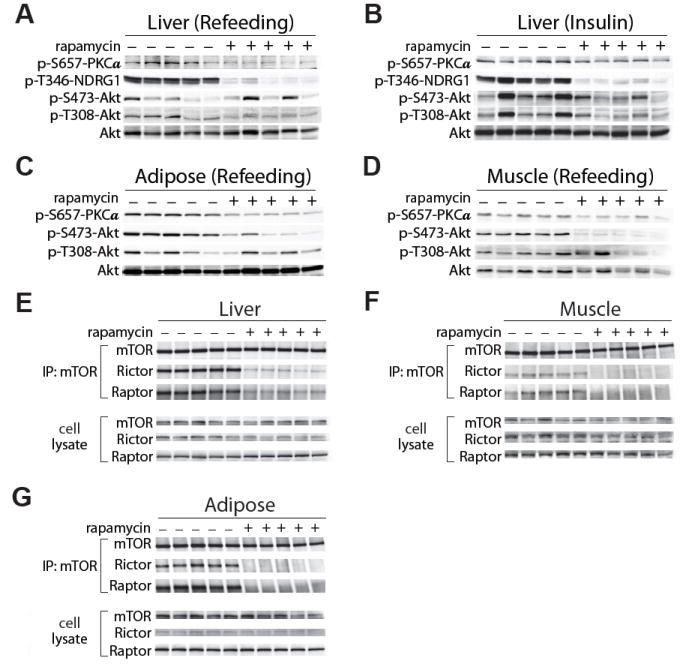
Disruption of mTORC2 in vivo after chronic rapamycin treatment. A, B) Effects of rapamycin on phosphorylation of PKCα, Akt, and the SGK substrate NDRG1 in liver in response to re-feeding (A) or insulin (B) after an overnight fast. C, D) Effects of rapamycin on phosphorylation of PKCα and Akt in response to re-feeding in white adipose tissue (C) and muscle (D). E-G) Effects of rapamycin on the integrity of mTORC1 and mTORC2. mTOR was immunoprecipitated from liver (E), skeletal muscle (F), and white adipose tissue (G), followed by immunoblotting for Raptor and Rictor (subunits of mTORC1 and mTORC2, respectively).
To examine the effect of hepatic mTORC2 on glucose homeostasis, we generated mice that carried a Cre-excisable allele of the mTORC2 subunit Rictor and expressed Cre under the control of the albumin promoter (fig. S3A). Alb-Cre RictorloxP/loxP mice displayed pronounced glucose intolerance (Fig. 3A), but had a mild defect in an insulin tolerance test (fig. S3B), which likely reflected normal glucose uptake into skeletal muscle and adipose tissue. As with rapamycin-treated mice, Alb-Cre RictorloxP/loxP mice had impaired ability to suppress hepatic gluconeogenesis in a pyruvate tolerance test (Fig. 3B), had increased hepatic expression of G6Pase (fig. S4A), and did not show any overt defect in insulin secretion (fig. S4B). Thus, disruption of mTORC2 in the liver is sufficient to impair hepatic insulin sensitivity, and is likely a major contributor to rapamycin-induced glucose intolerance.
Figure 3.

Regulation of glucose homeostasis by mTORC2. A) Glucose tolerance of Alb-Cre RictorLoxP/LoxP mice (* = P< 0.002). B) Pyruvate tolerance of Alb-Cre RictorloxP/loxP mice (* = P < 0.03). C) Effect of rapamycin on glucose tolerance of mice with whole-body deletion of Rictor fasted for 6 hr (* = P < 0.008 for all groups vs. wt). D-I) Glucose infusion rate (D), rate of disappearance of glucose from the circulation (E), hepatic gluconeogenesis (F) and insulin responsiveness (G), and glucose uptake by white adipose tissue (H) and skeletal muscle (I) were determined during a hyperinsulinemic-euglycemic clamp in tamoxifen-treated UbiquitinC-CreERT2 RictorloxP/loxP mice fasted for 6 hr (n = 8 RictorloxP/loxP, 7 UBC-Cre RictorloxP/loxP, ** = P < 0.008; * = P <0.05). All bars indicate mean and SEM.
Rapamycin disrupts mTORC2 in multiple tissues (Fig. 2, E to G). Deletion of Rictor in muscle impairs phosphorylation of Akt S473, although the effect on glucose homeostasis has not been described (27). Deletion of Rictor in adipose tissue leads to weight gain, hyperinsulinemia and insulin resistance, with discordant findings reported as to the net effect on glucose tolerance (28, 29). To better understand the consequences of whole-body mTORC2 disruption, we created a strain of mice in which Rictor could be conditionally deleted in adult animals with a tamoxifen-inducible Cre (CreERT2) allele expressed under the control of the Ubiquitin C promoter.
Consistent with the idea that rapamycin-induced hepatic insulin resistance is primarily mediated by mTORC2 disruption, there was no further effect on glucose homeostasis when Ubiquitin C-CreERT2 RictorloxP/loxP were treated for two weeks with rapamycin (Fig. 3C). Interestingly, Alb-Cre RictorloxP/loxP mice treated with rapamycin were hyperglycemic after 6 hours of fasting (fig. S6A) or re-feeding (fig. S4B). This difference may reflect alterations in metabolism as a result of lifelong deficiency in hepatic Rictor. Nevertheless, rapamycin had no further effect on gluconeogenic gene expression, glucose tolerance, or pyruvate tolerance in Alb-Cre RictorloxP/loxP mice (fig. S4A and fig. S6, B to E).
During a hyperinsulinemic-euglycemic clamp (Fig. 3, D to I), tamoxifen-treated Ubiquitin C-CreERT2 RictorloxP/loxP mice had a decreased glucose infusion rate as compared to tamoxifen-treated RictorloxP/loxP controls (Fig. 3D). As with the rapamycin-treated mice, the predominant defect in these animals under clamp conditions was hepatic insulin resistance, resulting in increased glucose production (Fig. 3, F and G). While the overall rates of glucose removal from the blood and uptake into skeletal muscle were not significantly affected, glucose uptake into white adipose tissue was increased (Fig. 3, H and I). Thus, Rictor appears to have a role in the regulation of glucose homeostasis in white adipose tissue, although chronic rapamycin treatment is either not sufficient to elicit this phenotype (Fig. 1E), or the effect is offset by other rapamycin targets, such as mTORC1. Notably, Rictor was not completely excised in skeletal muscle, meaning that a role for mTORC2 in this tissue cannot be excluded at present. Thus, both rapamycin treatment and Rictor deletion induce clear hepatic insulin resistance, whereas the precise role of mTORC2 in regulating glucose uptake into other tissues remains to be fully defined.
Because the negative effects of rapamycin on glucose tolerance and hepatic insulin sensitivity appear to be mediated by mTORC2 disruption, whereas lifespan extension has generally been presumed to result from mTORC1 inhibition, it may be possible to uncouple the beneficial and detrimental effects of mTOR inhibition. We therefore bred mice carrying only a single copy of either mtor, Raptor, or mlst8 or double mutant mtor+/- Raptor+/- and mtor+/- mlst8+/- mice, and followed them as they aged.
There was no increase in lifespan in either female (Fig. 4A) or male (Fig. 4B) mtor+/-, Raptor+/-, mlst8+/- or mtor+/- Raptor+/- mice (see also table S1). However, female mtor+/- mlst8+/- mice were long–lived, with a 14.4% increase in mean lifespan relative to wild type (Fig. 4C) (Dunnett’s test, P = 0.046; Cox P= 0.027)(table S1). The longevity of male mtor+/- mlst8+/- mice was unaffected (Fig. 4D). Female mtor+/- mlst8+/- mice were not calorie restricted through reduced food intake or increased energy expenditure, and had normal body weights and levels of activity (fig. S7). Consistent with the phenotypic effects, mtor+/- mlst8+/- mice exhibited an approximately 30-60% reduction in the abundance of hepatic mTOR, Raptor, mLST8, and Rictor, whereas the expression of mTOR complex subunits was less affected in Raptor+/- and mtor+/- Raptor+/- heterozygotes (fig. S8).
Figure 4.

Depletion of mTOR and mLST8 uncouples longevity from decreased glucose tolerance. A, B) Kaplan-Meier plots showing lifespans of female (A) and male (B) mice heterozygous for components of the mTOR signaling pathway. C, D) Lifespans of female (C) and male (D) mtor+/- mlst8+/- mice. Wild-type curves are repeated for comparison. E) Quantification of phosphorylated proteins in female wild-type and mtor+/- mlst8+/- livers after an overnight fast and 45 minutes of refeeding (n = 13 wild-type vs. 13 mtor+/- mlst8+/- female mice, * = P < 0.03). F) Q-PCR of mRNA levels for PEPCK and G6Pase in the livers of young female wild type and mtor+/- mlst8+/- mice (* = P < 0.03). G, H) Immunoprecipitation of mTOR complexes reveals preferential loss of Raptor association in mtor+/- mlst8+/- female mice (* = P < 0.02). All bars indicate mean and SEM.
Consistent with the increased lifespan of female mtor+/- mlst8+/- mice, hepatic mTORC1 signaling, as assessed by S6K1 phosphorylation, was decreased by approximately 50% (fig. S9A and Fig. 4E). Although both mTOR and mLST8 are subunits that are shared between the two mTOR complexes, there was no significant change in mTORC2 signaling as assessed by Akt, PKCα, or NDRG1 phosphorylation. Phosphorylation of 4E-BP1 was not changed in the livers of female mtor+/- mlst8+/- mice, however, we observed decreased phosphorylation of 4E-BP1 in mouse tail fibroblasts in vitro (fig. S10, A and B), suggesting that both S6K and 4E-BP1 signaling may be affected. Hepatic S6K1 T389 phosphorylation was also lower in male mtor+/- mlst8+/- mice than in controls (fig. S10C, P < 0.08).
Female mtor+/- mlst8+/- mice had normal glucose tolerance (fig. S9B), insulin sensitivity (fig. S11A), and fasting insulin levels (fig. S11B), further indicating that that mTORC2 signaling was intact. Moreover, female mtor+/- mlst8+/- mice had decreased expression of PEPCK and G6Pase, suggesting that control of hepatic glucose production may even have been improved (Fig. 4H). Although absolute amounts of both mTORC1 and mTORC2 decreased in the livers of female mtor+/- mlst8+/- mice, the ratio of Raptor to mTOR declined more than the ratio of Rictor to mTOR (Fig. 4, I and J). Thus, mTORC2 appears to compete more effectively for a limiting amount of the mTOR catalytic subunit.
Glucose tolerance (area under the curve) was not significantly affected in young animals from any of the strains heterozygous for mTORC1 components, although the glucose tolerance of male Raptor+/- mice improved with age (fig. S11, C and D). The increased lifespan and normal glucose tolerance of female mtor+/- mlst8+/- mice, and the unchanged lifespan despite increased glucose tolerance in male Raptor+/- mice are both indicative that the effects of rapamycin on longevity and glucose homeostasis can be uncoupled.
Our results suggest that rapamycin extends lifespan at least in part via inhibition of mTORC1, and despite impairing glucose homeostasis via disruption of mTORC2 signaling. Female mtor+/- mlst8+/- mice, which had selectively impaired mTORC1 signaling, had increased longevity without overt changes in insulin signaling. Our findings emphasize that mTORC2 disruption profoundly affects metabolism, and may be relevant to the pathogenesis of type 2 diabetes and the metabolic syndrome. S6K1-/- mice, which, like mtor+/- mlst8+/- mice, exhibit female-specific lifespan extension, are resistant to diet-induced weight gain and insulin resistance (8). However, mtor+/- mlst8+/- mice did not display these phenotypes (fig. S12), demonstrating that factors related to energy balance can also be uncoupled from longevity. Specific disruption of mTORC2 extends lifespan in worms fed a nutrient-rich diet (30). If this effect is conserved in mammals, disruption of mTORC2 may contribute to the pro-longevity effect of rapamycin. Nevertheless, our present findings suggest that specific inhibitors of mTORC1 might provide many of the benefits of rapamycin on health and longevity, while avoiding side effects that currently limit its utility.
Supplementary Material
Acknowledgments
We would like to thank all the members of the Baur and Sabatini labs, especially D. Frederick, A. Hutchins, P. Hsu, H. Keys, N. Kalaany, M. Laplante, M. Pacold, and Y. Sancak, for help with protocols, reagents and advice. We also thank D. Cohen and D. Harrison for valuable advice and consultation, C. Patterson for critical reading of the manuscript, and G. Bell of the Whitehead Institute Bioinformatics and Research Computing group for help with statistical analysis and R. mtor, Raptor, and mlst8 deficient mice were generated in collaboration with Bristol-Meyers Squibb. Rictor conditional knockout mice were the kind gift of Mark Magnuson. This project was funded in part by grants from the NIH, NCI (CA 129105), and a Julie Martin Mid-Career Award in Aging Research from the American Federation of Aging Research (AFAR) to DMS, a Research Grant from AFAR and a Bingham Trust Pilot Award from Penn’s Institute on Aging to JAB, and a Damon Runyon Fellowship to DAG. DWL was supported by a Ruth L. Kirschstein National Research Service Award, 1F32AG032833-01A1, LY is supported by a Postdoctoral Fellowship from the American Heart Association, 7600031, and PK is supported by the Academy of Finland and the Foundations’ Post Doc Pool. Core services were provided by Penn’s DERC (P30DK19525). DMS is an Investigator of the Howard Hughes Medical Institute.
References
- 1.Olshansky SJ. Pursuing longevity: delay vs elimination of degenerative diseases. Am J Public Health. 1985 Jul;75:754. doi: 10.2105/ajph.75.7.754. [DOI] [PMC free article] [PubMed] [Google Scholar]
- 2.Harrison DE, et al. Rapamycin fed late in life extends lifespan in genetically heterogeneous mice. Nature. 2009 Jul 16;460:392. doi: 10.1038/nature08221. [DOI] [PMC free article] [PubMed] [Google Scholar]
- 3.Chen C, Liu Y, Zheng P. mTOR regulation and therapeutic rejuvenation of aging hematopoietic stem cells. Sci Signal. 2009;2:ra75. doi: 10.1126/scisignal.2000559. [DOI] [PMC free article] [PubMed] [Google Scholar]
- 4.Kaeberlein M, et al. Regulation of yeast replicative life span by TOR and Sch9 in response to nutrients. Science. 2005 Nov 18;310:1193. doi: 10.1126/science.1115535. [DOI] [PubMed] [Google Scholar]
- 5.Kapahi P, et al. Regulation of lifespan in Drosophila by modulation of genes in the TOR signaling pathway. Curr Biol. 2004 May 25;14:885. doi: 10.1016/j.cub.2004.03.059. [DOI] [PMC free article] [PubMed] [Google Scholar]
- 6.Medvedik O, Lamming DW, Kim KD, Sinclair DA. MSN2 and MSN4 link calorie restriction and TOR to sirtuin-mediated lifespan extension in Saccharomyces cerevisiae. PLoS Biol. 2007 Oct 2;5:e261. doi: 10.1371/journal.pbio.0050261. [DOI] [PMC free article] [PubMed] [Google Scholar]
- 7.Vellai T, et al. Genetics: influence of TOR kinase on lifespan in C. elegans. Nature. 2003 Dec 11;426:620. doi: 10.1038/426620a. [DOI] [PubMed] [Google Scholar]
- 8.Selman C, et al. Ribosomal protein S6 kinase 1 signaling regulates mammalian life span. Science. 2009 Oct 2;326:140. doi: 10.1126/science.1177221. [DOI] [PMC free article] [PubMed] [Google Scholar]
- 9.Colman RJ, et al. Caloric restriction delays disease onset and mortality in rhesus monkeys. Science. 2009 Jul 10;325:201. doi: 10.1126/science.1173635. [DOI] [PMC free article] [PubMed] [Google Scholar]
- 10.Weindruch R, Walford RL. The retardation of aging and disease by dietary restriction. C.C Thomas, Springfield, Ill.; U.S.A.: 1988. p. xvii.p. 436. [Google Scholar]
- 11.Bjedov I, et al. Mechanisms of life span extension by rapamycin in the fruit fly Drosophila melanogaster. Cell Metab. 2010 Jan;11:35. doi: 10.1016/j.cmet.2009.11.010. [DOI] [PMC free article] [PubMed] [Google Scholar]
- 12.Bordone L, Guarente L. Calorie restriction, SIRT1 and metabolism: understanding longevity. Nat Rev Mol Cell Biol. 2005 Apr;6:298. doi: 10.1038/nrm1616. [DOI] [PubMed] [Google Scholar]
- 13.Lee HY, et al. Targeted expression of catalase to mitochondria prevents age-associated reductions in mitochondrial function and insulin resistance. Cell Metab. 2010 Dec 1;12:668. doi: 10.1016/j.cmet.2010.11.004. [DOI] [PMC free article] [PubMed] [Google Scholar]
- 14.Dominici FP, Hauck S, Argentino DP, Bartke A, Turyn D. Increased insulin sensitivity and upregulation of insulin receptor, insulin receptor substrate (IRS)-1 and IRS-2 in liver of Ames dwarf mice. J Endocrinol. 2002 Apr;173:81. doi: 10.1677/joe.0.1730081. [DOI] [PubMed] [Google Scholar]
- 15.Bluher M, Kahn BB, Kahn CR. Extended longevity in mice lacking the insulin receptor in adipose tissue. Science. 2003 Jan 24;299:572. doi: 10.1126/science.1078223. [DOI] [PubMed] [Google Scholar]
- 16.Anson RM, et al. Intermittent fasting dissociates beneficial effects of dietary restriction on glucose metabolism and neuronal resistance to injury from calorie intake. Proc Natl Acad Sci U S A. 2003 May 13;100:6216. doi: 10.1073/pnas.1035720100. [DOI] [PMC free article] [PubMed] [Google Scholar]
- 17.Selman C, et al. Evidence for lifespan extension and delayed age-related biomarkers in insulin receptor substrate 1 null mice. Faseb J. 2007 Oct 10; doi: 10.1096/fj.07-9261com. [DOI] [PubMed] [Google Scholar]
- 18.Taguchi A, Wartschow LM, White MF. Brain IRS2 signaling coordinates life span and nutrient homeostasis. Science. 2007 Jul 20;317:369. doi: 10.1126/science.1142179. [DOI] [PubMed] [Google Scholar]
- 19.Zheng Y, et al. Improved insulin sensitivity by calorie restriction is associated with reduction of ERK and p70S6K activities in the liver of obese Zucker rats. J Endocrinol. 2009 Dec;203:337. doi: 10.1677/JOE-09-0181. [DOI] [PMC free article] [PubMed] [Google Scholar]
- 20.Cunningham JT, et al. mTOR controls mitochondrial oxidative function through a YY1-PGC-1alpha transcriptional complex. Nature. 2007 Nov 29;450:736. doi: 10.1038/nature06322. [DOI] [PubMed] [Google Scholar]
- 21.Fraenkel M, et al. mTOR inhibition by rapamycin prevents beta-cell adaptation to hyperglycemia and exacerbates the metabolic state in type 2 diabetes. Diabetes. 2008 Apr;57:945. doi: 10.2337/db07-0922. [DOI] [PubMed] [Google Scholar]
- 22.Houde VP, et al. Chronic rapamycin treatment causes glucose intolerance and hyperlipidemia by upregulating hepatic gluconeogenesis and impairing lipid deposition in adipose tissue. Diabetes. 2010 Jun;59:1338. doi: 10.2337/db09-1324. [DOI] [PMC free article] [PubMed] [Google Scholar]
- 23.Johnston O, Rose CL, Webster AC, Gill JS. Sirolimus is associated with new-onset diabetes in kidney transplant recipients. J Am Soc Nephrol. 2008 Jul;19:1411. doi: 10.1681/ASN.2007111202. [DOI] [PMC free article] [PubMed] [Google Scholar]
- 24.Teutonico A, Schena PF, Di Paolo S. Glucose metabolism in renal transplant recipients: effect of calcineurin inhibitor withdrawal and conversion to sirolimus. J Am Soc Nephrol. 2005 Oct;16:3128. doi: 10.1681/ASN.2005050487. [DOI] [PubMed] [Google Scholar]
- 25.Sarbassov DD, et al. Prolonged rapamycin treatment inhibits mTORC2 assembly and Akt/PKB. Mol Cell. 2006 Apr 21;22:159. doi: 10.1016/j.molcel.2006.03.029. [DOI] [PubMed] [Google Scholar]
- 26.Garcia-Martinez JM, Alessi DR. mTOR complex 2 (mTORC2) controls hydrophobic motif phosphorylation and activation of serum- and glucocorticoid-induced protein kinase 1 (SGK1) Biochem J. 2008 Dec 15;416:375. doi: 10.1042/BJ20081668. [DOI] [PubMed] [Google Scholar]
- 27.Bentzinger CF, et al. Skeletal muscle-specific ablation of raptor, but not of rictor, causes metabolic changes and results in muscle dystrophy. Cell Metab. 2008 Nov;8:411. doi: 10.1016/j.cmet.2008.10.002. [DOI] [PubMed] [Google Scholar]
- 28.Cybulski N, Polak P, Auwerx J, Ruegg MA, Hall MN. mTOR complex 2 in adipose tissue negatively controls whole-body growth. Proc Natl Acad Sci U S A. 2009 Jun 16;106:9902. doi: 10.1073/pnas.0811321106. [DOI] [PMC free article] [PubMed] [Google Scholar]
- 29.Kumar A, et al. Fat cell-specific ablation of rictor in mice impairs insulin-regulated fat cell and whole-body glucose and lipid metabolism. Diabetes. 2010 Jun;59:1397. doi: 10.2337/db09-1061. [DOI] [PMC free article] [PubMed] [Google Scholar]
- 30.Soukas AA, Kane EA, Carr CE, Melo JA, Ruvkun G. Rictor/TORC2 regulates fat metabolism, feeding, growth, and life span in Caenorhabditis elegans. Genes Dev. 2009 Feb 15;23:496. doi: 10.1101/gad.1775409. [DOI] [PMC free article] [PubMed] [Google Scholar]
- 31.Festuccia WT, Blanchard PG, Richard D, Deshaies Y. Basal adrenergic tone is required for maximal stimulation of rat brown adipose tissue UCP1 expression by chronic PPAR-gamma activation. Am J Physiol Regul Integr Comp Physiol. 2010 Jul;299:R159. doi: 10.1152/ajpregu.00821.2009. [DOI] [PubMed] [Google Scholar]
- 32.Laplante M, et al. Mechanisms of the depot specificity of peroxisome proliferator-activated receptor gamma action on adipose tissue metabolism. Diabetes. 2006 Oct;55:2771. doi: 10.2337/db06-0551. [DOI] [PubMed] [Google Scholar]
- 33.Kim JY, et al. Obesity-associated improvements in metabolic profile through expansion of adipose tissue. J Clin Invest. 2007 Sep;117:2621. doi: 10.1172/JCI31021. [DOI] [PMC free article] [PubMed] [Google Scholar]
- 34.Sarbassov DD, et al. Prolonged rapamycin treatment inhibits mTORC2 assembly and Akt/PKB. Mol Cell. 2006 Apr 21;22:159. doi: 10.1016/j.molcel.2006.03.029. [DOI] [PubMed] [Google Scholar]
- 35.Sengupta S, Peterson TR, Laplante M, Oh S, Sabatini DM. mTORC1 controls fasting-induced ketogenesis and its modulation by ageing. Nature. 2010 Dec 23;468:1100. doi: 10.1038/nature09584. [DOI] [PubMed] [Google Scholar]
- 36.Guertin DA, et al. mTOR complex 2 is required for the development of prostate cancer induced by Pten loss in mice. Cancer Cell. 2009 Feb 3;15:148. doi: 10.1016/j.ccr.2008.12.017. [DOI] [PMC free article] [PubMed] [Google Scholar]
- 37.Ruzankina Y, et al. Deletion of the developmentally essential gene ATR in adult mice leads to age-related phenotypes and stem cell loss. Cell Stem Cell. 2007 Jun 7;1:113. doi: 10.1016/j.stem.2007.03.002. [DOI] [PMC free article] [PubMed] [Google Scholar]
- 38.Guertin DA, et al. Ablation in mice of the mTORC components raptor, rictor, or mLST8 reveals that mTORC2 is required for signaling to Akt-FOXO and PKCalpha, but not S6K1. Dev Cell. 2006 Dec;11:859. doi: 10.1016/j.devcel.2006.10.007. [DOI] [PubMed] [Google Scholar]
- 39.Singhal NS, Lazar MA, Ahima RS. Central resistin induces hepatic insulin resistance via neuropeptide Y. J Neurosci. 2007 Nov 21;27:12924. doi: 10.1523/JNEUROSCI.2443-07.2007. [DOI] [PMC free article] [PubMed] [Google Scholar]
- 40.Varela GM, et al. Inhibition of ADRP prevents diet-induced insulin resistance. Am J Physiol Gastrointest Liver Physiol. 2008 Sep;295:G621. doi: 10.1152/ajpgi.90204.2008. [DOI] [PMC free article] [PubMed] [Google Scholar]
- 41.Sancak Y, et al. The Rag GTPases bind raptor and mediate amino acid signaling to mTORC1. Science. 2008 Jun 13;320:1496. doi: 10.1126/science.1157535. [DOI] [PMC free article] [PubMed] [Google Scholar]
Associated Data
This section collects any data citations, data availability statements, or supplementary materials included in this article.