

Abstract
In this paper, we are proposing a novel automated method to recognize centroblast (CB) cells from non-centroblast (Non-CB) cells for computer-assisted evaluation of follicular lymphoma tissue samples. The method is based on training and testing of a quadratic discriminant analysis (QDA) classifier. The novel aspects of this method are the identification of the CB object with prior information, and the introduction of the principal component analysis (PCA) in the spectral domain to extract color texture features. Both geometric and texture features are used to achieve the classification. Experimental results on real follicular lymphoma images demonstrate that the combined feature space improved the performance of the system significantly. The implemented method can identify centroblast cells (CB) from non-centroblast cells (non-CB) with a classification accuracy of 82.56%.
Index–Terms: Follicular Lymphoma, color texture, geometric features, spectral domain, QDA, PCA
I. INTRODUCTION
Follicular lymphoma (FL) accounts for 20–25% of non-Hodgkin lymphomas in the US [1] and affects almost exclusively predominantly adults, particularly the middle-aged and elderly. This lymphoma is characterized by at least a partial follicular or nodular pattern and is composed of lymphoid cells of follicular center origin including small cleaved cells (centrocytes) and larger non-cleaved cells (centroblasts). Grading of FL is crucial for risk stratification, prognosis and treatment and is based on the average number of centroblasts per high power field (40X) in ten representative neoplastic follicles. This method of grading is fraught with inter and intra-observer variability leading to poor reproducibility and prompting the search for a more accurate and efficient method of quantifying centroblasts and more reproducible grading.
The growing importance of Computer Aided Diagnosis (CAD) can be seen in many fields involved in medical study [2, 3]. Of interest here are pathological biopsies and their diagnostic and prognostic indicators. In a CAD system, image processing techniques are applied to extract quantitative and precise features and used for further analysis of the images. Afterwards, discriminant techniques, such as parametric and non-parametric statistical classifiers, are employed to classify the images. The selection of the image processing techniques and the classification strategies are important for the successful implementation of any machine vision system. Several statistical, structural and spectral texture approaches for grayscale images have been suggested [4–7].
The goal of this study is to develop a method to reduce inter- and intra-reader variability between pathologists to grade FL. In our previous work, we have used color and texture features and model-based intermediate representations for the grading of follicular lymphoma [8–14].
In this paper we are introducing a new approach that takes into consideration the geometric identification of objects and texture in the color space. A multivariate image analysis technique using principal component analysis (PCA) in the spectral domain is investigated. Instead of gray scale, color spaces are utilized and R, G, B, L, a, b, H, and I color spaces are explored.
This paper is organized as follows. Section 2, we present the data. In section 3, we describe the proposed method and its methodology. Experimental results and discussion are presented in section 4. Finally, conclusion is offered in section 5.
II. DATA
Since the focus of this study is to classify CB versus Non-CB cells, using a supervised classifier, we collected a data set of two populations. The images in the first set are graded by two pathologists as CB and none of the images in the second one is graded by any pathologist as CB. The ground truth is composed of a set 218 CB and 218 Non-CB H&E images. It is important to note that the ground truth data are not manually annotated and the contours of the cells are not marked.
III. Description of the methodology
The algorithm that we are proposing is based on a supervised quadratic classifier known as quadratic discriminant analysis classifier (QDA). To accomplish the classification, we are considering a set of training features representing some geometric and texture characteristics of the image. The training of the QDA classifier is completed on a set of features combining geometric and color texture characteristics.
Pathologists identify CB cells from Non-CB cells mainly by observing specific, quantifiable structures in the image. In their routine, they compare visually the size of the cells and pick the cells that are larger compared to the rest. A visual scale of measurement typically employed is by comparing to some blood cells. In our case, the geometric characteristics of the large cell and the texture of the image are taken into consideration.
A)- Cell identification
In order to extract the geometric features of each image of the data set, we have devised a method based on a succession of thresholding, morphological operations and area identification. The sequential processing steps of the method are described as:
The RGB image is converted into the Lab space. The Lab space is recognized to be more perceptually uniform in respect to RGB space and present a better overall contrast. The L channel is kept for further processing, while a and b channels are discarded.
Otsu thresholding method [15] is then applied on the image obtained from step 1. This operation allows segmenting out the background and therefore extracting the objects of interest present in the image.
Opening and closing morphology operations are then applied on the complement of the binary image obtained in step 2 A labeling morphology operation is computed on the resulting binary image to identify each object in the image. The connectivity is chosen to be equal to eight.
-
The area measurement is then calculated for each labeled object. The greatest area, which corresponds to the largest object in the image, is then identified. Figure 1 illustrates the different steps of the processing. This process mimics to some degree the procedure followed by pathologists to identify large versus small cells in the image. Equation (1) summarizes the identification operation:
(1) where Ω is the vector containing all labeled regions. Ai is the area of the ith label in the image. AF is the area of the largest cell in the image.
Once the region is identified, an erosion and dilatation operations with a disk-shaped structuring element of radius 3 are applied on the binary image to reconstruct the initial shape of the largest cell.
Figure 1.
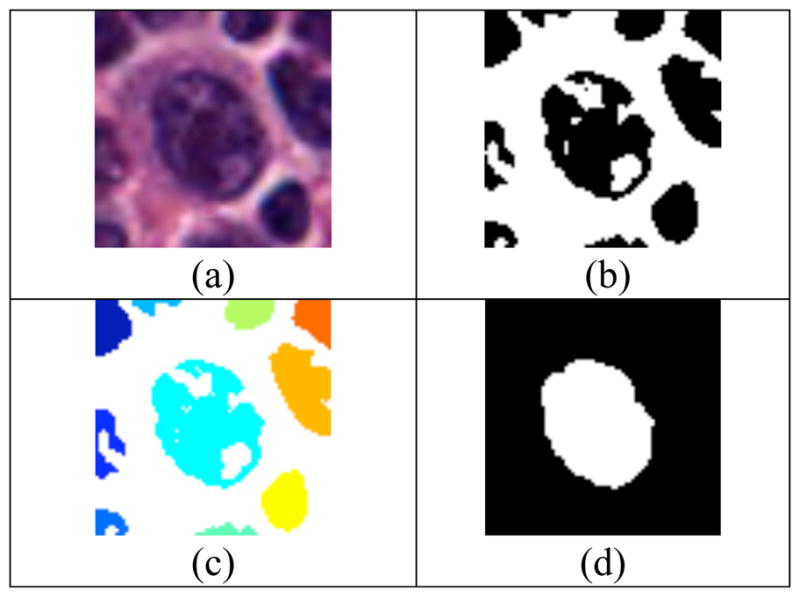
shows in (a) original image, in (b) thresholding operation of image in (a), in (c) labeling operation of image in (b), and in (d) identification operation
Along with the area, we have computed also the perimeter of the cell. These parameters and the color parameters are combined to form the feature vector used to train the classifier.
B)- Texture color features
Expert pathologists describe the CB cells as containing several dark nucleoluses surrounded by bright uniform cytoplasm. On the other hand, the Non-CB cells present a homogenous, dense structure. We have also noticed that the color is another criteria that pathologists used in their scoring.
These indications help us to build our model around analyzing the inner color texture of the cells. Therefore, we propose to quantify texture features extracted from several color channels: R, G, B, H, I, L, a, and b.
Many definitions of the texture have been proposed in the literature [3–7]. They formulate image texture as a function of roughness, coarseness, directionality, homogeneity, spatial frequency, etc. There is no general agreement on one definition. The best definition depends on the particular application.
In this paper, we are interested in the statistical analysis of texture in the Fourier domain. The variation of the power spectrum along the frequency scale can be a good descriptor of the texture. Here, a statistical analysis based on PCA is proposed to quantify this variation. The variance of the first order eigenvector is calculated from the PCA of the power spectrum. This feature is computed in each of the color spaces specified above.
The power spectrum of an image is defined as:
| (2) |
Where F (u, v) is the Fourier transform (FFT) of the image. The variables u and v are horizontal and vertical frequencies defined in the polar axis respectively. The functions real and imag are the real and the imaginary parts of the FFT.
Generally, PCA transforms the data into a new orthogonal coordinate system such that the greatest variance by any projection of the data comes to lie on the first coordinate axis (called the first principal component), the second greatest variance on the second coordinate axis, and so on. PCA is theoretically the optimum transform for a given data in least squares terms [6].
The eigenvectors ei and the corresponding eigenvalues λi are the solutions of the equation:
| (3) |
In our case, the covariance matrix Cx is defined in the spectral domain as follows:
| (4) |
where S is the power spectrum matrix, and μP is the mean of the matrix S.
We assume that the λi are distinct. These values can be found by solving the following equation:
| (5) |
Where I is the identity matrix having the same order as Cx and |·| denotes the determinant of the matrix.
Reordering the eigenvectors and corresponding eigenvalues in a decreasing order; the first component corresponding to the greatest eigenvalue is selected from the rest of the components. This mode is suggested to carry most of the texture variations in the image compared to the rest of the modes. We are limiting the quantification to the first mode in order to filter out the noise from the texture. It is suggested that the noise is located in higher modes. The variance of the first component is calculated to quantify these variations. It is defined as follows:
| (6) |
Where X is the first eigenvector and μ is the mean of the same vector.
In our model, we are proposing the variance as quantification of the texture color feature. This value is calculated in each proposed space and used as feature in the training process. The union of the geometrical features vector and texture color features vector define the final features vector.
C)- Design of the classifier
To demonstrate a proof of concept of our approach, we are suggesting a statistical classification. The classification is based on quadratic discriminate analysis (QDA). QDA is used in machine learning and statistical classification to separate measurements of two or more classes of objects by a quadratic surface [16,17]. It is closely related to linear discriminant analysis (LDA), where it is assumed that there are only two classes of points (0 and 1).
For the quadratic classifier, the correct solution is supposed to be quadratic, and the predicted class y from a training set of observations x is derived from the following:
| (7) |
The vector x is the observation vector, and A is features matrix.
IV. Experimental Results and Discussion
In order to train the classifier we have divided CB and Non-CB data into training and testing sets using an 80%-20% ratio. The 20% of each population used as testing set are chosen randomly. The residual 80% of CB and Non-CB images allocated for training are divided again into 90% for training and 10% for testing using the “Hold-out K-folds” cross-validation approach. Empirically, K is set to 10. This operation is repeated 10 times to select the best training set. The training set producing the highest performance is picked as the final training set. The final testing is then applied on the testing set obtained from initial 80%-20% allocation. Table 1 demonstrates the 90%-10% training approach using the supervised QDA classifier. The same rule is used in training and testing operations. In this example, the training set corresponding to the highest performance of the classifier, is identified as set 6. Its classification accuracy is equal to 88%. This set is then selected as the training set for further testing of the classifier. The testing of the QDA classifier is completed on the 20% remaining images (88 images). The average classification rate of the classifier obtained from the testing is equal to 82.56%.
Table 1.
shows the 90%–10% training methodology
| Set | Performance |
|---|---|
| 1 | 0.705882 |
| 2 | 0.617647 |
| 3 | 0.852941 |
| 4 | 0.705882 |
| 5 | 0.764706 |
| 6 | 0.882353 |
| 7 | 0.617647 |
| 8 | 0.705882 |
| 9 | 0.794118 |
| 10 | 0.852941 |
In order to demonstrate the usefulness of the system, we have enlisted two experienced pathologists to complete two different experiments. The experiments are realized on the testing set data. In the first experiment the pathologists graded the images without CAD assistance.
In the second experiment, we displayed the results of the CAD system on the same data set and asked them if either they agreed with the results or not. In case there is a disagreement of judgment between the pathologist and the CAD, the pathologist is free to change the grading. It is important to note these experiments are administered on different days for each pathologist.
Table 2 demonstrates some comparison between the grading of the two pathologists. Inter- and intra-reader variability are shown. One can notice that the pathologists are not in agreement in all cases. Inter- and intra-reader variability errors are introduced during their subjective reading. Although the performance of the algorithm is around 80%, it should be noted that the intra- and inter-reader variability is more than 25%.
Table 2.
demonstrates inter and intra variability reading
| Inter variability | Intra variability | |
|---|---|---|
| Pathologist 1 | - | 25% |
| Pathologist 2 | 26.13% | 28.40% |
IV. Conclusion
In this paper, we have demonstrated a new quantitative methodology to diagnosis CB versus Non-CB cells in follicular lymphoma disease using geometric and color texture features in the spectrum. The goal of this study is to highlight inter- and intra-reader variability reading that the pathologists introduce during their reading and propose a method to reduce these errors. In our future work, we will further develop the segmentation algorithm by taking into account the variations in staining and by using other color texture features with the model-based intermediate representation. The current classification rate obtained by the classifier (82.56%) is very encouraging considering the inter and intra-reader variability of the pathologists which is over 25%.
Acknowledgments
This work was supported in part by The Ohio State University Clinical and Translational Science Program.
Contributor Information
Kamel Belkacem-Boussaid, Email: Kamel.Boussaid@osumc.edu, Department of Biomedical Informatics, The Ohio State University, Columbus, OH 43210 USA (phone: 614-292-1084; fax: 614-688-6600).
Olcay Sertel, Department of Biomedical Informatics, The Ohio State University, Columbus, OH 43210 USA (phone: 614-292-1084; fax: 614-688-6600).
Gerard Lozanski, Department of Pathology, The Ohio State University, Columbus, OH 43210 USA.
Arwa Shana’aah, Department of Pathology, The Ohio State University, Columbus, OH 43210 USA.
Metin Gurcan, Email: Metin.Gurcan@osumc.edu, Department of Biomedical Informatics, The Ohio State University, Columbus, OH 43210 USA (phone: 614-292-1084; fax: 614-688-6600).
V. References
- 1.Griffin NR, Howard MR, Quirke P, O’Brian CJ, Child JA, Bird CC. Prognostic indicators in centroblastic-centrocytic lymphoma. J Clin Pathol. 1988;41:866–870. doi: 10.1136/jcp.41.8.866. [DOI] [PMC free article] [PubMed] [Google Scholar]
- 2.Fenton JJ, Taplin SH, Carney PA, Abraham L, Sickles EA, D’Orsi C, et al. Influence of computer-aided detection on performance of screening mammography. N Engl J Med. 2007 April 5;356(14):1399–409. doi: 10.1056/NEJMoa066099. [DOI] [PMC free article] [PubMed] [Google Scholar]
- 3.Wu N, Gamsu G, Czum J, Held B, Thakur R, Nicola G. Detection of small pulmonary nodules using direct digital radiography and picture archiving and communication systems. J Thorac Imaging. 2006 Mar;21(1):27–31. doi: 10.1097/01.rti.0000203638.28511.9b. [DOI] [PubMed] [Google Scholar]
- 4.Gonzalez RC, Wintz P. Digital Image Processing. 2. Addison-Wesley; Reading: 1987. [Google Scholar]
- 5.Rangayyan RM. In: Biomedical Image Analysis. Neumann MR, editor. CRC Press; 2005. [Google Scholar]
- 6.Tuceryan M, Jain A. The Handbook of Pattern Recognition and Computer Vision. 2. World Scientific Publishing Co; 1998. Texture Analysis; pp. 207–248. [Google Scholar]
- 7.Haralick RM. Statistical and structural approaches to texture. Proceedings of the IEEE. 1979;67(5):786–804. [Google Scholar]
- 8.Sertel O, Kong J, Catalyurek UV, Lozanski G, Saltz J, Gurcan MN. Histopathological image analysis using model-based intermediate representations and colour texture: Follicular lymphoma grading. The Journal of Signal Processing Systems. 2008 in print. [Google Scholar]
- 9.Sertel O, Kong J, Lozanski G, Catalyurek U, Saltz J, Gurcan MN. Computerized microscopic image analysis of follicular lymphoma; SPIE Medical Imaging’08; San Diego, California. February, 2008. [Google Scholar]
- 10.Sertel O, Kong J, Catalyurek U, Lozanski G, Shanaah A, Saltz J, Gurcan MN. Texture classification using nonlinear colour quantization: Application to histopathological image analysis. IEEE ICASSP’08; Las Vegas, NV. March, 2008. [Google Scholar]
- 11.Kong J, Sertel O, Lozanski G, Boyer K, Saltz J, Gurcan MN. Automated detection of follicular centers for follicular lymphoma grading. APIII 2007; Pittsburg, PA. September, 2007. [Google Scholar]
- 12.Sertel O, Kong J, Lozanski G, Shimada H, Catalyurek U, Saltz J, Gurcan MN. Texture characterization for whole-slide histopathological image analysis: Applications to neuroblastoma and follicular lymphoma. APIII 2007; Pittsburg, PA. September, 2007. [Google Scholar]
- 13.Kong J, Sertel O, Gewirtz A, Shana’ah A, Racke F, Zhao J, Boyer K, Catalyurek U, Gurcan MN, Lozanski G. Development of computer based system to aid pathologists in histological grading of follicular lymphomas. ASH 2007; Atlanta, GA. December, 2007. [Google Scholar]
- 14.Gurcan MN, Sertel O, Kong J, Ruiz A, Ujaldon M, Catalyurek U, Lozanski G, Shimada H, Saltz J. Computer-assisted histopathology: Experience with neuroblastoma and follicular lymphoma. Workshop on Bio-image Informatics: Biological Imaging, Computer Vision and Data Mining; Santa Barbara, CA. January 2008. [Google Scholar]
- 15.Otsu N. A threshold selection method from gray-level histograms. IEEE Trans on Sys Man Cyber. 1979;9:62–66. [Google Scholar]
- 16.Bishop Christopher M. Pattern Recognition and Machine Learning. Springer; 2006. [Google Scholar]
- 17.Duda Richard O, Hart Peter E, Stork David G. Pattern classification. 2. Wiley; New York: 2001. [Google Scholar]