

Abstract
A competitive enzyme-linked aptamer assay (ELAA) to detect tetracycline in milk was performed by using two different aptamers individually; one is 76 mer-DNA aptamer and the other is 57 mer-RNA aptamer. The best optimum condition was obtained without monovalent ion, Na+ and also by adding no Mg2+ ion in the assay buffer, along with RT incubation. The optimized ELAA showed a good sensitivity (LOD of 2.10 × 10⁻⁸ M) with a wide dynamic range (3.16 × 10⁻⁸ M ~ 3.16 × 10⁻⁴ M). In addition, the average R.S.D. across all data points of the curve was less than 2.5% with good recoveries (~101.8%) from the milk media. Thus, this method provides a good tool to monitor tetracycline in milk from MRLs' point of view. However, this ELAA method was not superior to the ELISA method in terms of specificity. This paper describes that it does not always give better sensitivity and specificity in assays even though aptamers have several advantages over antibodies and have been known to be good binders for binding assays.
1. Introduction
Aptamer-based biosensing system has been widely investigated and developed to detect various proteins, small chemicals, and metabolites such as nucleic acids and carbohydrates in biological, environmental substance and food products [1–11]. Aptamers are functional oligonucleotides of single-stranded DNA or RNA which can recognize and bind to the specific target molecules with high affinity, specificity, and selectivity. As biomolecular recognizers, aptamers are used for diagnostic and therapeutic applications. Due to their small size, aptamers might be able to reduce steric hindrance and approach analytes more easily. Suitable aptamers can be selected by in vitro selection process called SELEX (systematic evolution of ligands by exponential enrichment) [2, 3] and generated in the short term compared with antibodies.
Tetracyclines (TCs) are a group of broad-spectrum antibacterial agent. These have been widely used to treat bacterial infections in both humans and animals and to promote growth rate for animals. TCs are used in pure or mixed form with derivatives, oxytetracycline (OTC), chlortetracycline (CTC), and doxycycline (DC) (Figure 1) [12]. Therefore, food products from medicated animals such as meat [13], milk [14–16], fish [17, 18], and eggs [18] may contain TC residues and may cause serious health problems in people who take these food. According to the Codex MRLs (maximum residue levels) database, the MRLs of TCs are 100 μg/kg in milk, 200 μg/kg in muscle, 600 μg/kg in liver, and 1200 μg/kg in kidney (cattle).
Figure 1.
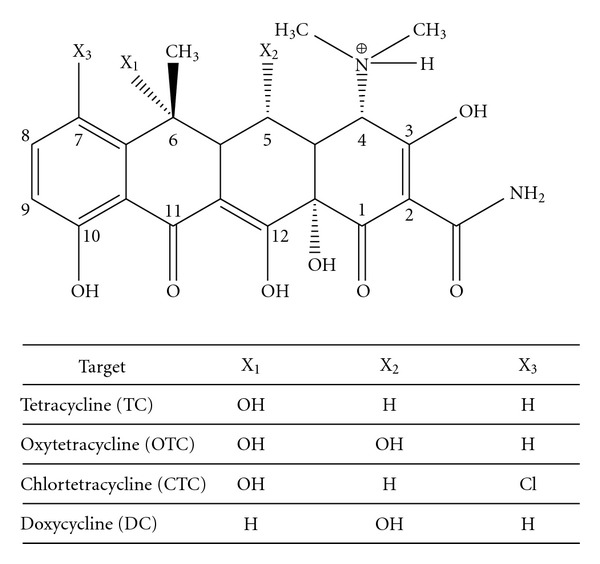
General structure of TCs.
Several methods have been reported for the detection of TCs using a variety of techniques, such as high-performance liquid chromatography (HPLC) and liquid chromatography-tandem mass spectrometry (LC-ESI-MS/MS) [19, 20]. These instrumental analyses provide simultaneous and accurate detection of TCs, including basic TC, OTC, DC, and 4-epitetracycline. However, these methods require expensive instruments and sample extraction and cleanup. There is a need for fast, easy to use, and cost-effective analytical methods. Indeed, well-established immunoassay techniques were developed to meet these requirements [21–23].
Recently, enzyme-linked immunosorbent assays were performed for determination of TC in food. These assays provide specificity, high sensitivity with less than 0.4 μg/L of detection limit, and broad dynamic range that enable to detect target molecules [21–23]. Although the ability of antibodies to bind to their target is remarkable, there are some drawbacks, including a complicated process for antibody production and stability under elevated temperatures. By comparison, aptamers have several advantages. They are highly chemically stable over a wide temperature range, have reversible denaturation, and can be isolated by in vitro methods without immune response. Thus, aptamers are synthesized rapidly. DNA aptamer can be obtained in just a few days. Furthermore, they are easy to modify and label. A site-specific modification techniques are developed to attach various molecules such as biotin groups [9], thiol groups [24], and label molecules [8] at 3′ or 5′ end of aptamer without affecting the target binding site and can make one-to-one conjugate (aptamer : label) like gene-fusion technique [25–27].
TC has several binding aptamers, including 76 mer-DNA aptamer and 57 mer-RNA aptamer [12, 28]. 76 mer-DNA aptamer has high affinities for the basic TC backbone and has a dissociation constant (K d) of 63 nM [26, 27]. An electrochemical aptasensor has been studied utilizing this DNA aptamer [29, 30]. RNA aptamer can fold and form binding pocket to accommodate TC. It also binds to TCs tightly with a K d of 770 pM, as determined by fluorimetry [28]. TC is a flat polycyclic molecule and has one aromatic ring. One face of the molecule makes ionic interaction with a part of RNA residues, while the other face associates with another part by multiple stacking or hydrophobic interactions [28, 31]. Several reports suggest that magnesium ions are also essential for TC binding, because RNA aptamer recognizes this metal ion that coordinates the TC [28, 31–33].
To stabilize the conformation of aptamer, monovalent cations such as Li+, Na+, and K+ have been used in aptamer assays as well as divalent ions. In some thrombin aptasensor studies, the effects of these cations were validated by addition of Na+ or K+ which can stabilize G-quadruplex structure and reduce nonspecific binding [34, 35]. However, Na+ or K+ is able to interact with negatively charged phosphate backbone of the aptamer and form weak complexes at higher concentration of cations [34]. Thus, they may lead to the conformational changes of binding site and cause aptamer's lower affinity to their target.
In this work, we establish a competitive enzyme-linked aptamer assay (ELAA) based on both DNA and RNA aptamers as recognition elements to determine residues of TC in milk samples. The biotinylated-aptamer was immobilized onto microplate via avidin-biotin interaction. Although the aptamers are known as binders with low nanomolar K d values and exceptional recognition ability like antibodies, the specificity of aptamer has not been verified as well as that of antibodies. Also, we report that aptamers can measure the amount of TCs with maximum accuracy and provide the assay sensitivity (LOD) and % recovery rates in milk matrix.
2. Materials and Methods
2.1. Reagents
A single-stranded DNA aptamer was purchased from Genotech (Daejeon, Korea) and had the following sequences: 76 mer, 5′-CGT ACG GAA TTC GCT AGC CCC CCG GCA GGC CAC GGC TTG GGT TGG TCC CAC TGC GCG TGG ATC CGA GCT CCA CGT G-3′-biotin (Mw. (23746.2), mp (88.8°C)). The DNA aptamer was modified through 3′-end biotin modification using biotin-triethylene glycol (TEG).
An RNA aptamer was synthesized with a DMT- (dimethoxytrityl-) Biotin amidite at the 5′ end by ST Pharm (Seoul, Korea). The sequences are shown as the following: 57 mer, biotin-5′-GAG CCU AAA ACA UAC CAG AGA AAU CUG GAG AGG UGA AGA AUA CGA CCA CCU AGG CUC-3′ (Mw. (18869.7), mp (86.8°C)).
Hydrochlorides of TC, OTC, CTC, and DC were purchased from Sigma (St. Louis, Mo, USA). Neutravidin was obtained from Pierce (Rockford, Ill, USA). Bovine serum albumin (BSA), ovalbumin (OVA), trichloroacetic acid (TCA), Na2EDTA, 3,3′,5,5′-tetramethylbenzidine dihydrochloride (TMB), and phosphate-citrate buffer with sodium perborate were supplied from sigma (St. Louis, Mo, USA). Sodium bicarbonate, sodium carbonate, sodium phosphate monobasic, sodium phosphate dibasic, citric acid monohydrate, and sodium chloride were purchased from Duksan Pure Chemical (Ansan, Kyunggido, Korea). McIlvain buffer solution was prepared by dissolving 11.8 g of citric acid monohydrate, 13.72 g of Na2HPO4, and 33.62 g of Na2EDTA in one liter of distilled water [21]. All chemicals were of analytical grade, and triply deionized water (Milli-Q water purification system, Millipore, Billerica, Mass, USA) was used. All buffers were filtered using 0.20 μm membrane filter system.
2.2. Instrumentation
ELAA was performed in Flat-bottomed polystyrene immuno plates (Nunc, Denmark). Enzyme activity was detected using E-max microtiter plate reader (Molecular Device Co., Sunnyvale, Calif, USA) at 450 nm. Microplates were washed using Multiwasher III (Tricontinent, Grass valley, Calif, USA). Centrifugation was performed in Supra22K from Hanil Sci. (Incheon, Korea).
2.3. Optimization of Assay Conditions
Prior to the DNA aptamer assay, the optimization was carried out by varying concentrations of aptamer and TC-HRP because the assay sensitivity is dependent on the concentrations of binder and competitor. The DNA aptamer was diluted to 0.025 μg mL−1, 0.0188 μg mL−1, and 0.0125 μg mL−1. The TC-HRP conjugates were prepared in a concentration of 1 μg mL−1 and 0.5 μg mL−1. The optimization of amount of neutravidin was also performed in three different concentrations of 1 μg mL−1, 0.5 μg mL−1, and 0.1 μg mL−1. The incubation temperature was examined by incubating DNA aptamer, standard TC solution, and TC-HRP at 4°C or RT, respectively. The assay was conducted with the aptamer with and without a thermal treatment before immobilization, and the results were compared. The thermal denaturation was performed by heating the aptamer at 95°C for 10 min and then cooling it rapidly in ice.
In the RNA aptamer assay, it was performed for optimization of operating conditions. The incubation temperature was also examined by incubating at 4°C or RT. Several buffers were compared as diluents for all materials, including 10 mM phosphate, PBS, and phosphate containing 2.5 mM and 5 mM Mg2+. To optimize the concentration of aptamer, the RNA aptamer solution was diluted as ranging from 0.02 μg mL−1 to 0.1 μg mL−1 in 10 mM phosphate buffer.
2.4. Enzyme-Linked Aptamer Assay for TC
Neutravidin was diluted to 1 μg mL−1 in coating buffer (50 mM bicarbonate buffer, pH 9.6), and 100 μL was added to wells. The plate was stored with constant shaking at 4°C for 16 h. To remove unbound neutravidin, wells were washed three times with 300 μL well−1 of the wash buffer, PBS-T (10 mM PBS, pH 7.2, 0.05% Tween-20). The plate was then blocked with 300 μL well−1 of blocking agents (3% bovine serum albumin (BSA) or 1% ovalbumin (OVA)) in 10 mM phosphate buffer for 30 min at RT, and unbound BSA was removed. Subsequently, 100 μL of the biotinylated DNA aptamer (0.0188 μg mL−1) or RNA aptamer (0.07 μg mL−1) was added to each well, respectively, and binding was allowed for 1 h at RT. The unbound materials were removed by washing three times with the wash buffer (10 mM PBS-T). TC was diluted to 2 × 10⁻³ M–2 × 10⁻¹² M in assay buffer (10 mM phosphate, pH 7.2). Each 50 μL of various concentrations of TC solution was added in triplicate, and the plate was incubated at RT for 30 min. Then, 50 μL TC-HRP (1 μg mL−1) in assay buffer was added to the plate. An incubation step was accomplished for 30 min with constant shaking at RT. After washing, 100 μL of TMB in substrate buffer (50 mM phosphate-citrate buffer, pH 5.0) was added and incubated for 10 min at RT. The color of solution changed from colorless to blue. The color reaction was stopped by adding 50 μL of H2SO4 (2 M). Then, absorbance was read at 450 nm.
2.5. Cross-Reactivity Study
The cross-reactivity study was performed in the same way as the TC assay. OTC, CTC, and DC were used as cross-reactants. These are antibacterial agents with structure related to TC.
2.6. Pretreatment for Milk Assay
TC was spiked in milk. Milk contains protein, fat, carbohydrate, and cations such as Ca2+ and Mg2+ which can form chelation complexes with TC. To remove these inhabitants, 1 mL of milk sample in which TC spiked in advance was mixed with 4 mL of McIlvaine buffer contained 0.02 M EDTA (pH 4.0) and 0.4 mL of trichloroacetic acid was added to this mixture. Then, the milk sample was defatted and deproteinized by centrifugation at 4°C (5000 rpm, 20 min). 1 M NaOH was added dropwise to the supernatant to adjust to pH 7.2. The supernatant (5 × 10⁻³ M TC in milk sample) was prepared and serially diluted with treated milk sample (1 : 19 dilution, milk : phosphate buffer) in concentration ranging from 2 × 10⁻³ M to 2 × 10⁻¹² M.
2.7. Recoveries of TC from Spiked Milk Samples
Free TC (9.60 mg L−1, 2.40 mg L−1, 0.48 mg L−1, 0.25 mg L−1, 0.10 mg L−1, and 0.05 mg L−1) was spiked in milk, in ten replicate samples.
3. Results and Discussion
The TC aptamer assay was performed by using two different aptamers individually; one is 76 mer-DNA aptamer and the other is 57 mer-RNA aptamer. The both aptamers has been known to have high affinities with a dissociation constant (K d) of 63 nM for DNA aptamer (76 mer) and 770 pM for RNA aptamer (57 mer). A competitive assay with sequential mode was adapted for both aptamer assays.
3.1. DNA Aptamer (76 Mer) Assay
The assay sensitivity for competitive assays depends on both the immobilized aptamer concentration on the solid surface and the limited concentration of the competitor, TC-HRP conjugate. Thus, the concentrations of aptamer (0.0250 μg mL−1, 0.0188 μg mL−1, and 0.0125 μg mL−1) and the competitor, TC-HRP conjugate (1 μg mL−1 and 0.5 μg mL−1), are controlled to optimize the assay performance. Figure 2(a) shows the binder dilution curve obtained by a matrix combination of both chosen reagents. The best detection limit was observed using a combination of 0.0188 μg mL−1 of aptamer and 1 μg mL−1 of TC-HRP. When 0.5 μg mL−1 of the competitor, TC-HRP conjugate, was used with the same concentration of aptamer, the signal difference between the high and low doses of TC was too small (less than 0.1 Abs.) to be useful. This is shown in dotted line.
Figure 2.
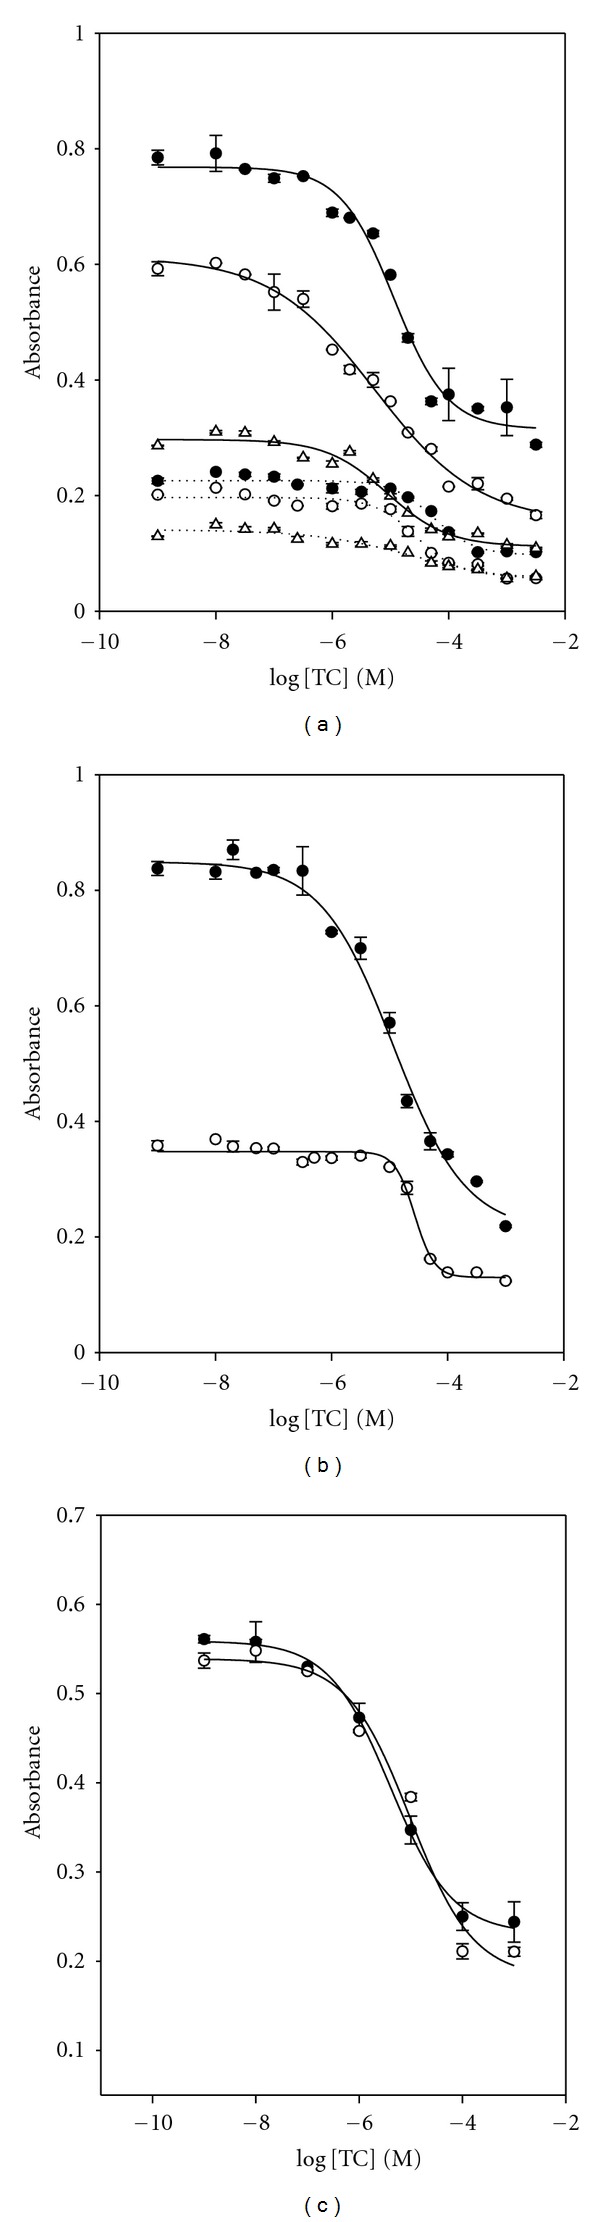
Optimization of TC assay conditions. (a) The concentration of DNA aptamer was (•) 0.0250 μg mL−1, (∘) 0.0188 μg mL−1, and (∆) 0.0125 μg mL−1 and the concentration of TC-HRP conjugate was 1 μg mL−1 in a solid line and 0.5 μg mL−1 in a dotted line. (b) Effect of incubation temperature on ELAA performance: (•) room temperature and (∘) 4°C. (c) Influence of thermal denaturation of DNA aptamer: (•) 95°C, 10 min and (∘) no treatment.
The effect of incubation temperature in the TC aptamer assay was examined by incubating aptamer at 4°C or at RT for 1 h each. As shown in Figure 2(b), the assay at 4°C shows the worse assay sensitivity with a small signal difference compared to that at RT. This result is different from the one obtained from dopamine RNA aptamer assay [9], in which the tertiary structure of DA aptamer is stable at lower temperature. Hereafter, experiments were performed at RT.
Additionally, an assay optimization was performed with the aptamer solution with and without a thermal treatment before its immobilization (Figure 2(c)). A thermal treatment of this biotinylated aptamer before the immobilization is applied to unfold the aptamer strand and also make the biotin label available for interaction with neutravidin on the solid support, plates. Thermal treatment involved the incubation of the aptamer solution at 90°C for 10 min, followed by rapid cooling in ice for 10 min to block the aptamer in its unfolded structure. The results were compared in terms of the TC binding. As shown in Figure 2(c), the aptamer denaturation did not show any improvement of the assay efficiency. This suggests that the TC aptamer holds the same folding structures even after the denaturation.
Figure 3 shows the dose-response curve constructed with the optimized conditions using 0.0188 μg mL−1 (7.5 × 10⁻¹⁰ M) of aptamer and 1.0 μg mL−1 (1.5 × 10⁻⁸ M) of TC-HRP conjugate in assay buffer. The LOD of 3.27 × 10⁻⁸ M (15.7 μg mL−1) and the dynamic range of from 1.00 × 10⁻⁴ M to 1.99 × 10⁻⁷ M were obtained. The LOD is defined as the concentration corresponding to 3 standard deviations below the mean from the blank. The average relative standard deviation (R.S.D.) across all data points of the curve was 1.6%. The calibration curve (inset) was constructed on a dynamic range, and least-squares regression [25] of these data gave the following relationship:
Figure 3.
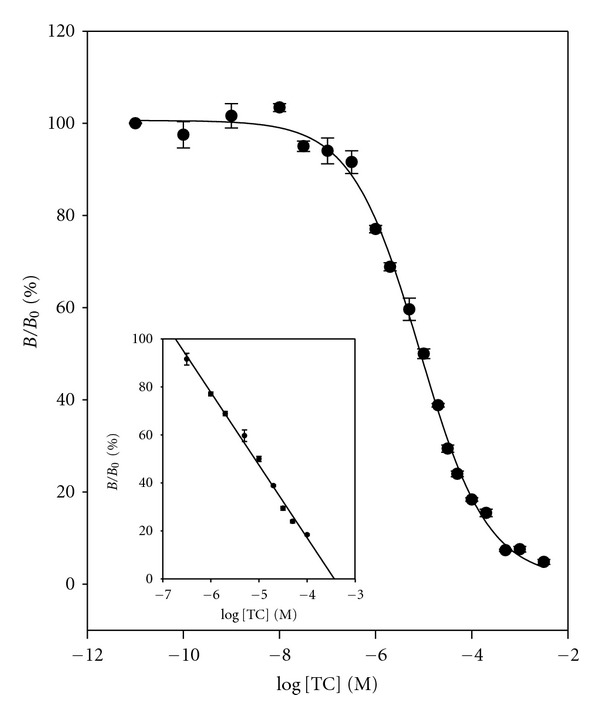
Dose-response curve and calibration curve (inset) for TC in buffer. % B/B 0 = − 30.3121 × log [TC] − 104.0775, R 2 = 0.9934. Data points are the average plus ± one standard deviation (n = 3).
| (1) |
In an aptamer assay, the ability of an aptamer to yield a measurable response selectively for the target molecule is described as specificity [12]. The specificity of the aptamer was evaluated by cross-reactivity study using three structurally similar compounds, cross-reactants, such as OTC, CTC, and DC. Cross-reactivity studies were carried out by a competitive ELAA by adding various free cross-reactants at different concentrations to compete with competitor, TC-HRP, to bind with the aptamer coated on the surface. Their 50% B/B 0 values were estimated and then their percent cross-reactivity was calculated: % cross-reactivity = (concentration of TC giving 50% B/B 0)/(concentration of cross-reactant giving 50% B/B 0). B/B 0 is the ratio of response B, to the maximum response when no analyte is present B 0. The 50% B/B 0 value and cross-reactivity for each compound are given in Figure 4 and Table 1. These results demonstrated that OTC showed very high cross-reactivity (129.7%) and CTC and DC showed relatively high cross-reactivity with 32.4% and 17.5%, respectively. Table 1 lists the comparison of cross-reactivity, and TC DNA aptamer assay shows no superior specificity of the binder as compared to the TC antibody assay [21].
Figure 4.
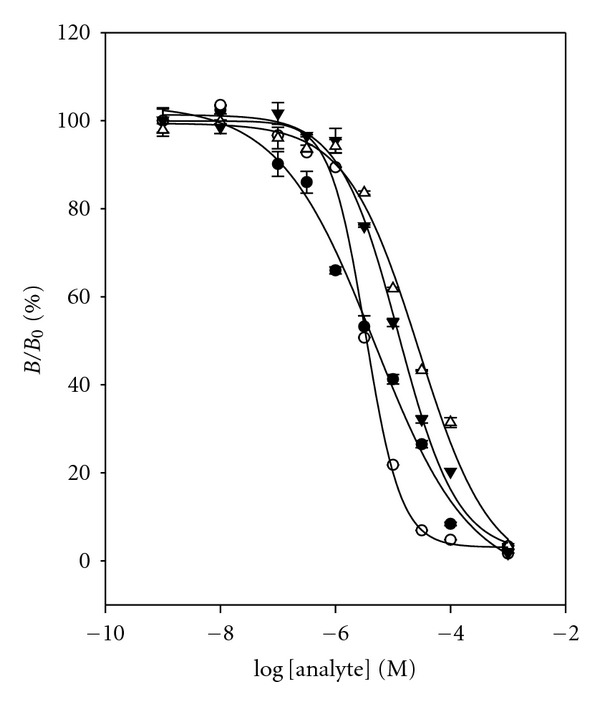
Cross-reactivity study with DNA aptamer for cross-reactants: (•) TC, (∘) OTC, (▾) CTC, and (▵) DC. Data points are means of triplicate measurements.
Table 1.
Cross-reactivity (%) of cross-reactants.
| Reactants | Cross-reactivity (%) | ||
|---|---|---|---|
| DNA aptamer | RNA aptamer | Antibody [21] | |
| Tetracycline (TC) | 100 | 100 | 100 |
| Oxytetracycline (OTC) | 129.7 | 35.3 | 10 |
| Chlortetracycline (CTC) | 32.4 | 35.3 | 13.7 |
| Doxycycline (DC) | 17.5 | 30.4 | — |
Milk samples were obtained from local markets and stored in refrigerator before use. The protein and fat in milk sample have an inclination for forming chelating complexes with divalent ions, and they cause a matrix effect. To remove these interferences, the milk sample was treated with McIlvaine-EDTA buffer to block any interaction with TC and divalent cations. And then 20% trichloroacetic acid was used for denaturation of milk protein. The dose-response curve was performed using 0.0188 μg mL−1 (7.5 × 10⁻¹⁰ M) of aptamer and 1.0 μg mL−1 (1.5 × 10⁻⁸ M) of TC-HRP conjugate. Figure 5(a) shows the dose-response curve and calibration curve for TC in milk. The LOD and the dynamic range were 9.52 × 10⁻⁸ M (45.7 μg mL−1) and from 3.16 × 10⁻⁴ M to 3.16 × 10⁻⁷ M, respectively:
Figure 5.
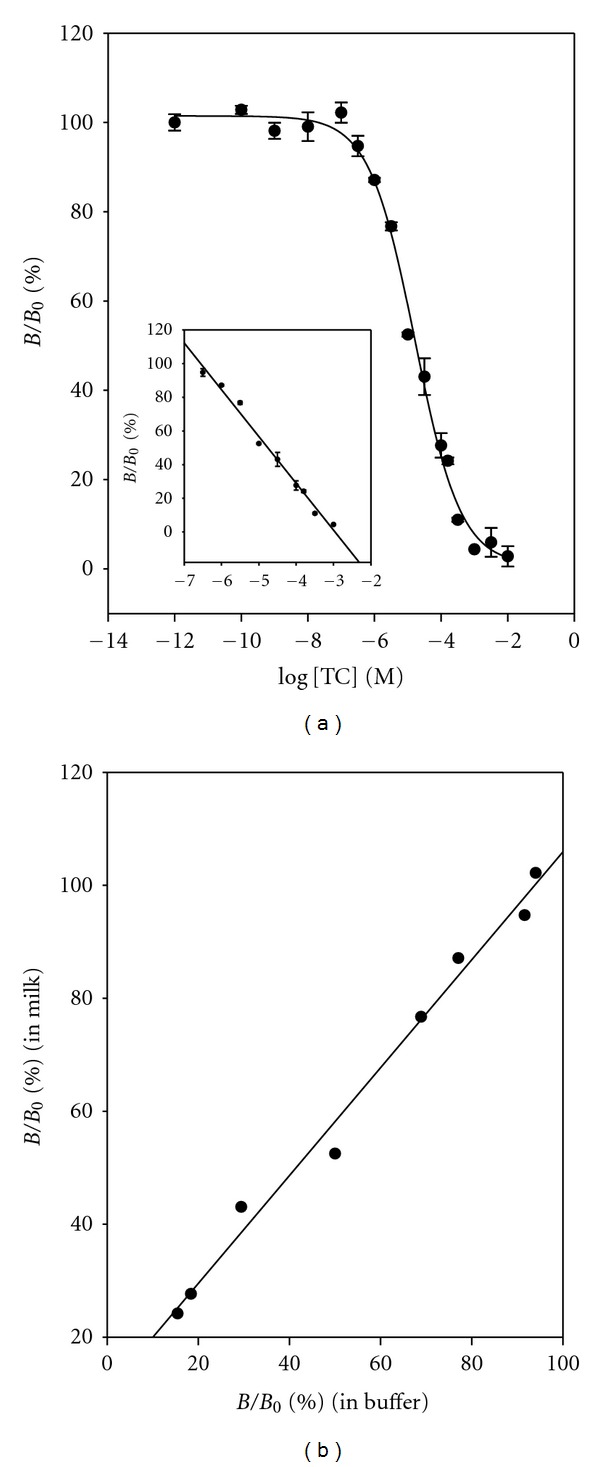
(a) Dose-response curve and calibration curve (inset) for TC in milk. % B/B 0 = − 27.7749 × log [TC] − 82.1902, R 2 = 0.9881. (b) Correlation diagram of B/B 0 for TC both in buffer and in milk. % B/B 0 (in milk) = 0.9550 × % B/B 0 (in buffer) − 10.4243, R 2 = 0.9881.
| (2) |
Figure 5(b) shows the correlation diagram of the absorbance obtained both in buffer and in milk:
| (3) |
3.2. RNA Aptamer (57 Mer) Assay
Monovalent cations such as Li+, Na+, and K+ and divalent ion, Mg2+, have been used in aptamer assays to stabilize the conformation of aptamer. In the case of thrombin aptasensor studies, it is mentioned that an addition of Na+ or K+ can stabilize G-quadruplex structure and reduce nonspecific binding. On the other side, these monovalent ions can cause the conformational changes of aptamer binding site and produce a lower affinity to its target.
In order to study whether monovalent and divalent cations affect the TC/RNA aptamer binding sensitivity, the assay buffer with and without monovalent and divalent cations were tried and the results compared. Figure 6(a) shows the influence of the addition of Na+ ion in assay buffer. As shown in Figure 6(a), the maximum signal absorbance obtained with 10 mM phosphate buffer was compared with that obtained with 10 mM phosphate buffered saline, PBS buffer. In the case of absence of Na+ ion in the buffer solution, the dose-response curve showed that the signal gap was sufficiently large to detect the concentration of TC distinctly and with a lower detection limit than the one with Na+ cation. Figure 6(b) shows the influence of the addition of Mg2+ ion in the assay buffer. Three different concentrations of Mg2+ ion were examined (0.0 mM, 2.5 mM, and 5.0 mM). As shown in Figure 6(b), the higher concentration of Mg2+ ion was used, the lower the signal gap was obtained. Several reports using UV-Vis spectroscopy [22] suggested that Mg2+ ion essentially binds to TC. This means that the TC forms the coordination complex with Mg2+ ion. Thus, Mg2+ ion can interfere with the binding reaction between TC and RNA aptamer. Incubation temperature was also studied for ELAA performance (RT and 4°C), and it showed no significant difference on both assay temperatures (Figure 6(c)).
Figure 6.
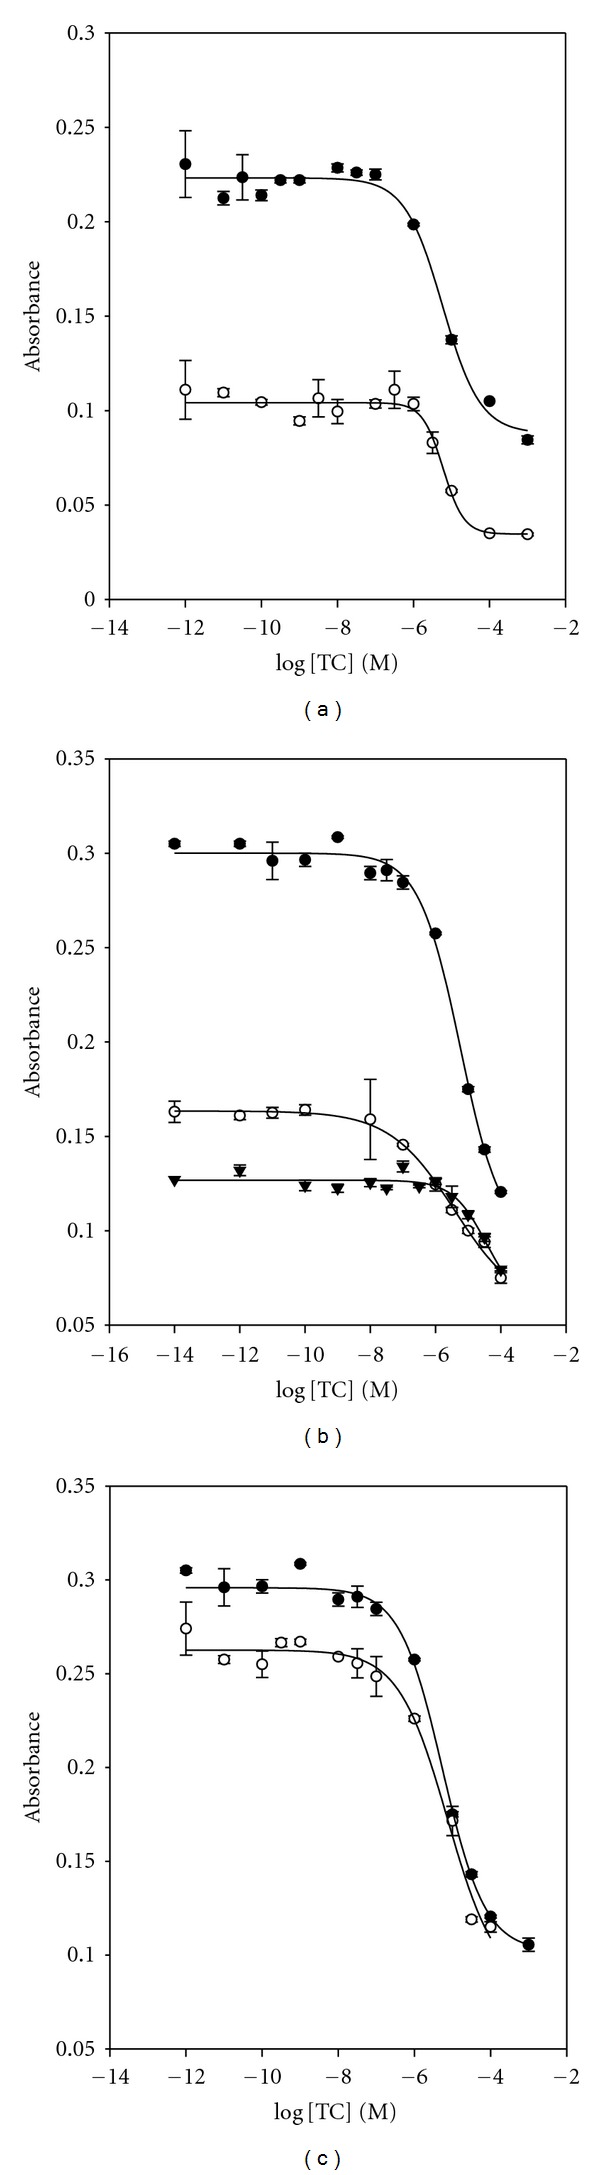
Optimization of assay conditions with RNA aptamer. (a) Influence of the addition of Na+ ion on assay buffer; (•) 10 mM phosphate buffer and (∘) PBS buffer (150 mM NaCl). (b) Effect of the addition of Mg2+ ion on assay buffer. The concentration of MgCl2 was (•) no addition, (∘) 2.5 mM, and (▾) 5 mM. (c) Optimization of temperature on the ELAA performance: (•) room temperature and (∘) 4°C.
The concentration of RNA aptamer was optimized for the assay. Figure 7 shows the binder dilution curve obtained with four different RNA aptamer concentrations (0.1 μg mL−1, 0.07 μg mL−1, 0.05 μg mL−1, and 0.02 μg mL−1) and the concentration of TC-HRP conjugate (1.0 μg mL−1). As shown in Figure 7, the best detection limit and signal gap were obtained using a combination of 0.07 μg mL−1 of aptamer and 1.0 μg mL−1 of TC-HRP.
Figure 7.
Optimization of the concentration of RNA aptamer: (•) 0.1 μg mL−1, (∘) 0.07 μg mL−1, (▾) 0.05 μg mL−1, and (▵) 0.02 μg mL−1 with the concentration of TC-HRP conjugate, 1 μg mL−1.
Figure 8 shows the dose-response curve constructed with the optimized conditions using 0.07 μg mL−1 (3.7 × 10⁻⁹ M) of RNA aptamer and 1.0 μg mL−1 (1.5 × 10⁻⁸ M) of TC-HRP conjugate in the assay buffer. The LOD of 2.10 × 10⁻⁸ M (10.1 μg mL−1) and the dynamic range of from 3.16 × 10⁻⁴ M to 3.16 × 10⁻⁸ M were obtained. The calibration curve (inset) was constructed on a dynamic range, and these data gave the following relationship:
Figure 8.
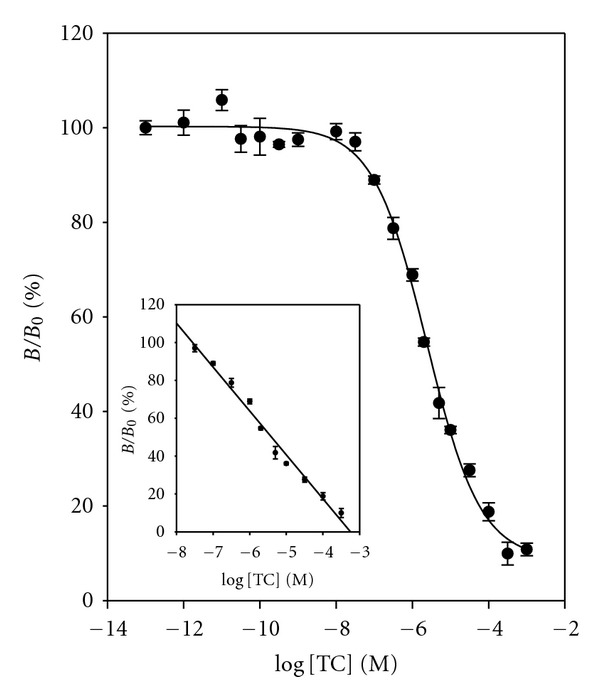
Dose-response curve and calibration curve (inset) for TC in buffer. % B/B 0 = − 23.1788 × log [TC] − 75.2471, R 2 = 0.9851. Data points are the average plus ± one standard deviation (n = 3).
| (4) |
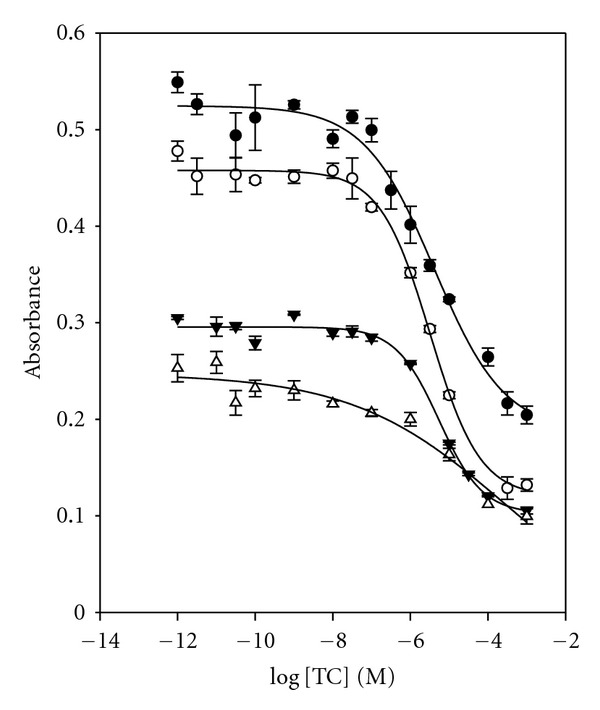
The specificity of the RNA aptamer was evaluated by cross-reactivity study. Cross-reactivity studies were carried out by a same method as previous DNA aptamer assay. The 50% B/B 0 value and cross-reactivity for each compound are given in Figure 9 and Table 1. These three cross-reactants demonstrated similar cross-reactivity (35.3%, 35.3%, and 30.4%) with relatively high value. It supports that the binding of TC to RNA aptamer is by hydrophobic or stacking interaction of the flat polycyclic aromatic ring in TC. Thus, RNA aptamer gives low specificity of the binder as compared to the TC antibody assay [21].
Figure 9.
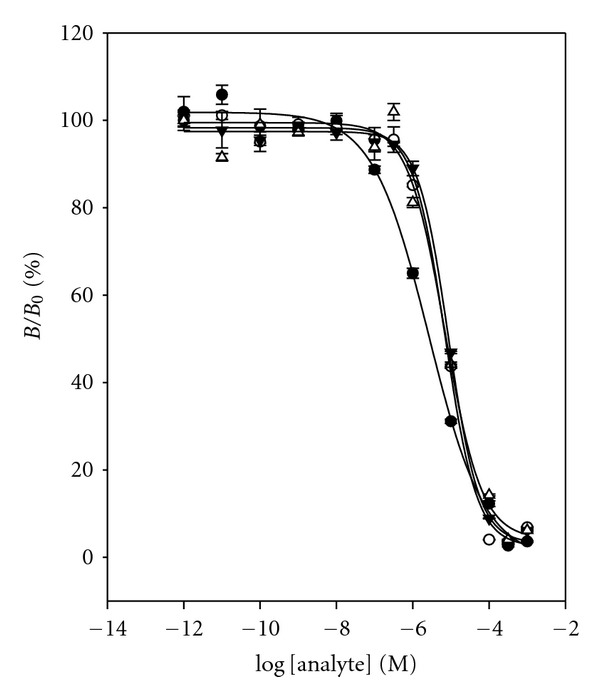
Cross-reactivity study with RNA aptamer for cross-reactants: (•) TC, (∘) OTC, (▾) CTC, and (▵) DC. Data points are means of triplicate measurements.
Figure 10(a) shows the dose-response curve and calibration curve for TC in milk. The LOD and the dynamic range were 3.51 × 10⁻⁸ M (16.8 μg mL−1) and from 1.00 × 10⁻⁴ M to 1.00 × 10⁻⁷ M, respectively:
Figure 10.
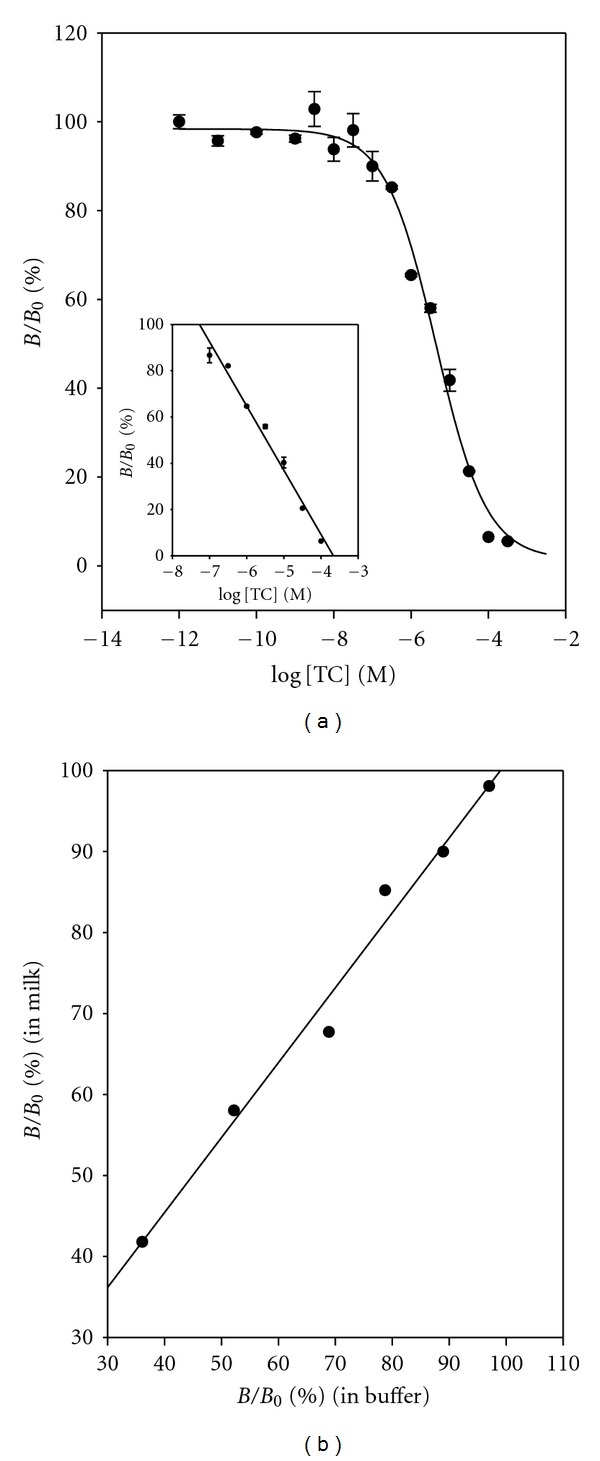
(a) Dose-response curve and calibration curve (inset) for TC in milk. % B/B 0 = −27.7674 × log [TC] − 101.8244, R 2 = 0.9823. (b) Correlation diagram of B/B 0 for TC both in buffer and in milk. % B/B 0 (in milk) = 0.9252 × % B/B 0 (in buffer) + 8.4232, R 2 = 0.9837.
| (5) |
Figure 10(b) shows the correlation diagram of the absorbance obtained both in buffer and in milk:
| (6) |
The recovery study was performed using commercial milk purchased from local market against DNA aptamer and RNA aptamer, respectively. Free TC was spiked in milk sample, and mean percent recoveries were analyzed. The recovery study was performed in ten replicates, and the results were quite satisfactory as seen in Table 2.
Table 2.
Recovery study for the determination of TC spiked in milk.
| Spiked conc. of TC (mg L−1) | Measured conc. (mg L−1) | Recovery (%) | |
|---|---|---|---|
| DNA aptamer | 9.60 | 9.119 | 95.0 |
| 2.40 | 2.390 | 99.6 | |
| 0.48 | 0.463 | 96.5 | |
|
| |||
| RNA aptamer | 0.25 | 0.246 | 105.9 |
| 0.10 | 0.104 | 104.7 | |
| 0.05 | 0.545 | 109.1 | |
4. Conclusion
A competitive ELAA method to detect TC in milk was developed. The optimization of assay buffer including aptamer affects the sensitivity of the aptamer for the TC. Best results were obtained without monovalent ion, Na+, and also by adding no Mg2+ ion in the assay buffer, along with RT incubation. In the case of both monovalent and divalent ions, increased ionic strength resulted in a decreased sensitivity of the aptamer to TC. This may be explained with shielding effect of Na+ ion causing the conformational changes of the aptamer binding site, therefore producing a lower affinity to its target, TC. Additionally, aptamer recognizes the Mg2+ ions that essentially coordinate TC.
The optimized ELAA method showed a good sensitivity (LOD of 2.10 × 10⁻⁸ M) with a wide dynamic range (3.16 × 10⁻⁸ M~3.16 × 10⁻⁴ M). In addition, the average R.S.D. across all data points of the curve was less than 2.5% with good recoveries (~101.8%) from the milk media. Thus, this method provides a good tool to monitor TC in milk from MRLs' point of view. As shown in Tables 1 and 3, the analytical data from this ELAA method is compared with those reported previously by ELISA method [21, 22]. However, this ELAA method (DNA or RNA aptamer) was not superior to the ELISA method (antibody as a binder) in terms of specificity, detection limit (LOD), and dynamic range. It demonstrated that the affinity and specificity of these aptamer assays were not advantageous compared to the previous immunoassay that uses antibodies. This means that it does not always give better sensitivity and specificity in assays even though aptamers have several advantages over antibodies and have been known to be good binders for binding assays. This study is the first report that uses validated ELAA for the determination of TC in milk.
Table 3.
Analytical data for TC aptamer assay (ELAA) compared with TC antibody assay (ELISA).
| Method | Matrix | LOD | Dynamic range | Linearity, R 2 |
|---|---|---|---|---|
| ELAA (DNA) | Buffer | 3.27 × 10⁻⁸ M | 1.99 × 10⁻⁷ M~1.00 × 10⁻⁴ M | 0.9934 |
| Milk | 9.52 × 10⁻⁸ M | 3.16 × 10⁻⁷ M~3.16 × 10⁻⁴ M | 0.9881 | |
|
| ||||
| ELAA (RNA) | Buffer | 2.10 × 10⁻⁸ M | 3.16 × 10⁻⁸ M~3.16 × 10⁻⁴ M | 0.9850 |
| Milk | 3.51 × 10⁻⁸ M | 1.0 × 10⁻⁷ M~1.0 × 10⁻⁴ M | 0.9823 | |
|
| ||||
| ELISA | Buffer [21] | 1.74 × 10⁻¹⁰ M | 1.0 × 10⁻⁹ M~1.0 × 10⁻⁶ M | 0.9901 |
| Milk [21] | 1.0 × 10⁻¹⁰ M | 3.16 × 10⁻¹⁰ M~3.16 × 10⁻⁷ M | 0.9862 | |
| Honey [22] | 3.98 × 10⁻¹⁰ M | 3.16 × 10⁻⁹ M~3.16 × 10⁻⁷ M | 0.9800 | |
Acknowledgment
This research was supported by Basic Science Research Program through the National Research Foundation of Korea (NRF) funded by the Ministry of Education, Science and Technology (2010–0022075).
References
- 1.Klussmann S. The Aptamer Handbook. New York, NY, USA: John Wiley & Sons; 2007. [Google Scholar]
- 2.Tuerk C, Gold L. Systemic evolution of ligands by exponential enrichment: RNA ligands to bacteriophage T4 DNA polymerase. Science. 1990;249(4968):505–510. doi: 10.1126/science.2200121. [DOI] [PubMed] [Google Scholar]
- 3.Ellington AD, Szostak JW. In vitro selection of RNA molecules that bind specific ligands. Nature. 1990;346(6287):818–822. doi: 10.1038/346818a0. [DOI] [PubMed] [Google Scholar]
- 4.Zheng J, Cheng GF, He PG, Fang YZ. An aptamer-based assay for thrombin via structure switch based on gold nanoparticles and magnetic nanoparticles. Talanta. 2010;80(5):1868–1872. doi: 10.1016/j.talanta.2009.10.036. [DOI] [PubMed] [Google Scholar]
- 5.Wu Z-S, Lu H, Liu X, et al. Inhibitory effect of target binding on hairpin aptamer sticky-end pairing-induced gold nanoparticle assembly for light-up colorimetric protein assay. Analytical Chemistry. 2010;82(9):3890–3898. doi: 10.1021/ac100422h. [DOI] [PubMed] [Google Scholar]
- 6.Edwards KA, Wang Y, Baeumner AJ. Aptamer sandwich assays: human α-thrombin detection using liposome enhancement. Analytical and Bioanalytical Chemistry. 2010;398(6):2645–2654. doi: 10.1007/s00216-010-3920-4. [DOI] [PubMed] [Google Scholar]
- 7.Surugiu-Wärnmark I, Wärnmark A, Toresson G, Gustafsson JÅ, Bülow L. Selection of DNA aptamers against rat liver X receptors. Biochemical and Biophysical Research Communications. 2005;332(2):512–517. doi: 10.1016/j.bbrc.2005.04.147. [DOI] [PubMed] [Google Scholar]
- 8.Shimada J, Maruyama T, Kitaoka M, Kamiya N, Goto M. DNA-enzyme conjugate with a weak inhibitor that can specifically detect thrombin in a homogeneous medium. Analytical Biochemistry. 2011;414(1):103–108. doi: 10.1016/j.ab.2011.02.035. [DOI] [PubMed] [Google Scholar]
- 9.Park H, Paeng IR. Development of direct competitive enzyme-linked aptamer assay for determination of dopamine in serum. Analytica Chimica Acta. 2011;685(1):65–73. doi: 10.1016/j.aca.2010.11.010. [DOI] [PubMed] [Google Scholar]
- 10.Xu H, Mao X, Zeng Q, Wang S, Kawde AN, Liu G. Aptamer-functionalized gold nanoparticles as probes in a dry-reagent strip biosensor for protein analysis. Analytical Chemistry. 2009;81(2):669–675. doi: 10.1021/ac8020592. [DOI] [PubMed] [Google Scholar]
- 11.Wilson DS, Keefe AD, Szostak JW. The use of mRNA display to select high-affinity protein-binding peptides. Proceedings of the National Academy of Sciences of the United States of America. 2001;98(7):3750–3755. doi: 10.1073/pnas.061028198. [DOI] [PMC free article] [PubMed] [Google Scholar]
- 12.Niazi JH, Lee SJ, Gu MB. Single-stranded DNA aptamers specific for antibiotics tetracyclines. Bioorganic and Medicinal Chemistry. 2008;16(15):7245–7253. doi: 10.1016/j.bmc.2008.06.033. [DOI] [PubMed] [Google Scholar]
- 13.Cherlet M, Schelkens M, Croubels S, De Backer P. Quantitative multi-residue analysis of tetracyclines and their 4-epimers in pig tissues by high-performance liquid chromatography combined with positive-ion electrospray ionization mass spectrometry. Analytica Chimica Acta. 2003;492(1-2):199–213. [Google Scholar]
- 14.Cinquina AL, Longo F, Anastasi G, Giannetti L, Cozzani R. Validation of a high-performance liquid chromatography method for the determination of oxytetracycline, tetracycline, chlortetracycline and doxycycline in bovine milk and muscle. Journal of Chromatography A. 2003;987(1-2):227–233. doi: 10.1016/s0021-9673(02)01446-2. [DOI] [PubMed] [Google Scholar]
- 15.Koesukwiwat U, Jayanta S, Leepipatpiboon N. Solid-phase extraction for multiresidue determination of sulfonamides, tetracyclines, and pyrimethamine in Bovine’s milk. Journal of Chromatography A. 2007;1149(1):102–111. doi: 10.1016/j.chroma.2007.02.075. [DOI] [PubMed] [Google Scholar]
- 16.Furusawa N. Isolation of tetracyclines in milk using a solid-phase extracting column and water eluent. Talanta. 2003;59(1):155–159. doi: 10.1016/s0039-9140(02)00472-1. [DOI] [PubMed] [Google Scholar]
- 17.Schneider MJ, Darwish AM, Freeman DW. Simultaneous multiresidue determination of tetracyclines and fluoroquinolones in catfish muscle using high performance liquid chromatography with fluorescence detection. Analytica Chimica Acta. 2007;586(1-2):269–274. doi: 10.1016/j.aca.2006.09.025. [DOI] [PubMed] [Google Scholar]
- 18.Oka H, Ito Y, Matsumoto H. Chromatographic analysis of tetracycline antibiotics in foods. Journal of Chromatography A. 2000;882(1-2):109–133. doi: 10.1016/s0021-9673(99)01316-3. [DOI] [PubMed] [Google Scholar]
- 19.Fritz JW, Zuo Y. Simultaneous determination of tetracycline, oxytetracycline, and 4-epitetracycline in milk by high-performance liquid chromatography. Food Chemistry. 2007;105(3):1297–1301. [Google Scholar]
- 20.Blasco C, Corcia AD, Picó Y. Determination of tetracyclines in multi-specie animal tissues by pressurized liquid extraction and liquid chromatography-tandem mass spectrometry. Food Chemistry. 2009;116(4):1005–1012. [Google Scholar]
- 21.Jeon M, Kim J, Paeng KJ, Park SW, Paeng IR. Biotin-avidin mediated competitive enzyme-linked immunosorbent assay to detect residues of tetracyclines in milk. Microchemical Journal. 2008;88(1):26–31. [Google Scholar]
- 22.Jeon M, Rhee Paeng I. Quantitative detection of tetracycline residues in honey by a simple sensitive immunoassay. Analytica Chimica Acta. 2008;626(2):180–185. doi: 10.1016/j.aca.2008.08.003. [DOI] [PubMed] [Google Scholar]
- 23.Pastor-Navarro N, Morais S, Maquieira Á, Puchades R. Synthesis of haptens and development of a sensitive immunoassay for tetracycline residues. Application to honey samples. Analytica Chimica Acta. 2007;594(2):211–218. doi: 10.1016/j.aca.2007.05.045. [DOI] [PubMed] [Google Scholar]
- 24.Wang J, Munir A, Li Z, Zhou HS. Aptamer-Au NPs conjugates-enhanced SPR sensing for the ultrasensitive sandwich immunoassay. Biosensors and Bioelectronics. 2009;25(1):124–129. doi: 10.1016/j.bios.2009.06.016. [DOI] [PubMed] [Google Scholar]
- 25.Huang DW, Niu CG, Qin PZ, Ruan M, Zeng GM. Time-resolved fluorescence aptamer-based sandwich assay for thrombin detection. Talanta. 2010;83(1):185–189. doi: 10.1016/j.talanta.2010.09.004. [DOI] [PubMed] [Google Scholar]
- 26.Ferreira CSM, Papamichael K, Guilbault G, Schwarzacher T, Gariepy J, Missailidis S. DNA aptamers against the MUC1 tumour marker: design of aptamer-antibody sandwich ELISA for the early diagnosis of epithelial tumours. Analytical and Bioanalytical Chemistry. 2008;390(4):1039–1050. doi: 10.1007/s00216-007-1470-1. [DOI] [PubMed] [Google Scholar]
- 27.Pultar J, Sauer U, Domnanich P, Preininger C. Aptamer-antibody on-chip sandwich immunoassay for detection of CRP in spiked serum. Biosensors and Bioelectronics. 2009;24(5):1456–1461. doi: 10.1016/j.bios.2008.08.052. [DOI] [PubMed] [Google Scholar]
- 28.Müller M, Weigand JE, Weichenrieder O, Suess B. Thermodynamic characterization of an engineered tetracycline-binding riboswitch. Nucleic Acids Research. 2006;34(9):2607–2617. doi: 10.1093/nar/gkl347. [DOI] [PMC free article] [PubMed] [Google Scholar]
- 29.Kim YJ, Kim YS, Niazi JH, Gu MB. Electrochemical aptasensor for tetracycline detection. Bioprocess and Biosystems Engineering. 2010;33(1):31–37. doi: 10.1007/s00449-009-0371-4. [DOI] [PubMed] [Google Scholar]
- 30.Niazi JH, Lee SJ, Kim YS, Gu MB. ssDNA aptamers that selectively bind oxytetracycline. Bioorganic and Medicinal Chemistry. 2008;16(3):1254–1261. doi: 10.1016/j.bmc.2007.10.073. [DOI] [PubMed] [Google Scholar]
- 31.Berens C, Thain A, Schroeder R. A tetracycline-binding RNA aptamer. Bioorganic and Medicinal Chemistry. 2001;9(10):2549–2556. doi: 10.1016/s0968-0896(01)00063-3. [DOI] [PubMed] [Google Scholar]
- 32.Hanson S, Bauer G, Fink B, Suess B. Molecular analysis of a synthetic tetracycline-binding riboswitch. RNA. 2005;11(4):503–511. doi: 10.1261/rna.7251305. [DOI] [PMC free article] [PubMed] [Google Scholar]
- 33.Xiao H, Edwards TE, Ferré-D’Amaré AR. Structural basis for specific, high-affinity tetracycline binding by an in vitro evolved aptamer and artificial riboswitch. Chemistry and Biology. 2008;15(10):1125–1137. doi: 10.1016/j.chembiol.2008.09.004. [DOI] [PMC free article] [PubMed] [Google Scholar]
- 34.Hianik T, Ostatná V, Sonlajtnerova M, Grman I. Influence of ionic strength, pH and aptamer configuration for binding affinity to thrombin. Bioelectrochemistry. 2007;70(1):127–133. doi: 10.1016/j.bioelechem.2006.03.012. [DOI] [PubMed] [Google Scholar]
- 35.Tang Q, Su X, Loh KP. Surface plasmon resonance spectroscopy study of interfacial binding of thrombin to antithrombin DNA aptamers. Journal of Colloid and Interface Science. 2007;315(1):99–106. doi: 10.1016/j.jcis.2007.06.040. [DOI] [PubMed] [Google Scholar]