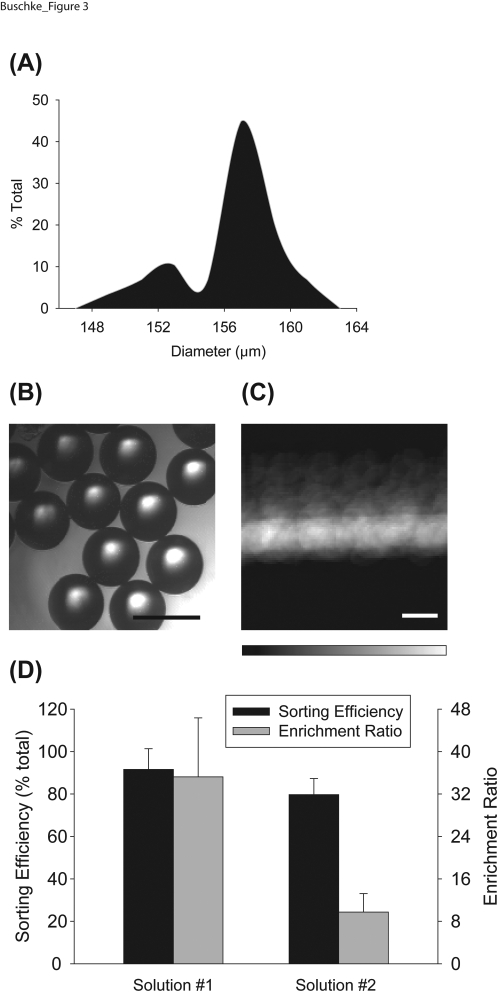
Figure 3.
Sorting efficiency and enrichment ratio of polystyrene beads. (a) Histogram depicting the distribution of bead diameters in a representative fraction of fluorescent and non-fluorescent polystyrene beads. Measured bead diameter (157 ± 3 μm) did not differ statistically from manufacturer’s specifications (158 ± 3 μm). (b) Brightfield image of polystyrene beads. Scale bar = 200 μm. (c) Summation of temporal image series of beads flowing through the LaPSD. Fluorescence intensity images of beads were taken every 0.2 s and ∼3000 images were merged to create the image shown. The minimal deviation of fluorescence intensity from the center sample stream line conveys the ability of the LaPSD to effectively focus particles with uniform size. Scale bar = 200 μm. (d) Sorting efficiency and enrichment ratio of bead populations consisting of fluorescent and nonfluorescent beads. Solution 1 attained significantly higher enrichment ratios due to a low starting concentration of fluorescent beads; this result demonstrates the ability of the LaPSD to effectively purify particles from relatively dilute starting concentrations akin to rare cell populations. Error bars correspond to standard deviation from the mean.

