Figure 4.
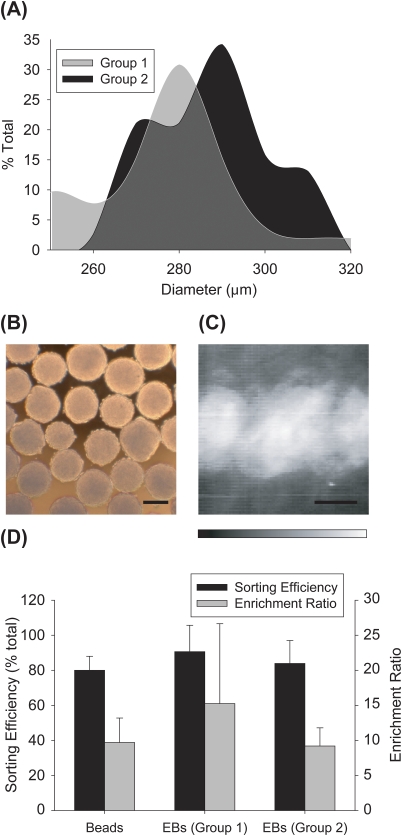
Sorting efficiency and enrichment ratio of embryoid bodies. (a) Histograms depicting measured EB diameters for two separate groups of EBs. Measured mean EB diameters were 247 ± 20 μm for group 1, and 295 ± 12 μm for group 2. (b) Brightfield images of EBs. Scale bar = 200 μm. (c) Summation of temporal image series of EBs flowing through the LaPSD. Fluorescence intensity images of EBs were taken every 0.2 s and ∼2000 images were merged to create the image shown. The deviation of fluorescence intensity from the center sample stream line is more diffuse than that observed for beads reflecting the higher variability of size of EBs and therefore greater perturbation of flow. Scale bar = 200 μm. (d) Sorting efficiency and enrichment ratio of EB groups compared to that of bead solution 2. There was no significant difference between sorting efficiency or enrichment ratios when comparing beads to either group of EBs. Error bars correspond to standard deviation from the mean.

