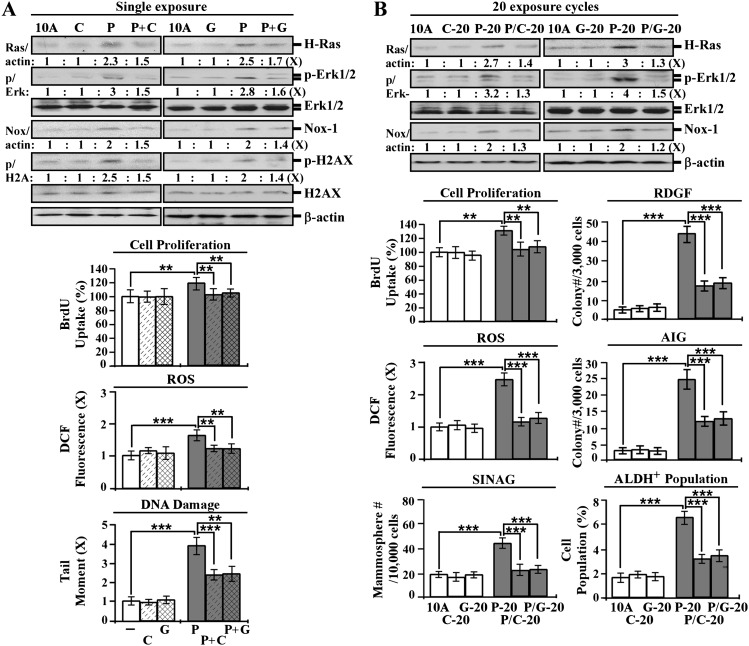
Fig. 5.
Intervention of PhIP-induced carcinogenesis by ECG and EGCG. (A) MCF10A (10A) cells were treated with 10 nmol/l PhIP (P) in the absence or presence of 10 μg/ml of ECG (C) and 5 μg/ml of EGCG (G) for 24 h. (B) 10A cultures were repeatedly exposed to 10 nmol/l PhIP in the absence and presence of 10 μg/ml of ECG and 5 μg/ml of EGCG for 20 cycles, resulting in P-20, C-20, G-20, P/C-20 and P/G-20 cell lines, respectively. Cell lysates were prepared and analyzed by western immunoblotting to detect levels of H-Ras, p-Erk1/2, Erk1/2, Nox-1, with β-actin as a control, and levels were quantified by densitometry. The levels of H-Ras and Nox-1 were calculated by normalizing with the level of β-actin, the level set in control 10A cells as 1 (X, arbitrary unit). The level of specific phosphorylation of Erk1/2 (p/Erk) was calculated by normalizing the level of p-Erk1/2 with the level of Erk1/2, the level set in 10A cells as 1 (X, arbitrary unit). Relative cell proliferation was determined and normalized by the value of 5-bromo-2′-deoxyuridine detected in 10A cells, set as 100%. Relative ROS levels were measured with chloromethyl dichlorodihydrofluorescein diacetate labeling and normalized by the fluorescence intensity determined in 10A cells, set as 1 (X, arbitrary unit). Relative DNA damage was measured by a comet assay and normalized by the value of average tail moment determined in 10A cells, set as 1 (X, arbitrary unit). To determine reduced dependence on growth factors (RDGF) and anchorage-independent growth (AIG), cells were maintained in low-mitogen medium for 10 days and seeded in soft agar for 14 days, respectively. Cell colonies (≥0.5 mm diameter) grown in low-mitogen medium and soft agar were counted. To determine serum-independent non-adherent growth (SINAG), cells were seeded in non-adherent cultures for 10 days, and mammospheres (≥0.1 mm diameter) were counted. Mammospheres were then collected and trypsinized, and ALDH-expressing (ALDH+) cell population (%) was measured by flow cytometry. Columns, mean of triplicates; bars, standard deviation. The Student’s t test was used to analyze statistical significance, indicated by **P < 0.01 and ***P < 0.001. All results are representative of three independent experiments.

