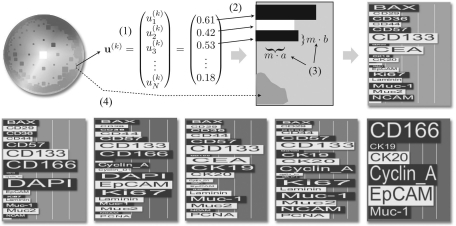
Fig. 1.
The CIPRA glyph: for each H2SOM node, the prototype coefficients uak are read (1) and for each protein a bar is plotted in alternating black/white (2). The length and width of one bar k is scaled so it is proportional to uak (3). The background color of the glyph is chosen depending on the grid coordinates of the prototype in relation to the HS color scale plate (4). In the bottom row five more examples for CIPRA glyphs are shown.

