

Abstract
Morphine is a widely abused, addictive drug that modulates immune function. Macrophages are a primary reservoir of HIV-1; therefore, they not only play a role in the development of this disease but also impact the overall course of disease progression. Galectin-1 is a member of a family of β-galactoside-binding lectins that are soluble adhesion molecules and that mediate direct cell-pathogen interactions during HIV-1 viral adhesion. Since the drug abuse epidemic and the HIV-1 epidemic are closely interrelated we propose that increased expression of galectin-1 induced by morphine may modulate HIV-1 infection of human monocytes-derived macrophages (MDM). Here, we show that galectin-1 gene and protein expression are potentiated by incubation with morphine. Confirming previous studies, morphine alone or galectin-1 alone enhance HIV-1 infection of MDM. Concomitant incubation with exogenous galectin-1 and morphine potentiated HIV-1 infection of MDM. We utilized a nanotechnology approach that uses gold nanorod-galectin-1 siRNA complexes (nanoplexes) to inhibit gene expression for galectin-1. We found that nanoplexes silenced gene expression for galectin-1 and the nanoplexes reversed the effects of morphine on galectin-1 expression. Furthermore, the effects of morphine on HIV-1 infection were reduced in the presence of the nanoplex.
Introduction
Substance abuse is a world-wide public health concern. Opiates are widely abused addictive drugs. The dual epidemics of addictive drug use and HIV-1 infection coincide with one another. Approximately 33.3 million people worldwide are living with HIV-1/AIDS, and 2.5 million people were estimated to contract HIV-1 in 2009 (1). Addictive drugs have been shown to enhance HIV-1 infection of immune cells including PBMC, dendritic cells and macrophage (2–5). HIV-1 infection is characterized by sustained activation of the immune system. Macrophages are one of the first lines of defense against pathogens. Macrophages are permissive to HIV-1 infection and contribute to viral persistence. Thus, these cells can serve as vehicles for dissemination and reservoirs of HIV-1 infection. (6–8). Therefore addictive drug use and its effects on macrophages impact the overall course of HIV-1 disease.
During the budding process, HIV-1 incorporates host-derived molecules including ICAM-1, HLA-DR1, and MHC II (10, 11) and may include galectins. Galectins are a family of β-galactoside binding lectins that modulate cell to cell and cell to matrix interactions, cell adhesion and cell signaling by cross linking of cell surface glycol conjugates (12, 13). Galectins are expressed in a wide range of tissues including muscle, heart, placenta, lymph nodes, bone marrow and liver. They are expressed in epithelial cells, endothelial cells, dendritic cells, macrophages and T and B cells (13). Galectins are located both extracellularly and intracellularly. Twelve different galectins exist (galectin 1–12) (14). Galectin-1 is a 14 kDa monomer that consists of 2 identical carbohydrate recognition domains. Receptors for galectin-1 include CD45, CD7, CD43, CD2, CD3, CD4, laminin, and integrins (15). Intracellular signaling by galectin-1 induces activation of mitogen activated protein kinases, phospolipase C, an increase in intracellular calcium influx, and activation of transcription factor AP-1 (13, 16, 17). Galectin-1 elicits a broad spectrum of biological function including cell proliferation, fetomaternal tolerance, apoptosis, cell cycle arrest, cell-matrix adhesion and cell-to-cell adhesion (13, 15–17). Regarding HIV-1 viral adhesion and infection, galectin-1 is a soluble adhesion molecule that mediates direct cell-pathogen interactions enhancing HIV-1 infection of T cells and macrophage (18–20). Our laboratory has shown that treatment of immature dendritic cells (IDC) with methamphetamine increases the expression of galectin-1 (21). The present study, using a nanotechnology method (22–27), was conducted to investigate the potential role of galectin-1 in morphine induced potentiation of HIV-1 infection of human monocyte derived macrophage (MDM).
Materials and Methods
Human Subjects
Blood donors were recruited at University at Buffalo; consents were obtained consistent with the policies of University at Buffalo Health Sciences Institutional Review Board (HSIRB) and the National Institutes of Health. Peripheral blood samples from HIV-1 negative individuals were drawn into a syringe containing heparin (20 units/ml, Sigma-Aldrich, St. Louis, MO).
Isolation of monocyte derived macrophages (MDM)
Human PBMC were separated by Ficoll-Paque (GE Health Care, Piscataway, NJ) gradient centrifugation. CD14+ cells were isolated from PBMC by direct positive isolation using Dynabeads CD14 (Invitrogen, Carlsbad, CA) according to the manufacturer’s instructions. CD14+ cells were cultured in complete medium [RPMI 1640, 10% fetal calf serum, 5% human AB serum, 10 mM/L HEPES, 1% Penicillin-Streptomycin, 10 ng/ml macrophage colony-stimulating factor (Millipore, Billerica, MA)] for 7 days for differentiation into MDM.
Drug Treatment
MDM from were treated with morphine sulfate (10−13-10−5 M) (Sigma-Aldrich) for 6, 12, 24 or 48 hr. The concentrations of morphine used were based on previous dose response studies that produced a maximum biological response without causing toxicity to the target cells in previous published in vitro studies (28, 29). For all experiments, cells treated with vehicle alone (media) were used as the untreated control.
RNA extraction and Real Time Quantitative PCR (Q-PCR)
MDMs (1×10⁵cells/ml) were cultured in 6 well plates, cytoplasmic RNA was extracted using TRIzol (Invitrogen) according to the manufacturer’s specifications. The final RNA pellet was dried and resuspended in diethyl pyrocarbonate water and the concentration of RNA was determined using a NanoDrop ND-1000 Spectrophotometer (NanoDrop Technologies, Wilmington DE). Any DNA contamination in the RNA preparation was removed by treating the RNA with DNAse (1 IU/μg of RNA, Promega, Madison WI) for 2 hr at 37°C, followed by proteinase K digestion at 37°C for 15 min and subsequent extraction with phenol/chloroform and NH4OAc/ETOH precipitation. The isolated RNA was stored at −70°C until used. Relative abundance of each mRNA species was assessed using the SYBR green master mix from Stratagene (La Jolla, CA) to perform Q-PCR. Differences in threshold cycle number were used to quantify the relative amount of PCR target contained within each tube. Relative mRNA species expression was quantitated and expressed as transcript accumulation index (TAI = 2−(δδCT)), calculated using the comparative CT method. All data were controlled for quantity of RNA input by performing measurements on an endogenous reference gene, β-actin (30, 31). All values were normalized to the constitutive expression of the housekeeping gene, β-actin (28, 29). Primers sequences used are shown in Table 1.
Table 1.
Primer sequences for real time Q-PCR
| β-actin | 5′, 5′-TGA CGG GGT CAC CCA CAC TGT GCC CAT CTA-3′ 3′, 5-AGT CAT AGT CCG CCTA GAA GCA TTT GCG GT-3′ |
| HIV-1 LTR RU/5 | 5′, 5′-TCT CTC TGG TTA GAC CAG ATC TG-3′ 3′, 5′-ACT GCT AGA GAT TTT CCA CAC TG-3′ |
| p24 | 5′, 5′-TGA AGC TTG CTC GGC TCT-3′ 3′, 5′-CAG GCC AGA TGA GAG AAC-3′ |
| Galectin-1 | 5′, 5′-CTC TCG GGT GGA GTC TTC TG-3′ 3′, 5-GAA GGC ACT CTC CAG GTT TG-3′ |
Western Blot
Briefly, 50 μg of protein was separated by electrophoresis using 4–20% Tris–Hepes NuSep Longlife gels (Bioexpress, Kaysville, UT) and transferred to polyvinylidene fluoride (PVDF) membranes (Sigma-Aldrich). Membranes were blocked for 1 hr with NAP-Blocker (G-Biosciences, Maryland Heights, MO) in Tris-buffered saline with Tween 20 [150 mM NaCl, 20 mM Tris, pH 7.5, 0.1% Tween 20, TBST] and then incubated with primary antibodies overnight at 4°C with gentle rocking. Primary antibodies used were anti-galectin-1 rabbit polyclonal antibody (cat# sc-28248, Santa Cruz Biotechnology, Santa Cruz, CA) and anti-β-actin rabbit polyclonal antibody (cat# sc-130656, Santa Cruz Biotechnology). After incubation with primary antibodies, membranes were washed and incubated with a biotin-conjugated secondary antibody (goat anti-rabbit IgG, cat# BAF017, R&D Systems, Minneapolis, MN). Membranes were washed 3 times, for 10 min each, in TBST and then incubated for another 30 min with a streptavidin-alkaline phosphatase conjugate (Invitrogen) followed by colorimetric detection using NBT/BCIP reagent (Thermo Scientific, Rockford, IL). Densitometry analyses were done using a Syngene Image Analyzer with Gene Tools Analysis Software version 3.02.00 (Syngene, Frederick, MD). Data were normalized to protein expression levels of β-actin.
Immunofluorescence
MDMs (1×10⁵cells/ml) cultured on Lab-Tek chambered coverglasses (Nalgene Nunc International, Rochester, NY) were fixed and permeabilized in cold 70% methanol for 30 min at 4°C. Cells were washed in PBS, incubated with Image-iT™ FX signal enhancer (Invitrogen) for 30 min at room temperature in a humid environment. Cells were washed in PBS then incubated with primary antibodies (anti-galectin-1, cat# sc-19276; isotype-matched control, cat# sc-2028; 1:50, Santa Cruz Biotechnology,) overnight at 4°C. Cells were washed with PBS and incubated for 1 hr at RT with a secondary antibodyconjugated to ALEXA Flour 647 (Alexa Fluor ® SFX Kits, Invitrogen). Cells were then counterstained with 4′,6-diamidino-2-phenylindole, dilactate (DAPI, Molecular Probes-Invitrogen). MDMs were imaged by confocal microscopy using a Leica Confocal Laser Scanning Microscope (TCS SP2 AOBS, Leica Microsystems Heidelberg GmbH) with an Oil Immersion objective lens 63X. HeNe633 nm laser was applied to excite Alexa Fluor-647; argon ion laser was applied to excite DAPI. Quantification of immunostaining was performed by densitometry using Image-J (1.37c software version of Image J (NIH, Bethesda, MD). Expression of galectin-1 was quantified by determining the positive area (index) as a percentage of the total image area per microscopy field (32, 33).
ELISA
Total galectin-1 concentrations were measured by ELISA (NovaTeinBio, Cambridge, MA). Assay range 0.01–1000 ng/ml for galectin-1. Absorbance values were read at 450 nm using a microtiter plate spectrophotometer, and the results are expressed in ng/ml.
Synthesis of gold nanorods (GNRs)
Gold seeds were synthesized by reducing gold salt in the presence of 99%, hexadecyltrimethylammonium bromide (CTAB) as a capping agent (22–27, 34). Briefly, 10 ml of 0.1 M CTAB solution was mixed with 200 μl of 25 mM HAuCl4. Then, 1 ml of ice-cold 0.01 M sodium borohydride (NaBH4) was quickly added, with vigorous stirring for 2 min. A light brown solution (seed solution) was formed, which was then kept in a water bath at 33°C for further use. The average size of these Au seeds was 3–5 nm. Meanwhile, to synthesize GNRs, 10 ml of 0.1 M CTAB was mixed with 200 μl of 25 mM HAuCl4 in a separate vial, in the presence of a small amount of Ag+ ion (8 × 10 −5M). Then, the moderate reductant, 100 μl of 0.1 M ascorbic acid, was added at room temperature, resulting in the formation of colorless solution. This mixture is the so-called growth solution. Finally, the growth solution was heated to 33°C in the water bath and 12 μl of seed solution was gently added to it. The rod formation was permitted undisturbed at 33°C for at least 3 hr. Then, to remove the excess CTAB from the prepared GNRs, the bilayer CTAB-coated GNRs were centrifuged at 9000 rpm for 15 min. GNRs were sequentially coated with two successive layers of polyelectrolytes, (a) the negatively charged poly(3,4-ethylenedioxythiophene)-poly(styrenesulfonate) (PEDT/PSS), and (b) the positively charged poly(diallyldimethylammoniumchloride) (PDDAC).
Formation of GNR-siRNA nanoplexes and MDM transfection
Cationic GNRs were electrostatically attached to galectin-1 siRNA (Ambion), resulting in the formation of nanoplexes. Galectin-1 siRNAFAM (FAM = 6-carboxyfluorescein, fluorophore label), or scrambled control was reconstituted in DNase–RNase free water to a final concentration of 0.1 μM and mixed with GNR solution, incubated at room temperature for 15 min and used for in vitro transfection at a final concentration of 200 pmol of siRNA/per 30 μl (galectin-1 siRNA/GNR = Nanoplexes). 1×10⁵ cells/ml were seeded onto six-well plates in OPTI-MEM containing 4% FBS with no antibiotics. Twenty four hr later, nanoplexes were added to cells and transgene expression was monitored at 24–72 hr post transfection. Protein expression was analyzed 24, 48 and 72 hr post-transfection.
Dark-field microscopy imaging
The cellular uptake of the nanoparticle conjugated with galectin-1 siRNAFAM (nanoplex) was visualized using Dark-Field microscopy 24 hr post-transfection. The light-scattering images were recorded using an upright Nikon Eclipse 800 microscope with a high numerical dark-field condenser (N.A. 1.20–1.43, oil immersion) and a 100/1.4 NA oil Iris objective (Cfi Plan Fluor). In the dark-field configuration, the condenser delivers a narrow beam of white light from a tungsten lamp and the high NA oil immersion objective collects only the scattered light from the samples. The dark-field imaging was captured using a QImaging Micropublisher 3.3 RTV color camera. The Qcapture software was used for image acquisition and has a feature for adjusting the white color balance for accurately capturing the color differences in samples.
Cell viability assay
MDM (10,000 cells/ml/well) were incubated with morphine (10−7M), or galectin-1 (2 μm, R&D Systems), and nanoplex for 30 min, 2, 12, 24, 48 and 72 hr. MDM were subsequently incubated with the (3-(4,5-Dimethylthiazol-2-yl)-2,5-diphenyltetrazolium bromide, MTT, Sigma-Aldrich) for approximately 3 hr, followed by addition of a detergent solution to lyse the cells and solubilize the colored crystals. The samples were read using an ELISA plate reader at a wavelength of 570 nm.
Infection of MDM with HIV-1
In one series of experiments, MDM (1×10⁵ cells/ml) were treated morphine (10−7M) for 24 hr and then recombinant galectin-1 (2 μm) for 30 min prior to infection with HIV-1. In another series of experiments, MDM (1×10⁵ cells/ml) were treated with nanoplex for (24 hr), then morphine (10−7M) for 24 hr prior to infection with HIV-1.
Cells were washed and subsequently infected with CCR5 (R5)-using virus HIV-1 BaL (Advanced Biotechnologies, Columbia, MD) at multiplicity of infection (MOI) of 0.05 for 2 hr washed 3 times with Hank’s balanced salt solution (Invitrogen, Grand Island, NY) before being returned to culture for 5, 10, 15 days. The culture supernates were assayed for p24 antigen using a p24 ELISA kit (ZeptoMetrix Corporation, Buffalo, NY) on day 5, 10 and 15. Cells were harvest for RNA analyses at day 10 for quantification of p24 and HIV-LTR-R/U5 gene expression (34–36).
Statistics
Multiple comparisons were calculated using ANOVA followed by Bonferroni post-hoc test (SPSS). Data represent the mean ± standard deviation.
Results
Galectin-1 expression is increased by morphine
It is well established that addictive drugs modulate the expression of various genes and proteins (37, 38). We have shown that treatment of IDC and astrocytes with methamphetamine and heroin, respectively, increase the expression of galectin-1 (21, 39). Therefore, we sought to determine whether morphine could modulate galectin-1 gene expression in human MDM. As shown in shown in Figure 1A, morphine significantly increased galectin-1 gene expression at 10−7 and 10−5 M at 12 hr with no change in expression at 6 hr. At 24 hr, gene expression for galectin-1 was significantly increased at 10−9, 10−7 and 10−5 M and at 10−9 and 10−7 M for 48 hr. These data demonstrate that morphine modulates galectin-1 gene expression at various times and doses in MDM. We next performed western blotting to validate the changes in gene expression of galectin-1 in MDM. Shown in Figure 1B, morphine significantly increased galectin-1 protein expression at 10−7 and 10−5 M at 12, 24 and 48 hr with no change at 6 hr. β-Actin, was used as an internal control, showed an equivalent protein content among all samples (data not shown). These data are consistent with gene expression data. Since the maximal effects of morphine on gene and protein expression were observed at 10−7M, further validation in the changes in expression of galectin-1 were done using immunofluorescence and subsequent confocal microscopy using 10−7M morphine. Data demonstrate immunostaining for galectin-1 in MDM, with cell nuclei labeled blue (DAPI) (Figure 1C, a–f). Morphine increased galectin-1 protein expression at10−7M at 12 hr (d), 24 (e) and 48 hr (f) compared to control (b). These data confirm both Q-PCR and western blotting data. Since galectin-1 is secreted by macrophage we next investigated the effects of morphine on unbound galectin-1 in the supernatant. MDM were treated with various concentrations of morphine (10−13-10−5M) for 6, 12, 24 and 48 hr then assessed for galectin-1 protein release by ELISA. As shown in Figure 1D, in MDM there was a concentration-dependent increase in galectin-1 protein release after morphine treatment at all-time points. With significance occurring at 10−7M morphine at 6, 12, 24, 48 hr. Collectively, Q-PCR, western blotting, immunostaining and ELISA demonstrate that morphine enhances the expression and release of galectin-1 from human MDM.
Figure 1. Morphine regulates galectin-1 gene and protein expression in MDM.
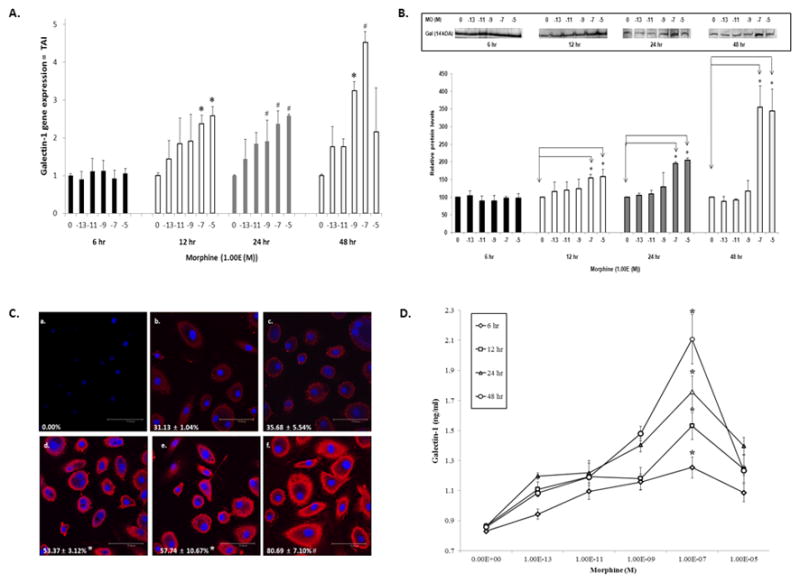
MDM were incubated with morphine (10−13-10−5M), for 6, 12, 24 or 48 hr. A) Gene expression for galectin-1 was determined using Q-PCR, (n=4–6). B) Galectin-1 protein expression was determined using western blotting. Immunoreactive protein bands were semiquantified by densitometric analysis and normalized to β-actin levels. Data are expressed as relative protein levels, control values were arbitrarily set to 100 relative protein units. Representative western blot is shown in inset (n=4). C) Representative confocal image of galectin-1 protein expression following morphine (10−7M) incubation (a) isotype-matched control antibody (b) control (c) 6 hr morphine (d) 12 hr morphine e) 24 hr morphine f) 48 hr morphine. Percent galectin-1 positive cells is shown in each panel (n=5). D) Supernates were assayed for galectin-1 protein using ELISA (n=4). All statistical significance was calculated using ANOVA followed by Bonferroni post-hoc test, * p <0.001; # p<0.05. Data represent the mean ± standard deviation. MO = morphine; Gal = galectin-1.
In Vitro Uptake of Nanoplexes in MDM and RNA interference
Previously we have shown that delivery and gene silencing efficiency of siRNA using GNRs is superior to a commercially available transfection reagent (22). Therefore we used GNRs as a carrier to deliver galectin-1 specific siRNA to MDM. Cationic GNRs were electrostatically attached to anionic galectin-1 specific siRNAFAM (FAM = 6-carboxyfluorescein, fluorophore label) resulting in formation of nanoplexes. This siRNA/GNR complex will be referred to as the nanoplex or nanoplexes. The strong orangered plasmonic scattering associated with GNRs was used to monitor cellular delivery of the nanoplex using dark-field microscopy (26, 27) and fluorescent microscopy was used to evaluate delivery of siRNA using FAM, fluorescent label attached to siRNA. Figure 2A shows 100X dark field images (a–d) of MDM 24 hr post transfection with nanoplexes and the corresponding fluorescent images (e–h). These images confirm the entry/cellular uptake of nanoplexes in MDM: (a) untransfected MDM, (b) GNRs alone, (c) free galectin-siRNA and (d) nanoplexes 24 hr-post transfection. Cellular uptake of the nanoplexes was observed from the strong orange-red scattering of nanoplex treated (d), as opposed to the untreated, MDM (a). Fluorescent microscopy (e–h) of FAM labeled siRNA was also used to confirm the cellular entry of the nanoplexes. From the Figure 2A, uptake of nanoplex was observed at 24 hr post transfection (h) compared to control (e) and free galectin-siRNAFAM (g). These data demonstrated delivery of the nanoplex to MDM. We next investigated the viability of MDM following incubation with nanoplexes, morphine (10−7M), galectin-1 (2 μm) for various time frames (Figure 2B). Data demonstrate that cell viability was not affected in nanoplex, morphine or galectin-1 treated MDM as compared to untreated control MDM. These data confirm that the paradigms we are investigating are not toxic to MDM. We next investigated RNA interference for galectin-1 using the nanoplexes in MDM. Endogenous galectin-1 gene expression in the absence of morphine or HIV-1 was investigated at 24, 48 and 72 hr post-transfection of nanoplexes in MDM using Q-PCR. As shown in Figure 2C, the nanoplexes significantly decreased gene expression for galectin-1 at 24, 48 and 72 hr compared to control. GNRs alone and scrambled siRNA/GNRs had no effect on galectin-1 gene expression. The decrease in gene expression was further validated using western blotting. Representative western blots and densitometry quantification are shown in Figure 2D. The levels of endogenous galectin protein expression were significantly decreased 24, 48 and 72 hr post transfection of the nanoplex in the absence of morphine or HIV-1. GNRs alone or scrambled siRNA had no effect on protein expression. These data demonstrate that nanoplexes are able to silence not only gene expression for galectin-1 but also prevent translation for galectin-1 protein.
Figure 2. Effect of Nanoplex on MDM.
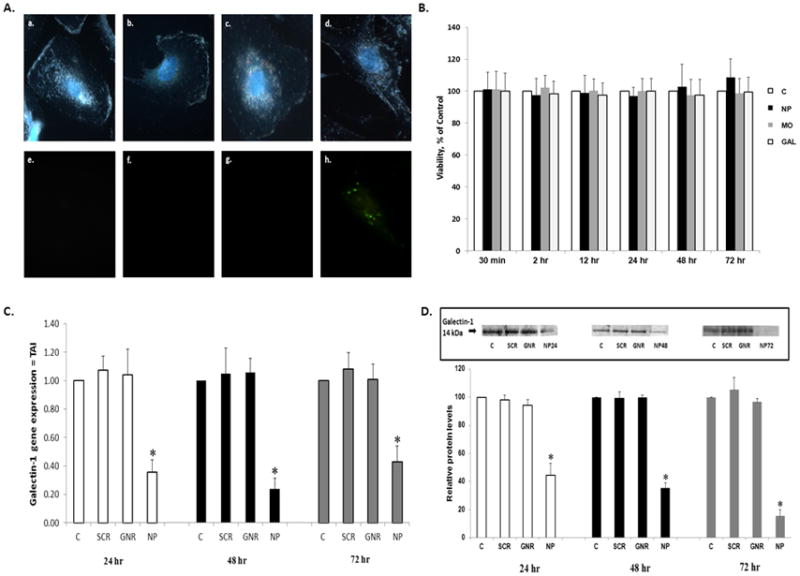
MDM were transfected with GNRs, free siRNA, scrambled siRNA and nanoplexes for various time frames. A) Representative dark-field images with DAPI nuclear staining (100X) (a–d) and corresponding fluorescent images (e–h) of untransfected (a, e) MDM, GNRs alone (b, f), free galectin-siRNAFAM (c, g) and nanoplexesFAM (d, h) 24 hr-post transfection. B) Cell viability as determined by MTT cell proliferation assay. Data are presented at Viability, percent of control, (n = 4). C) Gene expression for galectin-1 in MDM following transfection of galectin-1 siRNA/GNR nanoplexes (n = 6) in the absence of morphine or HIV-1 infection. D) Galectin-1 protein expression following transfection with galectin-1 siRNA/GNR nanoplexes in the absence of morphine or HIV-1 infection. Immunoreactive protein bands were semiquantified by densitometric analysis and normalized to β-actin levels. Data were expressed as relative protein levels, control values were arbitrarily set to 100 relative protein units. Representative western blot is shown (n = 4). All statistical significance was calculated using ANOVA followed by Bonferroni post-hoc test, * p <0.001. Data represent the mean ± standard deviation. C = control; NP = nanoplex; MO = morphine (10−7M); GAL = galectin-1; SCR = scrambled; GNR = gold nanorod.
RNA interference prevents morphine induced potentiation of galectin-1 expression
Since we have shown that morphine potentiates galectin-1 gene and protein expression (Figure 1), we next investigated the effect of the nanoplexes on this potentiation of galectin-1 expression. Twenty-four hours post-transfection with nanoplexes, MDM were treated with morphine (10−7M). RNA and protein were isolated 24 hr later. As shown in Figure 3A, the effects of morphine on galectin-1 gene expression were reversed in the presence of the nanoplex compared to morphine alone. We further validated this finding using western blotting and immunofluorescent staining. Shown in Figure 3B, protein expression levels of galectin-1 were decreased in the presence of the nanoplex alone. Furthermore, the effects of morphine on galectin-1 protein expression were reversed in the presence of the nanoplex. Immunofluorescence further confirmed these findings. Immunofluorescent immunostaining (Figure 3C) demonstrates that 48 hr post-transfection (c), nanoplexes decreased galectin-1 protein expression compared to control (a). Twenty-four hr incubation with morphine potentiated galectin-1 protein expression (b) which was reversed in the presence of the nanoplex (d).
Figure 3. The effect of the nanoplex on morphine modulation of galectin-1 expression from MDM.
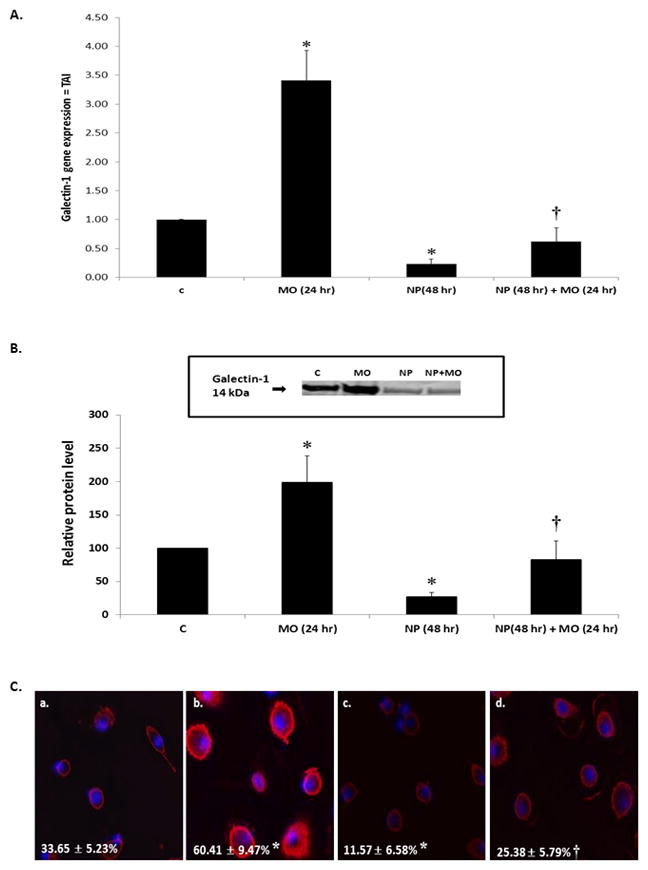
MDM were transfected with galectin-1 siRNA/GNR nanoplexes (24 hr), then incubated in the presence of 10−7M morphine (24 hr). A) Gene expression for galectin-1 (n = 6). B) Galectin-1 protein expression. Immunoreactive protein bands were semiquantified by densitometric analysis and normalized to β-actin levels. Data are expressed as relative protein levels, control values were arbitrarily set to 100 relative protein units. Representative western blot is shown (n = 4). C) Representative confocal image of galectin-1 protein (a) control (b) 24 hr morphine (c) 48 hr nanoplex (d) 48 hr nanoplex + 24 hr morphine. Percent galectin-1 positive cells is shown in each panel (n = 6). All statistical significance was calculated using ANOVA followed by Bonferroni post-hoc test, * compared to control; † compared to morphine alone. Data represent the mean ± standard deviation. C = control; MO = morphine; NP = nanoplex.
HIV-1 analyses
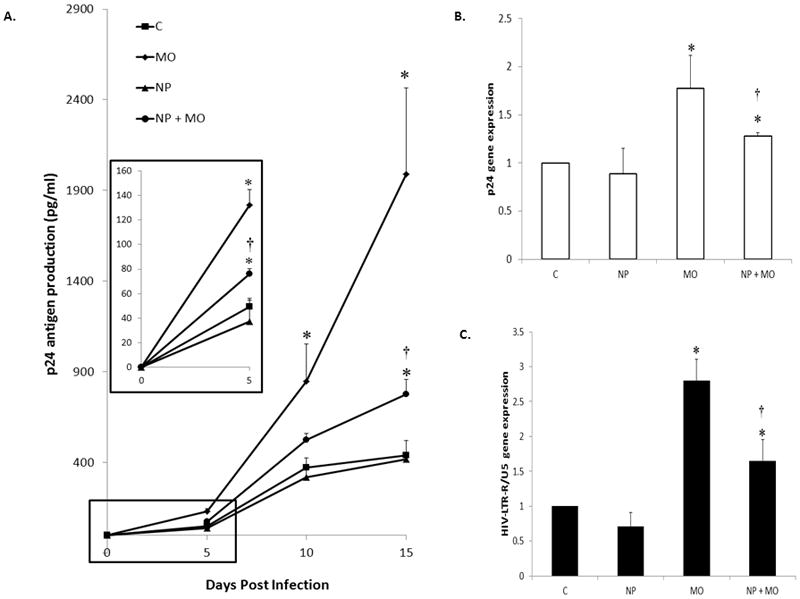
Previous studies demonstrate that individually both galectin-1 and addictive drugs enhance HIV-1 infection of MDM (2, 3, 5, 18–20). Confirming these previous studies, both exogenous recombinant galectin-1 (2 μm, 30 min incubation) and morphine (10−7M, 24 hr) alone prior to HIV-1 infection enhanced p24 antigen production at 5, 10 and 15 days post-infection of MDM (Figure 4A). Since both galectin-1 and morphine alone increase HIV-1 infection we next investigated the effects of concomitant administration of exogenous galectin-1 and morphine on levels of HIV-1 p24 antigen. We found concomitant incubation of morphine (10−7M, 24 hr) with recombinant galectin-1 (2 μm, 30 min) prior to infection had a synergistic effect on levels of p24 antigen by MDM at 5, 10 and 15 days post-infection. Since maximal levels of p24 antigen were produced at 10 days post infection by galectin-1 and galectin-1 + morphine, we investigated p24 antigen gene expression at this time period using the previous paradigm. We found that both morphine and galectin alone increased p24 antigen gene expression compared to control (Figure 4B). Furthermore, concomitant incubation with galectin-1 and morphine significantly enhanced gene expression for p24 antigen compared to control, morphine alone and galectin alone. We next investigated changes in amplification of the HIV-LTR-R/U5 region using Q-PCR on day 10 post-infection. This method is designed to detect early stages of reverse transcription of HIV-1 (36). We found that both morphine and galectin alone increased gene expression for HIV-LTR-R/U5 compared to control (Figure 4C). Furthermore, concomitant incubation with galectin-1 and morphine significantly enhanced gene expression for HIV-LTR-R/U5 compared to control, morphine alone and galectin alone. These data, p24 antigen assay, p24 gene expression and HIV-LTR-R/U5 gene expression, indicate that concomitant morphine and galectin-1 enhance HIV-1 infection of MDM.
Figure 4. Effect of galectin and morphine on HIV-1 infection.
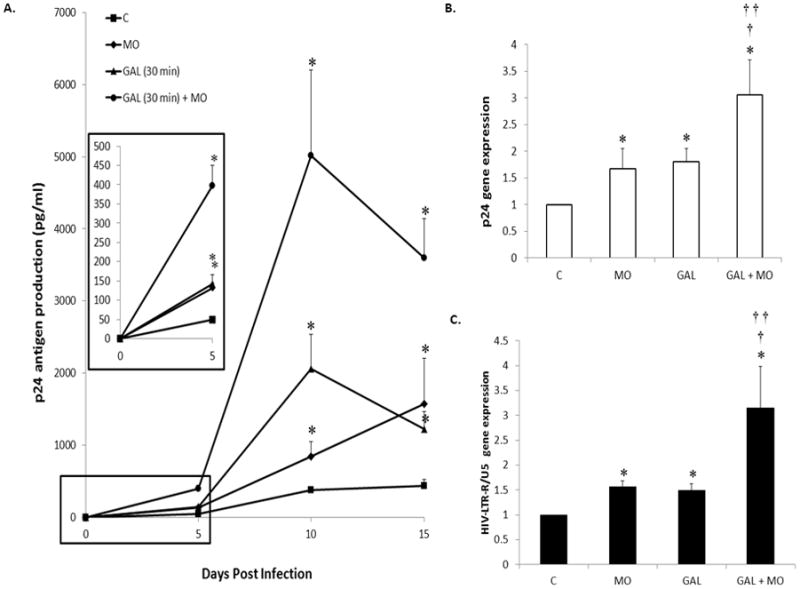
MDM were incubated with morphine (10−7M, 24 hr) alone or recombinant galectin-1 (2 μM, 30 min) alone or concomitantly prior to infection with HIV-1. A) Supernatants were collected on day 5, 10, 15 post-infection as assayed for p24 antigen. Data are presented as p24 antigen levels (pg/ml). Inset represents graph at 5 days post-infection (n = 6). B) RNA was isolated on day 10 post infection; p24 antigen gene expression was quantitated using Q-PCR (n = 6). C) RNA was isolated on day 10 post infection; HIV-LTR-R/U5 antigen gene expression was quantitated using Q-PCR (n = 6). All statistical significance was calculated using ANOVA followed by Bonferroni post-hoc test, * compared to control; † compared to morphine alone; †† compared to recombinant galectin-1 alone. Data represent the mean ± standard deviation. C = control; MO = morphine; GAL = galectin-1.
We next investigated whether a mechanism of enhanced HIV-1 infection by morphine may be by modulating endogenous galectin-1. MDM were transfected with nanoplexes and incubated for 24 hr and then treated with (10−7M) morphine for 24 hr. After morphine treatment, MDM were infected with HIV-1 for 2 hr, washed and returned to culture. The levels of p24 antigen were measured at day 5, 10, and 15 post-infection. Shown in Figure 5A, morphine enhanced p24 antigen production compared to control MDM. Prior incubation with nanoplexes before morphine treatment partially reversed the potentiation in p24 antigen production compared to morphine alone. We next investigated p24 antigen and HIV-LTR-R/U5 gene expression at 10 days post-infection, using the above previous paradigm. We found that morphine increased p24 antigen and HIV-LTR-R/U5 gene expression compared to control (Figure 5B & 5C) which were partially reversed in the presence of the nanoplex. These data indicate that the mechanism by which morphine enhances HIV-1 of MDM is not regulated by galectin-1 alone. The nanoplex significantly reduced HIV-1 infection compared to morphine alone, but did not return levels to untreated MDM. Future studies are necessary to elucidate which proteins galectin-1 may act concomitantly with to regulate morphine induced HIV-1 infections of MDM. However, these studies implicate the important role that galectin-1 plays in addictive drug induced infections.
Figure 5. Effect of nanoplex on HIV-1 infection.
MDM were transfected with nanoplexes, 24 hr post transfection MDM were treated with 10−7M morphine for 24 hr then infected with HIV-1 for 2 hr, washed and returned to culture. A) p24 antigen levels were measured at day, 5, 10 and 15 post infection. Inset represents graph at 5 days (n = 6). B) RNA was isolated on day 10 post infection; 24 antigen gene expression was quantitated using Q-PCR (n = 6). C) RNA was isolated on day 10 post infection; HIV-LTR-R/U5 antigen gene expression was quantitated using Q-PCR (n = 6). All Statistical significance was calculated using ANOVA followed by Bonferroni post-hoc test, * compared to control; † compared to morphine alone. Data represent the mean ± standard deviation, C = control; MO = morphine; NP = nanoplex.
Discussion
Addictive drugs modulate the immune response. Martin et al. (40) demonstrated in a murine model of substance abuse morphine treatment impedes neutrophil and macrophage recruitment to wound sites. Chronic morphine administration to mice reduces both the volume of spleen and inguinal lymph nodes and the number of white blood cells (41). In vivo morphine suppresses rat natural killer cells (42). Systemic morphine administration to rats inhibits the expression of genes involved in antigen presentation on B lymphocytes (43). In regards to HIV-1 infection, morphine has differential effects on cells of the immune system. Peterson et al. (44) have shown that morphine stimulates the replication of HIV-1 within PBMC. In CD4+ T cell cultures, treatment with morphine for 30 min inhibited HIV-1 expression, whereas pre-treatment for 24 hr stimulated viral expression (45). Morphine amplifies HIV-1 expression in the chronically infected promonocytic clone U1 when cocultured with lipopolysaccharide-stimulated human fetal brain cells (46). Morphine stimulated HIV-1 replication in primary cultures of human Kupffer cells (47). Morphine significantly enhanced HIV-1 R5 strain infection of MDM but had little effect on X4 strain infection (5). Morphine significantly enhanced HIV-1 infection of neonatal MDM which was suppressed by naltrexone, the opioid receptor antagonist (48). The opioid antagonist methylnaltrexone abrogated morphine-induced HIV-1 Bal strain infection of MDM (49). These studies demonstrate the role of morphine as an immunomodulator. The current study demonstrates that morphine potentiates HIV-1 replication of MDM confirming previous studies.
Galectin-1 has been shown to play a role in immunomodulation. Studies have found an increase expression of galectin-1 in activated macrophages (50). Galectin-1 modulates constitutive and inducible FcγRI expression on monocytes/macrophages and FcγRI-dependent phagocytosis through an ERK1/2-dependent pathway (51). Galectin-1 initiates the activation of c-Jun N-terminal kinase (JNK), mitogen-activated protein kinase kinase 4 (MKK4), and MKK7 as upstream JNK activators in Jurkat T cells (52). Galectin-1 suppresses T cell proliferation and alloreactivity in human multipotent mesenchymal stromal cells (53). Galectin-1 inhibits the secretion of cytokines typical of Th1 and Th17 cells while promoting Th2-type cytokine secretion (54–56). Studies suggest that during the course of HIV-1 infection, a bias towards Th2-like responses and hence Th1 inhibition, may contribute to the loss of control of the immune system over HIV-1 infection (54–57). Therefore galectin-1 may regulate the immune systems response to HIV-1 infection.
Studies have shown that galectin-1 enhances HIV-1 infectivity and replication by allowing efficient binding of virus particles to target cells (18–20). Galectin-1 stabilizes virus-cell interaction and promotes virus replication in PBMC and CD4+ T cells (19). They report that galectin-1 facilitates HIV-1 infection by increasing the kinetics of HIV-1 binding to its target cell (19). They also demonstrate that galectin-1 acts as a soluble adhesion molecule by facilitating attachment of HIV-1 to the cell surface. Therefore, they proposed that galectin-1 can cross-link HIV-1 and target cells and promote a firmer adhesion of the virus to the cell surface, thereby augmenting the efficiency of the infection process (18–20). Studies by our laboratory have shown that addictive drugs enhance galectin-1 expression in iDC and normal human astrocytes resulting in enhanced HIV-1 infection (21, 39). The current study demonstrates that morphine enhances galectin-1 expression and enhances HIV-1 infection of MDM. Furthermore, we show that exogenous recombinant galectin-1, in combination with morphine, synergistically enhances HIV-1 viral infection compared to the treatment of MDM with exogenous galectin-1 alone. Since morphine is known to activate macrophages (5, 7, 48, 49) and activated macrophages secrete galectin-1 (50), these conditions are likely to exist in the drug using population blood milieu (ie morphine + galectin-1). These studies demonstrate the profound potential effects that concomitant morphine and galectin-1 have on HIV-1 infection in the drug using population. We further investigated whether morphine regulation of galectin-1 may play a role in enhanced infection of MDM. We demonstrate that gene silencing of galectin-1 partially reversed the potentiation of HIV-1 infection induced by morphine. Our current study supports the idea that galectin-1 stabilized HIV-1 interactions with MDM. Since viral attachment is a rate-limiting step for virus entry into a cell, we propose that morphine facilitates HIV-1 attachment to MDM by regulating galectin-1 expression and release.
However, our study also found that HIV-1 replication in the presence of the nanoplex and morphine was still enhanced compared to control. These data suggest a redundancy in the regulation of HIV-1 infectivity, such that galectin-1 may act concomitantly with another protein or molecule to regulate HIV-1 infection. Several studies have shown that morphine modulates the HIV-1 coreceptor CCR5, and enhanced expression of CCR5 plays a role in increased HIV-1 infection in macrophage (5, 48, 49). We found that morphine enhances CCR5 expression and siRNA against galectin-1 did not affect CCR5 expression in the absence of morphine. Further, the nanoplex had no effect on morphine induced potentiation of CCR5 expression (supplementary material). Future studies are necessary to elucidate the interaction between galectin-1 and CCR5. We propose that concomitant silencing of galectin-1 and CCR5 may be ideal candidates for therapeutic prevention of HIV-1 infection in addictive drug users.
Supplementary Material
Acknowledgments
This work was supported by the National Institutes of Health.
K01DA024577 (JR)
R01AI085569 (SAS)
R21DA030108 (SM)
Kaleida Health Foundation (SAS)
References
- 1.Hamamoto DT, Rhodus NL. Methamphetamine abuse and dentistry. Oral Dis. 2009;15(1):27–37. doi: 10.1111/j.1601-0825.2008.01459.x. [DOI] [PubMed] [Google Scholar]
- 2.Liang H, Wang X, Chen H, Song L, Ye L, Wang SH, Wang YJ, Zhou L, Ho WZ. Methamphetamine enhances HIV infection of macrophages. Am J Pathol. 2008;172(6):1617–1624. doi: 10.2353/ajpath.2008.070971. [DOI] [PMC free article] [PubMed] [Google Scholar]
- 3.Toussi SS, Joseph A, Zheng JH, Dutta M, Santambrogio L, Goldstein H. Short communication: Methamphetamine treatment increases in vitro and in vivo HIV replication. AIDS Res Hum Retroviruses. 2009;25(11):1117–1121. doi: 10.1089/aid.2008.0282. [DOI] [PMC free article] [PubMed] [Google Scholar]
- 4.Roth MD, Whittaker KM, Choi R, Tashkin DP, Baldwin GC. Cocaine and sigma-1 receptors modulate HIV infection, chemokine receptors, and the HPA axis in the huPBL-SCID model. J Leukoc Biol. 2005;78(6):1198–1203. doi: 10.1189/jlb.0405219. [DOI] [PubMed] [Google Scholar]
- 5.Guo CJ, Li Y, Tian S, Wang X, Douglas SD, Ho WZ. Morphine enhances HIV infection of human blood mononuclear phagocytes through modulation of beta-chemokines and CCR5 receptor. J Investig Med. 2002;50(6):435–442. doi: 10.1136/jim-50-06-03. [DOI] [PMC free article] [PubMed] [Google Scholar]
- 6.Le Douce V, Herbein G, Rohr O, Schwartz C. Molecular mechanisms of HIV-1 persistence in the monocyte-macrophage lineage. Retrovirology. 2010;7:32. doi: 10.1186/1742-4690-7-32. [DOI] [PMC free article] [PubMed] [Google Scholar]
- 7.Herbein G, Varin A. The macrophage in HIV-1 infection: from activation to deactivation? Retrovirology. 2010;7:33. doi: 10.1186/1742-4690-7-33. [DOI] [PMC free article] [PubMed] [Google Scholar]
- 8.Bergamaschi A, Pancino G. Host hindrance to HIV-1 replication in monocytes and macrophages. Retrovirology. 2010;7:31. doi: 10.1186/1742-4690-7-31. [DOI] [PMC free article] [PubMed] [Google Scholar]
- 9.Crowe S, Zhu T, Muller WA. The contribution of monocyte infection and trafficking to viral persistence, and maintenance of the viral reservoir in HIV infection. J Leukoc Biol. 2003;74(5):635–641. doi: 10.1189/jlb.0503204. [DOI] [PubMed] [Google Scholar]
- 10.Gilbert C, Cantin R, Barat C, Tremblay MJ. Human immunodeficiency virus type 1 replication in dendritic cell-T-cell cocultures is increased upon incorporation of host LFA-1 due to higher levels of virus production in immature dendritic cells. J Virol. 2007;81(14):7672–7682. doi: 10.1128/JVI.02810-06. [DOI] [PMC free article] [PubMed] [Google Scholar]
- 11.Fortin JF, Cantin R, Tremblay MJ. T cells expressing activated LFA-1 are more susceptible to infection with human immunodeficiency virus type 1 particles bearing host-encoded ICAM-1. J Virol. 1998;72(3):2105–2112. doi: 10.1128/jvi.72.3.2105-2112.1998. [DOI] [PMC free article] [PubMed] [Google Scholar]
- 12.Barondes SH, Cooper DN, Gitt MA, Leffler H. Galectins. Structure and function of a large family of animal lectins. J Biol Chem. 1994;269(33):20807–20810. [PubMed] [Google Scholar]
- 13.Chiariotti L, Salvatore P, Frunzio R, Bruni CB. Galectin genes: regulation of expression. Glycoconj J. 2004;19(7–9):441–449. doi: 10.1023/B:GLYC.0000014073.23096.3a. [DOI] [PubMed] [Google Scholar]
- 14.Liu FT. Galectins: novel anti-inflammatory drug targets. Expert Opin Ther Targets. 2002;6(4):461–468. doi: 10.1517/14728222.6.4.461. [DOI] [PubMed] [Google Scholar]
- 15.Elola MT, Chiesa ME, Alberti AF, Mordoh J, Fink NE. Galectin-1 receptors in different cell types. J Biomed Sci. 2005;12(1):13–29. doi: 10.1007/s11373-004-8169-5. [DOI] [PubMed] [Google Scholar]
- 16.Almkvist J, Karlsson A. Galectins as inflammatory mediators. Glycoconj J. 2004;19(7–9):575–581. doi: 10.1023/B:GLYC.0000014088.21242.e0. [DOI] [PubMed] [Google Scholar]
- 17.Scott K, Weinberg C. Galectin-1: a bifunctional regulator of cellular proliferation. Glycoconj J. 2004;19(7–9):467–477. doi: 10.1023/B:GLYC.0000014076.43288.89. [DOI] [PubMed] [Google Scholar]
- 18.Ouellet M, Mercier S, Pelletier I, Bounou S, Roy J, Hirabayashi J, Sato S, Tremblay MJ. Galectin-1 acts as a soluble host factor that promotes HIV-1 infectivity through stabilization of virus attachment to host cells. J Immunol. 2005;174(7):4120–4126. doi: 10.4049/jimmunol.174.7.4120. [DOI] [PubMed] [Google Scholar]
- 19.Mercier S, St-Pierre C, Pelletier I, Ouellet M, Tremblay MJ, Sato S. Galectin-1 promotes HIV-1 infectivity in macrophages through stabilization of viral adsorption. Virology. 2008;371(1):121–129. doi: 10.1016/j.virol.2007.09.034. [DOI] [PubMed] [Google Scholar]
- 20.St-Pierre C, Ouellet M, Tremblay MJ, Sato S. Galectin-1 and HIV-1 Infection. Methods Enzymol. 2010;480:267–294. doi: 10.1016/S0076-6879(10)80013-8. [DOI] [PubMed] [Google Scholar]
- 21.Reynolds JL, Mahajan SD, Sykes DE, Schwartz SA, Nair MP. Proteomic analyses of methamphetamine (METH)-induced differential protein expression by immature dendritic cells (IDC) Biochim Biophys Acta. 2007;1774(4):433–442. doi: 10.1016/j.bbapap.2007.02.001. [DOI] [PMC free article] [PubMed] [Google Scholar]
- 22.Bonoiu AC, Mahajan SD, Ding H, Roy I, Yong KT, Kumar R, Hu R, Bergey EJ, Schwartz SA, Prasad PN. Nanotechnology approach for drug addiction therapy: gene silencing using delivery of gold nanorod-siRNA nanoplex in dopaminergic neurons. Proc Natl Acad Sci U S A. 2009;106(14):5546–5550. doi: 10.1073/pnas.0901715106. [DOI] [PMC free article] [PubMed] [Google Scholar]
- 23.Prasad PN. Introduction to Biophotonics. Wiley; New York: 2004. [Google Scholar]
- 24.Connor EE, Mwamuka J, Gole A, Murphy CJ, Wyatt MD. Gold nanoparticles are taken up by human cells but do not cause acute cytotoxicity. Small. 2005;1(3):325–327. doi: 10.1002/smll.200400093. [DOI] [PubMed] [Google Scholar]
- 25.Ghosh P, Han G, De M, Kim CK, Rotello VM. Gold nanoparticles in delivery applications. Adv Drug Deliv Rev. 2008;60(11):1307–1315. doi: 10.1016/j.addr.2008.03.016. [DOI] [PubMed] [Google Scholar]
- 26.Ding H, Yong KT, Roy I, Pudavar HE, Law WC, Bergey EJ, Prasad PN. Gold nanorords coated with multilayer polyelectrolyte as contrast agent for multimodal imaging. J Phys Chem C. 2007;34(111):12552–12557. [Google Scholar]
- 27.Sokolov K, Follen M, Aaron J, Pavlova I, Malpica A, Lotan R, Richards-Kortum R. Real-time vital optical imaging of precancer using antiepidermal growth factor receptor antibodies conjugated to gold nanoparticles. Cancer Res. 2003;63(9):1999–2004. [PubMed] [Google Scholar]
- 28.Mahajan SD, Schwartz SA, Shanahan TC, Chawda RP, Nair MP. Morphine regulates gene expression of alpha- and beta-chemokines and their receptors on astroglial cells via the opioid mu receptor. J Immunol. 2002;169(7):3589–3599. doi: 10.4049/jimmunol.169.7.3589. [DOI] [PubMed] [Google Scholar]
- 29.Mahajan SD, Schwartz SA, Aalinkeel R, Chawda RP, Sykes DE, Nair MP. Morphine modulates chemokine gene regulation in normal human astrocytes. Clin Immunol. 2005;115(3):323–332. doi: 10.1016/j.clim.2005.02.004. [DOI] [PubMed] [Google Scholar]
- 30.Bustin SA. Quantification of mRNA using real-time reverse transcription PCR (RT-PCR): trends and problems. J Mol Endocrinol. 2002;29(1):23–39. doi: 10.1677/jme.0.0290023. [DOI] [PubMed] [Google Scholar]
- 31.Radoni A, Thulke S, Mackay IM, Landt O, Siegert W, Nitsche A. Guideline to reference gene selection for quantitative real-time PCR. Biochem Biophys Res Commun. 2004;313(4):856–862. doi: 10.1016/j.bbrc.2003.11.177. [DOI] [PubMed] [Google Scholar]
- 32.Trika S, Jeremic AM. Clustering and Internalization of Toxic Amylin Oligomers in Pancreatic Cells Requires Plasma Membrane Cholesterol. J Biol Chem. 2011;286(41):36086–36097. doi: 10.1074/jbc.M111.240762. [DOI] [PMC free article] [PubMed] [Google Scholar]
- 33.Kumar U, Laird D, Srikant CB, Escher E, Patel YC. Expression of the Five Somatostatin Receptor (SSTR1-5) Subtypes in Rat Pituitary Somatotrophes: Quantitative Analysis by Double-Label Immunofluorescence Confocal Microscopy Endocrinology. 1997;138(10):4473–4476. doi: 10.1210/endo.138.10.5566. [DOI] [PubMed] [Google Scholar]
- 34.Balkundi S, Nowacek AS, Roy U, Martinez-Skinner A, McMillan J, Gendelman HE. Methods Development for Blood Borne Macrophage Carriage of Nanoformulated Antiretroviral Drugs. J Vis Exp. 2010;(46):2460. doi: 10.3791/2460. pii. [DOI] [PMC free article] [PubMed] [Google Scholar]
- 35.Gaskill PJ, Calderon TM, Luers AJ, Eugenin EA, Javitch JA, Berman JW. Human Immunodeficiency Virus (HIV) Infection of Human Macrophages Is Increased by Dopamine: A Bridge between HIV-Associated Neurologic Disorders and Drug Abuse. Am J Pathol. 2009;175(3):1148–1159. doi: 10.2353/ajpath.2009.081067. [DOI] [PMC free article] [PubMed] [Google Scholar]
- 36.Secchiero P, Zella D, Curreli S, Mirandola P, Capitani S, Gallo RC, Zauli G. Engagement of CD28 modulates CXC chemokine receptor 4 surface expression in both resting and CD3-stimulated CD4+ T cells. J Immunol. 2000;164:4018–4024. doi: 10.4049/jimmunol.164.8.4018. [DOI] [PubMed] [Google Scholar]
- 37.Chang SL, Connaghan KP. Behavioral and Molecular Evidence for a Feedback Interaction Between Morphine and HIV-1 Viral Proteins. J Neuroimmune Pharmacol. 2011 Nov 15; doi: 10.1007/s11481-011-9324-1. Epub. [DOI] [PubMed] [Google Scholar]
- 38.Avdoshina V, Biggio F, Palchik G, Campbell LA, Mocchetti I. Morphine induces the release of CCL5 from astrocytes: potential neuroprotective mechanism against the HIV protein gp120. Glia. 2010;58(13):1630–1639. doi: 10.1002/glia.21035. [DOI] [PMC free article] [PubMed] [Google Scholar]
- 39.Reynolds JL, Mahajan SD, Sykes D, Nair MP. Heroin-Induces Differential Protein Expression by Normal Human Astrocytes (NHA) Am J Infect Dis. 2006;2(2):49–57. doi: 10.3844/ajidsp.2006.49.57. [DOI] [PMC free article] [PubMed] [Google Scholar]
- 40.Martin JL, Koodie L, Krishnan AG, Charboneau R, Barke RA, Roy S. Chronic morphine administration delays wound healing by inhibiting immune cell recruitment to the wound site. Am J Pathol. 2010;176(2):786–799. doi: 10.2353/ajpath.2010.090457. [DOI] [PMC free article] [PubMed] [Google Scholar]
- 41.Vojdani Z, Dehghani F, Seyedi F, Noorafshan A, Baha-al-din, Bagi F. Quantitative study of the effects of morphine on the mouse spleen and inguinal lymph node. Arch Iran Med. 2010;13(4):294–300. [PubMed] [Google Scholar]
- 42.Van der Laan JW, Timmerman H, Van Loveren H. Comparison of the in vivo effects of morphine and methadone on natural killer cell activity in spleen, peritoneal cavity, and lungs in rats. Int J Immunopharmacol. 1996;18(6–7):401–407. doi: 10.1016/s0192-0561(96)00011-2. [DOI] [PubMed] [Google Scholar]
- 43.Beagles K, Wellstein A, Bayer B. Systemic morphine administration suppresses genes involved in antigen presentation. Mol Pharmacol. 2004;65(2):437–442. doi: 10.1124/mol.65.2.437. [DOI] [PubMed] [Google Scholar]
- 44.Peterson PK, Sharp BM, Gekker G, Portoghese PS, Sannerud K, Balfour HH., Jr Morphine promotes the growth of HIV-1 in human peripheral blood mononuclear cell cocultures. AIDS. 1990;4(9):869–873. doi: 10.1097/00002030-199009000-00006. [DOI] [PubMed] [Google Scholar]
- 45.Peterson PK, Gekker G, Hu S, Cabral G, Lokensgard JR. Cannabinoids and morphine differentially affect HIV-1 expression in CD4(+) lymphocyte and microglial cell cultures. J Neuroimmunol. 2004;147(1–2):123–126. doi: 10.1016/j.jneuroim.2003.10.026. [DOI] [PubMed] [Google Scholar]
- 46.Peterson PK, Gekker G, Hu S, Anderson WR, Kravitz F, Portoghese PS, Balfour HH, Chao CC., Jr Morphine amplifies HIV-1 expression in chronically infected promonocytes cocultured with human brain cells. J Neuroimmunol. 1994;50(2):167–175. doi: 10.1016/0165-5728(94)90043-4. [DOI] [PubMed] [Google Scholar]
- 47.Schweitzer C, Keller F, Schmitt MP, Jaeck D, Adloff M, Schmitt C, Royer C, Kirn A, Aubertin AM. Morphine stimulates HIV replication in primary cultures of human Kupffer cells. Res Virol. 1991;142(2–3):189–195. doi: 10.1016/0923-2516(91)90056-9. [DOI] [PubMed] [Google Scholar]
- 48.Li Y, Merrill JD, Mooney K, Song L, Wang X, Guo CJ, Savani RC, Metzger DS, Douglas SD, Ho WZ. Morphine enhances HIV infection of neonatal macrophages. Pediatr Res. 2003;54(2):282–288. doi: 10.1203/01.PDR.0000074973.83826.4C. [DOI] [PMC free article] [PubMed] [Google Scholar]
- 49.Ho WZ, Guo CJ, Yuan CS, Douglas SD, Moss J. Methylnaltrexone antagonizes opioid-mediated enhancement of HIV infection of human blood mononuclear phagocytes. J Pharmacol Exp Ther. 2003;307(3):1158–1162. doi: 10.1124/jpet.103.056697. [DOI] [PMC free article] [PubMed] [Google Scholar]
- 50.Rabinovich GA, Riera CM, Sotomayor CE. Galectin-1, an alternative signal for T cell death, is increased in activated macrophages. Braz J Med Biol Res. 1999;32(5):557–567. doi: 10.1590/s0100-879x1999000500009. [DOI] [PubMed] [Google Scholar]
- 51.Barrionuevo P, Beigier-Bompadre M, Ilarregui JM, Toscano MA, Bianco GA, Isturiz MA, Rabinovich GA. A novel function for galectin-1 at the crossroad of innate and adaptive immunity: galectin-1 regulates monocyte/macrophage physiology through a nonapoptotic ERK-dependent pathway. J Immunol. 2007;178(1):436–445. doi: 10.4049/jimmunol.178.1.436. [DOI] [PubMed] [Google Scholar]
- 52.Brandt B, Abou-Eladab EF, Tiedge M, Walzel H. Role of the JNK/c-Jun/AP-1 signaling pathway in galectin-1-induced T-cell death. Cell Death Dis. 2010;1(2):e23. doi: 10.1038/cddis.2010.1. [DOI] [PMC free article] [PubMed] [Google Scholar]
- 53.Gieseke F, Böhringer J, Bussolari R, Dominici M, Handgretinger R, Müller I. Human multipotent mesenchymal stromal cells use galectin-1 to inhibit immune effector cells. Blood. 2010;116(19):3770–3779. doi: 10.1182/blood-2010-02-270777. [DOI] [PubMed] [Google Scholar]
- 54.Endharti AT, Zhou YW, Nakashima I, Suzuki H. Galectin-1 supports survival of naive T cells without promoting cell proliferation. Eur J Immunol. 2005;35(1):86–97. doi: 10.1002/eji.200425340. [DOI] [PubMed] [Google Scholar]
- 55.Rabinovich GA, Ariel A, Hershkoviz R, Hirabayashi J, Kasai KI, Lider O. Specific inhibition of T-cell adhesion to extracellular matrix and proinflammatory cytokine secretion by human recombinant galectin-1. Immunology. 1999;97(1):100–106. doi: 10.1046/j.1365-2567.1999.00746.x. [DOI] [PMC free article] [PubMed] [Google Scholar]
- 56.Romagnani S. T-cell subsets (Th1 versus Th2) Ann Allergy Asthma Immunol. 2000;85:9–21. doi: 10.1016/S1081-1206(10)62426-X. [DOI] [PubMed] [Google Scholar]
- 57.Romagnani P, Annunziato F, Piccinni MP, Maggi E, Romagnani S. Th1/Th2 cells, their associated molecules and role in pathophysiology. Eur Cytokine Netw. 2000;11(3):510–511. [PubMed] [Google Scholar]
Associated Data
This section collects any data citations, data availability statements, or supplementary materials included in this article.