Abstract
The hydrolysis of various carbohydrates was investigated under acidic conditions in real time by 1H NMR spectroscopy, with a focus on the polysaccharide inulin. Sucrose was used as a model compound to illustrate the applicability of this technique. The hydrolysis of sucrose was shown to follow pseudo first order kinetics and have an activation energy of 107.0 kJ.mol−1 (s.d. 1.7 kJ.mol−1). Inulin, pullulan and glycogen also all followed pseudo first order kinetics, but had an initiation phase at least partially generated by the protonation of the glycosidic bonds. It was also demonstrated that polysaccharide chain length has an effect on the hydrolysis of inulin. For short chain inulin (DPn 18, s.d. 0.70) the activation energy calculated for the hydrolytic cleavage of glucose was similar to sucrose at 108.5 kJ.mol−1 (std. dev. 0.60). For long chain inulin (DPn 30, s.d. 1.3) the activation energy for the hydrolytic cleavage of glucose was reduced to 80.5 kJ.mol−1 (s.d. 2.3 kJ.mol−1). This anomaly has been attributed to varied conformations for the two different lengths of inulin chain in solution.
Keywords: Inulin, Polysaccharide hydrolysis, 1H NMR spectroscopy
1. Introduction
Inulin is a naturally occurring storage polysaccharide, mostly found in plants of the Compositae family including chicory, dahlia, and Jerusalem artichoke.1–3 The polymer comprises linear chains of fructosyl groups linked by (2→1) glycosidic bonds and terminated at the reducing end by an α-D-(1→2)-glucopyranoside ring.4–6 Generally, plant inulins are found to have chains incorporating 2–100 fructose units, with the chain length and polydispersity depending on plant species and the point in its life cycle.2,7,8 This range of chain lengths provides varying aqueous solubility that makes inulin useful for a number of different applications in diverse fields, most predominantly the food and pharmaceutical industries, where the fact that inulin is nontoxic and biochemically inert is also of value.9
Particulate inulin is useful because particular isoforms afford anti-cancer10,11 and immunomodulatory properties not shared by soluble inulin.12–16 Partially solubilised natural and chemically modified inulins can form gels, which have been used as drug delivery vehicles for water soluble drugs,17–19 and as stabilising matrices for labile drugs.20–22 Inulin gels are also used extensively in the food industry, primarily as a bulking agent replacing fat, sugar and flour.2,5,23 Solubilised inulin is used in food products as well, adding texture to drinks.24 In these food applications the fact that inulin is indigestible to humans, but can be broken down by microorganisms in the gut, means that it provides low food energy while also promoting healthy intestinal microflora.25–28 Dissolved inulin is also applied as an analytical tool in diagnoses, such as measurements of extracellular volume and renal function testing.29,30
Inulin, being capped at the reducing end of the polyfructosyl chain with glucose, is stable to redox chemistry when compared to reducing carbohydrates,9 though a small percentage of glucose-free, reducing chains is usually found in naturally sourced inulin.3,31 Inulin is also stable to hydrolysis in aqueous systems at room temperature and neutral pH. However, at higher temperatures in the presence of acid, hydrolysis of inulin can become significant leading to the eventual decomposition of the polymer into its component monosaccharide units.24,32–35 While hydrolysis of inulin can also be induced by basic pH, this only occurs through carbonyl chemistry and thus can only happen for inulin that is already cleaved and contains a reducing end.35–38
A better understanding of the hydrolysis of inulin is important for its commercial uses, as processing commonly involves the factors of heat and/or acidity that promote inulin hydrolysis, with hydrolysis actually being desired in some cases to create lower molecular weight oligosaccharides.24 Generally, methods to measure the hydrolysis of inulin and other carbohydrates are relatively inconvenient, such as chromatography techniques24,32 or are relatively nonspecific, such as colorimetric and polarimetry techniques.35,39 Herein we report on a new method to monitor the hydrolysis of inulin in real time using 1H Nuclear Magnetic Resonance (NMR) spectroscopy that provides both convenience and specificity.
2. Results and Discussion
2.1 Experimental Conditions
Hydrolysis reactions were conducted in deuterium oxide (D2O) so that they could be monitored by 1H NMR spectroscopy. While reactions that utilise acid or base catalysis can proceed more rapidly in water than in D2O, due to ionisation and solvation changes,40 generally the reactions behave similarly and it was important in this case that there was maximum deuterium exchange of the hydroxyl groups on the sugar molecules to simplify the complex NMR spectra as much as possible.41 The 1H NMR spectral complexity is caused by the overlapping resonances for inulin and for both of the component monomeric species and their multiple tautomeric forms.42–45 Assignment of the 1H NMR resonances for inulin in D2O has been conducted previously by extensive NMR spectroscopic analyses43,46 and our own 2D NMR spectroscopic analysis confirmed those assignments. Glucose and fructose 1H NMR spectroscopic assignments in D2O are also available in the literature,42,47–49 demonstrating that glucose consists of two anomers in solution while fructose equilibrates into at least 5 different tautomers.50–53 Despite the number of detectable species in solution, sufficiently separated resonances for each species have been identified to make this analysis possible (see supplementary data for tables of 1H NMR shifts for each carbohydrate discussed).42,47–49
2.1.1 DPn of Inulin
The hydrolysis of two different types of inulin was investigated in this research; a shorter chain synthetic inulin (Fuji FF) and a longer chain natural chicory inulin (OraftiInutec®). The number average degrees of polymerisation (DPn) of the two inulin samples were determined by end group analysis using 1H NMR spectroscopy. The DPn of inulin has more commonly been measured using chromatography. This technique suffers from a lack of calibration standards, poor resolution for some specific short chain lengths and in general for higher molecular weights,9,25 but does provide an indication of polydispersity that NMR spectroscopy is unable to determine. Using 1H NMR spectroscopy the relative amount of the single glucose group of the polymer chain is represented by the integral of the resonance for the anomeric glucose proton at 5.44 ppm. This resonance is isolated from the other overlapping resonances and its integral was set to one. The other peaks for the glucose unit and the fructose units of inulin occur in the region of the spectrum between 3.30 ppm and 4.40 ppm. This region was integrated and calibrated to the anomeric glucose proton, giving the number of protons in the rest of the chain (Integral X). The DPn was then calculated using the following formula, ([Integral X − 6]/7) + 1. To mitigate the influence of inconsistent data manipulation of the spectra, two 1H NMR spectra were obtained for each sample and analysis on each spectrum was conducted three times and the results averaged. This resulted in a calculated DPn for the short chain inulin of 18 (s.d. 0.70) and for the long chain inulin of 30 (s.d. 1.3). The result for short chain inulin (Fuji FF) falls within the range of DPn determined by others using chromatography.54
2.1.2 Acidification
Acetic acid was a component of the hydrolysis mixture operating as reference and as an internal standard, as well as contributing to the acceleration of hydrolysis.55 Acetic acid alone was not a strong enough acid to hydrolyse the carbohydrates at a sufficient rate for timely analysis of the reaction at concentrations in which it could also operate effectively as an internal standard. As such, trifluoroacetic acid (TFA) was also added as TFA has nearly 5 orders of magnitude greater acidic strength than acetic acid. TFA is popular in carbohydrate hydrolysis reactions33,56–58 because it has been determined to help prevent the decomposition of the monosaccharides during the hydrolysis reaction.33 Nonetheless, it rapidly induces hydrolysis in a manner comparable to mineral acids57 and can be relatively simply removed post reaction by evaporation.57,58 Removal of TFA is not necessary for 1H NMR spectroscopy as it has no interfering signals and can actually benefit the spectra by narrowing the broad HDO signal.59
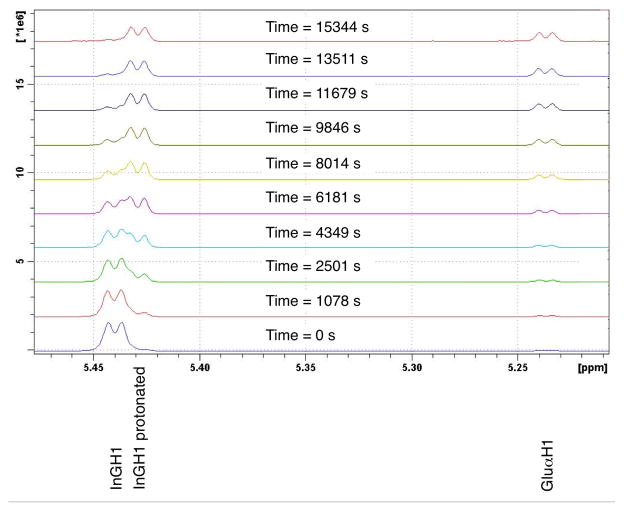
For the hydrolysis of inulin (25 mg.mL−1) in D2O, pH measurements showed that acidification of the reaction mixture with 0.25% (v/v) acetic acid and 0.025% (v/v) TFA gave an initial pH of 2.3, within the range commonly used in inulin processing.60 Upon heating to 60 °C the pH of the reaction mixture rose, in an exponential fashion, a total of 0.3 pH units over the course of an hour due to the consumption of hydrogen ions in the protonation of the glycosidic bonds in the inulin chains.34 This process was observed occurring in the 1H NMR spectra for the glucosyl to fructosyl glycosidic bond by the upfield shift of the adjacent glucose anomeric proton over time (Figure 1). We associate this acidification process with an initiation step in which the initial rate of hydrolysis is slowed, confirming that protonation of the glycosidic oxygen is an important initial step for the hydrolysis of inulin, as claimed previously.24,34 In separate tests, the reaction was first order with regards to acid concentration over the temperature range from 60 °C to 80 °C, in agreement with the previous literature.60
Figure 1.
1H NMR spectra of short chain inulin dissolved in D2O (25 mg.mL−1), acidified with acetic acid (0.25 % v/v) and TFA (0.025 % v/v) and heated to 60 °C. Note the shift in the peak at 5.44 ppm (InGH1) over time due to the protonation of the glucosyl to fructosyl glycosidic bond. The intensity of this peak also reduced over time as the bond was hydrolysed, generating glucose as illustrated by the growing peak at 5.24 ppm for α-D-glucose (Glu H1)
2.2 Hydrolysis of Sucrose
The disaccharide sucrose is the material from which inulin is biosynthesised.61 It is the starting molecule, explaining the glucose end cap of inulin, as well as the ultimate source of fructose for the growing chain.3,6,61 Due to this relationship with inulin, along with its simplified molecular structure, sucrose was used as a model system to show that 1H NMR spectroscopy is a valuable tool to analyse carbohydrate hydrolysis.
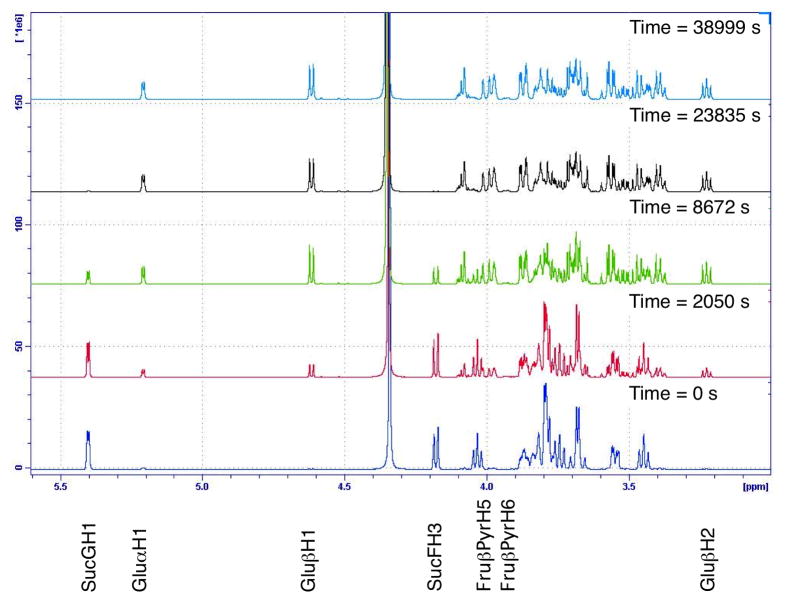
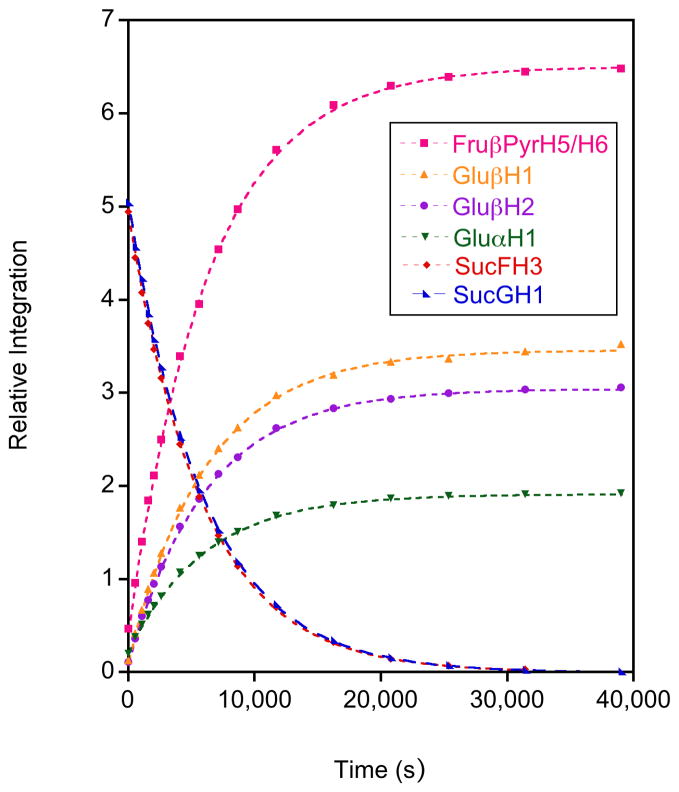
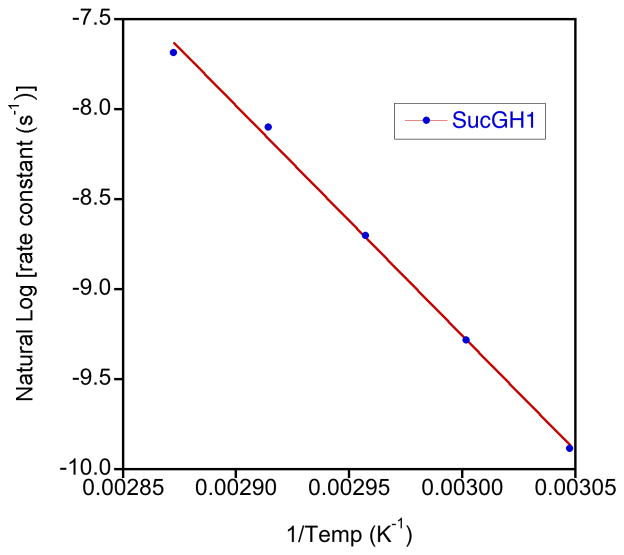
Sucrose hydrolysis was monitored by 1H NMR spectroscopy at five temperatures in 5 °C increments from 55 to 75 °C at a concentration of 25 mg.mL−1. Two resonances for sucrose, those for SucFH3 and SucGH1 (Figures 2 and 3), were used to follow the decrease in sucrose concentration. Three monosaccharide resonances, those for Glu H1, Glu H1 and Glu H2, were used to follow the increase in glucose concentration and one combined peak, which contained resonances for Fru PyrH5 and Fru PyrH6, was used to follow the increase in fructose concentration. Plots of the integration of these resonances (calibrated to the integration of the shift for the methyl group of the acetic acid internal standard) versus time were highly correlated to exponential trend lines, reiterating that this is a pseudo first order process (example plot for all resonances at 65 °C in Figure 4).24,34 This enabled the calculation of values for the rate constant for each temperature from the curve fits generated using Kaleidagraph scientific graphing software. Unsurprisingly, given that a single type of glycosidic bond is cleaved, the consumption of sucrose and the production of both fructose and glucose for the hydrolysis reaction all had closely matching calculated rate constants. The rate constants were used in Arrhenius plots (Figure 5) for each peak analysis from which the average activation energy of 107.0 kJ.mol−1 (s.d. 1.7 kJ.mol−1) was determined for the hydrolysis of sucrose. This activation energy falls within the range of literature values for the hydrolysis of sucrose of between 98 kJ.mol−1 and 119.7 kJ.mol−1.62,63 and agrees well with the results from Tombari et al.64 (109.2 kJ.mol−1 using calorimetry) and Buchanan et al.39 (108.0 kJ.mol−1 using polarimetry). Overall these kinetic results for the hydrolysis of sucrose provide justification that NMR spectroscopy was able to accurately monitor this type of hydrolysis reaction, and would be a valuable tool for the analysis of carbohydrate hydrolysis.
Figure 2.
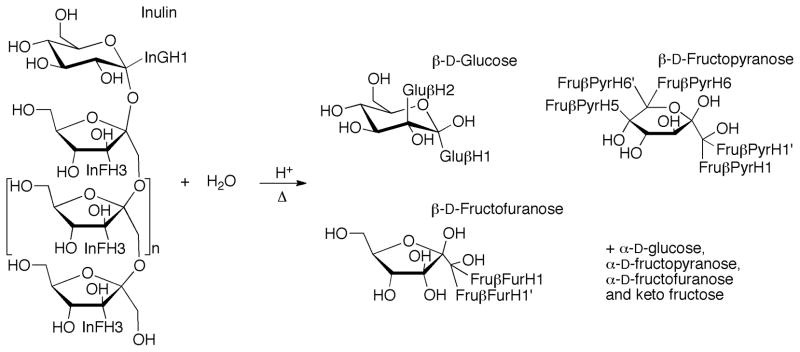
Reaction scheme for the hydrolysis of sucrose
Figure 3.
1H NMR spectra over time of sucrose dissolved in D2O (25 mg.mL−1), acidified with acetic acid (0.25 % v/v) and TFA (0.025 % v/v) and heated to 65 °C.
Figure 4.
Plots of 1H NMR relative integral intensities versus time monitoring the acid hydrolysis at 65 °C of sucrose into glucose and fructose. The trend lines were generated using Kaleidagraph scientific graphing software following an exponential curve fit.
Figure 5.
Example Arrhenius plot for the hydrolysis of sucrose (rate constants derived from concentration measurements calculated from the integrals of the resonance for SucGH1)
2.3 Hydrolysis of Inulin
2.3.1 Hydrolysis of Short Chain Inulin
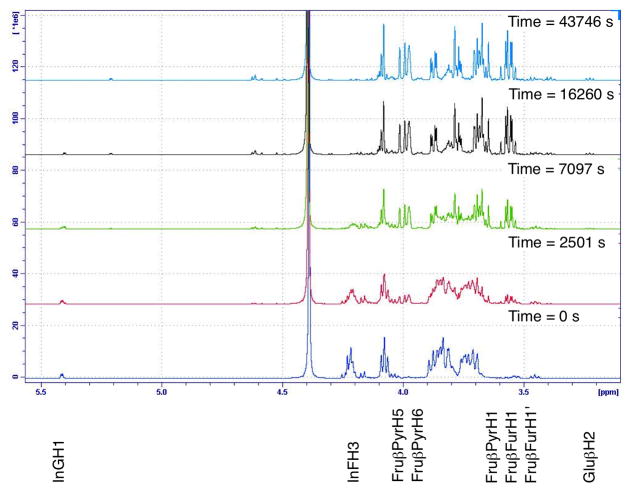
The synthetic short chain inulin is produced enzymatically from sucrose and provides higher water solubility than natural inulins, having shorter and less polydisperse chain lengths.54 It also provides an important structural contrast to the longer chain natural inulin tested here. For example, the short chain species have a relatively larger amount of end groups and a relatively smaller amount of mid-chain glycosidic bonds. There are several differences between the hydrolysis of inulin and sucrose. Firstly, sucrose only has one type of glycosidic bond to hydrolyse, while the hydrolysis of inulin can be represented by at least three different types of glycosidic bonds.65 These types include the glucosyl to fructosyl bond; the fructosyl to fructosyl bonds internal to the polymer chain; and the terminal fructosyl to fructosyl bond. In an attempt to define the differences in hydrolysis between these bond types, the changes in multiple resonances for each experiment were monitored. Generally, these included two that plotted the decrease in inulin concentration, one for the glucosyl group InGH1 and one for the fructosyl components InFH3 (Figure 6 and 7), though at higher temperatures the mobile HDO peak interfered with InFH3 peak. The production of fructose monomers was monitored using the combined peak for the Fru PyrH5 and Fru PyrH6 resonances and the combined peak for the Fru PyrH1 and Fru FurH1+H1′ resonances. The production of glucose monomers was monitored by the growth of the resonance for Glu H2 (Figure 7).
Figure 6.
Reaction scheme for the hydrolysis of inulin
Figure 7.
1H NMR spectra over time of short chain inulin dissolved in D2O (25 mg.mL−1), acidified with acetic acid (0.25 % v/v) and TFA (0.025 % v/v) and heated to 60 °C.
The hydrolysis of both long and short chain inulin polymers was found to have an initially depressed rate of reaction which has been documented previously24,66 and attributed to viscosity and solubility effects.24 Our NMR analysis suggests that a distinct protonation of the glycosidic linkage occurs initially for polysaccharides, illustrated by the shift in the InGH1 resonance at the beginning of the reaction (Figure 1). This affects the initial rate of reaction, by presenting an effectively reduced concentration of bonds that are protonated and able to efficiently undergo hydrolysis.24,34 Once measurements conducted during this initialisation phase are discarded, plots of the change in concentration of inulin, fructose and glucose all follow exponential trend lines and as such the hydrolysis of inulin can be considered first order with respect to inulin concentration, as established previously.24,34
In analysing the hydrolysis results of inulin, it was clear that hydrolytic production of fructose occurred at a much faster rate, on average, than the hydrolytic production of glucose. This was illustrated by rate constant values for the production of fructose, which were 2.9 times greater than those rate constants associated with the formation of glucose monomers. To further evaluate this behaviour the resonances due to InFH3 were investigated. These peaks have been broken up into components identified by Oka et al.43 as belonging to the glucosyl-attached fructosyl group (~4.25 ppm, except for sucrose at 4.17 ppm), the main chain fructosyl groups (~4.20 ppm) and the terminal fructosyl group (~4.15 ppm). While the overlapping nature of these peaks makes definitive quantitative analysis difficult (only one side of the doublets for the glucosyl attached fructosyl and the terminal fructosyl group resonances could be isolated and measured separately over a sufficient range of time), they certainly provide relevant qualitative results.
When an integral of the left side of the glucosyl-attached fructosyl group resonance was expressed as a percentage of the integral for the entire InFH3 region, the result slowly decreased from 3% to 1% over a time frame roughly three half lives of the fructose production reaction (the half-life derived from the equation based on first order kinetics). This showed that the hydrolysis of the glucosyl to fructosyl bond occurred more rapidly than the combined hydrolyses of all types of InFH3 bonds, in apparent contradiction to the previous assertion that the rate of reaction for fructose production was greater than for glucose production. The reason for this is because, while hydrolysis of the glucosyl to fructosyl bond always produces a glucose monomer, cleavages of internal fructosyl to fructosyl bonds do not result in the formation of fructose monomers. The prevalence of hydrolysis of internal fructosyl to fructosyl bonds was illustrated by monitoring the integral of the resonance of the terminal fructosyl to fructosyl bond relative to integral for the entire In FH3 region, which increased from 5% to 16% over the same time frame as observation of the fructosyl to glucosyl bond. The increase in the relative concentration of the terminal fructosyl species suggested that while internal chain scission may have been relatively slow, it was prevalent enough that hydrolysis of the terminal fructose group did not entirely dominate the reaction. This conclusion can be made because all terminal cleavage would produce one terminal group for each cleavage and the relative concentration of the terminal fructosyl to fructosyl bond would remain constant. However, mid-chain cleavage produces two terminal groups for each cleavage and is responsible for the relative increase in the concentration of terminal fructosyl to fructosyl bonds.
Overall, the preceding analyses suggests that the hydrolysis of the fructosyl to fructosyl bonds at the ends of the chains occurs fastest followed by the hydrolysis of the glucosyl to fructosyl bonds with hydrolysis of the internal glycosidic bonds being slowest. An explanation for the relatively slow hydrolysis of the main chain bonds compared to the end groups is that the molecules are more flexible at the end of the chain and more easily undergo the changes in conformation that are part of the hydrolysis process.60,65,67 Previously, the fructosyl to fructosyl bond has been identified as being more labile than the other glycosidic linkages in inulin, calculated to be 4–5 times less resistant to hydrolysis than the glucosyl to fructosyl bond.60 This was for very short chain inulin oligomers (DPn of 2–7) for which the influence of internal bonds was minimised. For inulin having a DPn of ~18 the relative rates of the fructosyl to fructosyl and glucosyl to fructosyl cleavage are more influenced by the slower to react mid-chain bonds, explaining our lower ratio of 2.9.
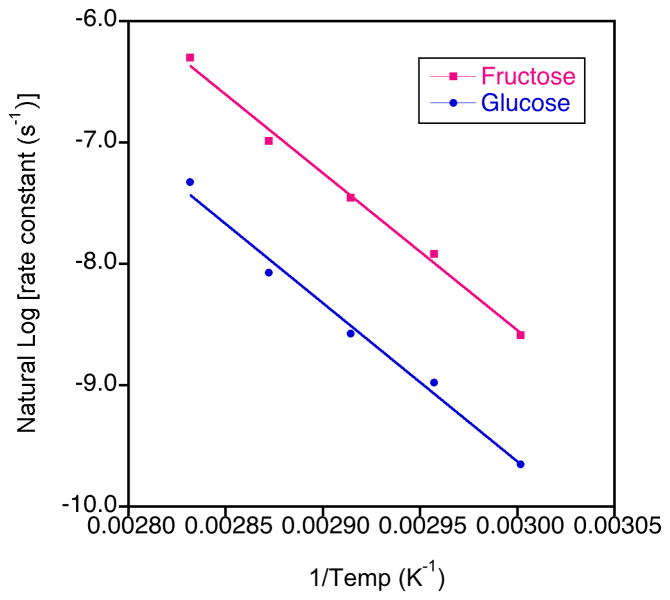
Interestingly, despite the different rate constants for the hydrolytic formation of fructose compared to the hydrolytic formation of glucose, the rate of change of the rate constants with temperature was similar and the activation energies were essentially the same at 107.7 kJ.mol−1 (std. dev. 1.1) and 108.5 kJ.mol−1 (std. dev. 0.60), respectively (Figure 8). These values agree well with that found previously for the hydrolytic formation of fructose for short chain inulin (109±10 kJ.mol−1) measured using chromatography.24 These researchers found that the activation energy for short chain inulin-based oligofructose samples having DPn values from 3–22 units was independent of pH and chain length.24 They also found a close match between the activation energy of short chain inulin samples and sucrose, in accord with our results.
Figure 8.
Example Arrhenius plots for the hydrolysis of short chain inulin (rate constants derived from concentration measurements calculated from the integrals relating to the hydrolytic production of glucose and fructose)
2.3.2 Hydrolysis of Long Chain Inulin
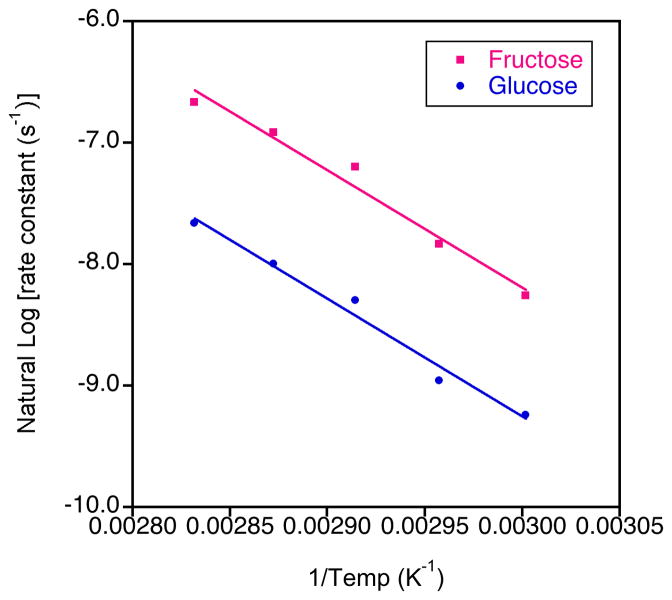
The hydrolysis of long chain inulin followed similar trends to the short chain inulin in most respects, but differed in the kinetics of the hydrolysis reaction. For example, at lower temperatures the rate constant values were lower for short than for long chain inulin, which is in agreement with Heyraud et al.60 who found that rate constants for the cleavage of terminal fructose units generally increase slightly with molecular weight. For the highest temperature (80 °C), however, the rate constants for short chain inulin were higher than those for long chain inulin. This means that the rate of change of rate constants with temperature was different between short and long chain inulin hydrolyses. This variation resulted in a lower activation energy calculated from the rate constants for the hydrolysis of long chain inulin. Hydrolysis of the glucosyl to fructosyl glycosidic bond had an activation energy of 80.5 kJ.mol−1 (s.d. 2.3 kJ.mol−1)while the cleavage of fructose had an activation energy of 80.4 kJ.mol−1 (s.d. 1.0 kJ.mol−1), much lower than those calculated for short chain inulin or sucrose (Figure 9).
Figure 9.
Example Arrhenius plots for the hydrolysis of long chain inulin (rate constants derived from concentration measurements calculated from the integrals relating to the hydrolytic production of glucose and fructose)
The reason for this observation is difficult to determine definitively, but it is clear that the kinetics of hydrolysis for different inulin chain lengths are affected differently by temperature. The evidence that the hydrolysis of the glucosyl to fructosyl glycosidic bond requires less energy for the long chain inulin compared to short chain inulin and sucrose suggests that the conformation of long chain inulin is different in solution than the conformation of short chain inulin. It is possible that long chain inulin holds an ordered structure in solution that alters the geometry of the glycosidic bonds such that hydrolysis is easier at lower temperatures. Concomitantly, the ordered structure also means that at higher temperatures the long chain inulin resists increases in flexibility that otherwise might contribute to increases in the rate constants. Crystalline inulin has a helical structure4,68 and it has previously been shown that solubilised short chain inulin, although it does not have a completely random conformation, is unable to maintain a regular helical structure in solution.69 It seems likely that the longer chains are better able to maintain a helical structure in solution, which could facilitate hydrolysis at lower temperatures while the increased order of the helical structure suppresses hydrolysis at higher temperatures.
2.4 Hydrolysis of other soluble polysaccharides
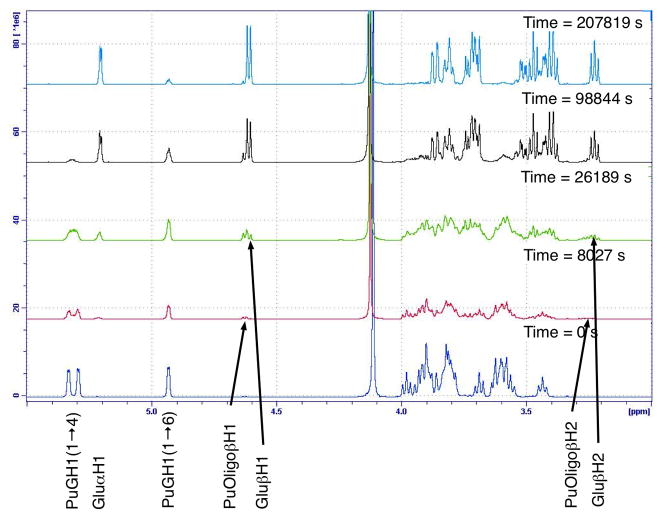
Two other soluble polysaccharides were tested for suitability for analysis of the hydrolysis reaction using 1H NMR spectroscopy. Both pullulan and glycogen had pseudo first order kinetics for the hydrolysis reaction after an initial protonation phase, matching the behaviour of inulin. However, both pullulan and glycogen were hydrolysed much more slowly than inulin despite use of a higher temperature (90 °C) and more strongly acidic conditions (initial pH of 1.8 at 60 °C by using a ten-fold increase in the concentration of TFA). These conditions have been reported as extreme enough to lead to the decomposition of the monomeric species,52 but the protective use of TFA meant that there was no measureable decomposition by the completion of the experiments.33
Pullulan consists of glucose linked together through α-(1→4) glycosidic bonds to form maltotriose subunits, the trisaccharide units then further linked together through α-(1→6) glycosidic bonds creating linear polysaccharide chains. The hydrolysis of the α-(1→4) glycosidic linkages was faster than the hydrolysis of the α-(1→6) glycosidic linkages, as illustrated by the faster disappearance of the resonances attributable to the PuGH1(1→4) than PuGH1(1→6) (Figure 10). Monitoring the increase in the Glu H1 and Glu H2 of reducing ends for glucose or cleaved polymer chains showed that oligomers are initially produced at a faster rate than the monomer glucose units, indicating that mid chain cleavage was significant. Eventually the oligomers were all further hydrolysed to glucose.
Figure 10.
1H NMR spectra over time of pullulan dissolved in D2O (25 mg.mL−1), acidified with acetic acid (0.25 % v/v) and TFA (0.25 % v/v) and heated to 90 °C.
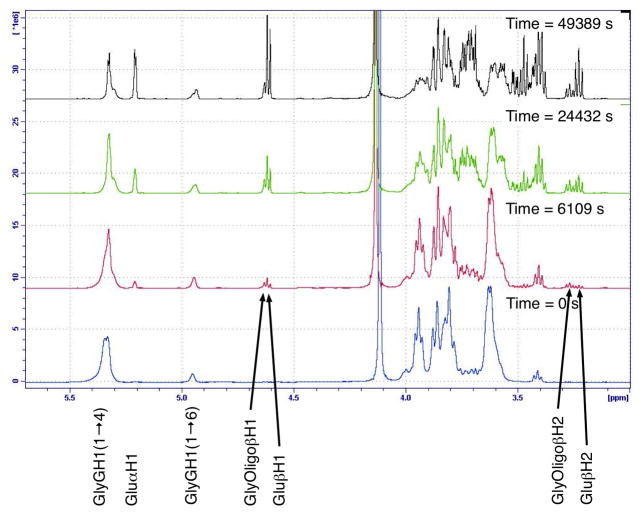
Glycogen has a related molecular structure to pullulan, being a polymer of glucose connected through α-(1→4) and α-(1→6) glycosidic bonds. Glycogen, however, is a branched polymer consisting of linear chains of glucose connected through α-(1→4) glycosidic bonds and branched through α-(1→6) glycosidic linkages. Having similar glycosidic linkages, the hydrolysis of glycogen closely followed the behaviour of pullulan (Figure 11), though the reaction occurred more quickly as the glycogen used (sourced from bovine liver) had much less of the relatively more stable α-(1→6) glycosidic linkages, the polymer being branched approximately every 11 subunits.
Figure 11.
1H NMR spectra over time of glycogen dissolved in D2O (25 mg.mL−1), acidified with acetic acid (0.25 % v/v) and TFA (0.25 % v/v) and heated to 90 °C.
2.5 Conclusion
1H NMR spectroscopy was demonstrated to be useful tool to monitor the hydrolysis of polysaccharides. This technique is suitable for any soluble carbohydrate that provides at least one separated, discrete resonance between the starting material and its hydrolysed products. For insoluble carbohydrates the analysis is complicated, but monitoring the evolution of soluble intermediates and products by taking aliquots, quenching and separating would be sufficient to make conclusions about the kinetics of the reaction. Such a method could also be used to produce samples for analysis for those that do not have direct access to an NMR spectrometer.
All carbohydrates tested in this work (inulin, sucrose, pullulan and glycogen) exhibited pseudo first order kinetics for the hydrolysis reaction, apart from an initiation step attributed to the protonation of the glycosidic linkages of the polymers. The observation of the difference between the kinetic parameters for the hydrolysis of short and long chain inulin suggests that these polysaccharides adopt different conformations in solution.
3. Experimental
3.1 General
The long chain chicory inulin was food grade OraftiInutec® obtained from Orafti Group (Belgium) and the short chain inulin was food grade Fuji FF manufactured by Fuji Nihon Seito Corporation (Japan). Sucrose (≥99.5%), pullulan from Aureobasidiumpullulans, bovine liver glycogen Type IX and trifluoroacetic acid (≥99%)were purchased from Sigma-Aldrich Pty. Ltd. (Australia), acetic acid (analytical reagent) was purchased from Ajax Finechem Pty. Ltd. (Australia) and deuterium oxide (D2O, 99.9%) was obtained from Novachem Pty. Ltd. (Australia). All were used as received.
3.2 NMR
NMR spectra were recorded on a BrukerAvance III 600 operating at 600 MHz for 1H. 1D and 2D spectra were collected using standard gradient-based pulse programs. The 1D 1H NMR data were obtained over 64 scans with a 30° flip angle (90° pulse = 8.4 μs), an acquisition time of 2.7 s, a relaxation delay of 2 s and 65k data points. Temperature was held constant using an in-built heater that was calibrated using ethylene glycol. All experiments were conducted in D2O using carbohydrate concentrations of 12.5 or 25 mg.mL−1 with chemical shifts reported in parts per million (ppm) downfield from 3-(trimethylsilyl)propionic acid sodium salt (TPS) by referencing to the acetic acid internal standard (acetic acid methyl group at 2.08 ppm70). See supplementary data for tables of 1H NMR shifts for each carbohydrate discussed.
3.3 Hydrolysis Studies
3.3.1 Hydrolysis of Sucrose
Sucrose was dissolved in D2O (25 mg.mL−1) at room temperature and then the solution was acidified with acetic acid (0.25% v/v, 44 mM) and trifluoroacetic acid (0.025% v/v, 3.3 mM). This solution was then heated (55, 60, 65, 70, and 75 °C) within the NMR instrument and the hydrolysis was monitored by 1H NMR spectroscopy.
3.3.2 Hydrolysis of Inulin
Inulin was dissolved in D2O (12.5 and 25 mg.mL−1) by heating briefly to 75 °C before cooling to room temperature. The solution was then acidified with acetic acid (0.25% v/v, 44 mM) and trifluoroacetic acid (0.025% v/v, 3.3 mM). Subsequently the acidified solution was then heated (60, 65, 70, 75 and 80 °C) within the NMR instrument and the hydrolysis was monitored by 1H NMR spectroscopy.
3.3.3 Hydrolysis of Pullulan and Glycogen
The polysaccharide was dissolved in D2O (25 mg.mL−1) by heating briefly to 85 °C before cooling to room temperature. The solution was acidified with acetic acid (0.25% v/v, 44 mM) and trifluoroacetic acid (0.25% v/v, 33 mM). This solution was then heated to 90 °C within the NMR instrument and the hydrolysis was monitored by 1H NMR spectroscopy.
Supplementary Material
Highlights.
The kinetics of the hydrolysis of carbohydrates was monitored using 1H NMR spectroscopy
Hydrolysis of all carbohydrates investigated were found to have pseudo first order kinetics
Polysaccharides all exhibited an initiation phase due to the protonation of the glycosidic bond
The chain length of inulin was found to influence kinetics of the hydrolysis
Acknowledgments
This work was supported by the National Institute of Allergy and Infectious Diseases, NIH [Contracts U01-AI061142 and HHSN272200800039C]. Its contents are solely the responsibility of the authors and do not necessarily represent the official views of the National Institutes of Health or the National Institute of Allergy and Infectious Diseases.
This work was also supported by The Australian Research Council through a Linkage Grant [LP0882596] and LIEF grant [LE0668489], the latter used to purchase the NMR spectrometer used in this study.
Footnotes
Publisher's Disclaimer: This is a PDF file of an unedited manuscript that has been accepted for publication. As a service to our customers we are providing this early version of the manuscript. The manuscript will undergo copyediting, typesetting, and review of the resulting proof before it is published in its final citable form. Please note that during the production process errors may be discovered which could affect the content, and all legal disclaimers that apply to the journal pertain.
Contributor Information
Thomas Barclay, Email: thomas.barclay@flinders.edu.au.
Milena Ginic-Markovic, Email: milena.ginic-markovic@flinders.edu.au.
Martin R. Johnston, Email: martin.johnston@flinders.edu.au.
Peter D. Cooper, Email: peter.cooper@anu.edu.au.
Nikolai Petrovsky, Email: nikolai.petrovsky@flinders.edu.au.
References
- 1.Blecker C, Chevalier JP, Van Herck JC, Fougnies C, Deroanne C, Paquot M. Recent Res Devel Agricultural & Food Chem. 2001;5:125–131. [Google Scholar]
- 2.Stevens CV, Meriggi A, Booten K. Biomacromolecules. 2001;2:1–16. doi: 10.1021/bm005642t. [DOI] [PubMed] [Google Scholar]
- 3.Franck A, De Leenheer L. Inulin. In: Steinbuchel A, De Baets S, Vandamme E, editors. Biopolymers, Polysaccharides II: Polysaccharides from Eukaryotes. Vol. 6. Wiley-VCH Verlag GmbH; Berlin: 2002. pp. 439–479. [Google Scholar]
- 4.Andre I, Mazeau K, Tvaroska I, Putaux JL, Winter WT, Taravel FR, Chanzy H. Macromolecules. 1996;29:4626–4635. [Google Scholar]
- 5.Dan A, Ghosh S, Moulik SP. Biopolymers. 2009;91:687–699. doi: 10.1002/bip.21199. [DOI] [PubMed] [Google Scholar]
- 6.French AD. J Plant Physiol. 1989;134:125–136. [Google Scholar]
- 7.Dysseler P, Hoffem D. Determination of Inulin and Oligofructose in Food Products (Modified Aoac Dietry Fibre Method) In: Cho S, Prosky L, Dreher M, editors. Complex Carbohydrates in Food. Marcel Dekker, Inc; New York: 1999. pp. 213–227. [Google Scholar]
- 8.Koch K, Andersson R, Rydberg I, Åman P. J Sci Food Agric. 1999;79:1503–1506. [Google Scholar]
- 9.Barclay T, Ginic-Markovic M, Cooper P, Petrovsky N. J Excipients Food Chem. 2010;1:27–50. [Google Scholar]
- 10.Korbelik M, Cooper PD. Br J Cancer. 2007;96:67–72. doi: 10.1038/sj.bjc.6603508. [DOI] [PMC free article] [PubMed] [Google Scholar]
- 11.Cooper PD, Carter M. Mol Immunol. 1986;23:903–908. doi: 10.1016/0161-5890(86)90076-3. [DOI] [PubMed] [Google Scholar]
- 12.Silva DG, Cooper PD, Petrovsky N. Immunol Cell Biol. 2004;82:611–616. doi: 10.1111/j.1440-1711.2004.01290.x. [DOI] [PubMed] [Google Scholar]
- 13.Cooper PD, Steele EJ. Vaccine. 1991;9:351–357. doi: 10.1016/0264-410x(91)90063-c. [DOI] [PubMed] [Google Scholar]
- 14.Cooper PD, Steele EJ. Immunol Cell Biol. 1988;66:345–352. doi: 10.1038/icb.1988.45. [DOI] [PubMed] [Google Scholar]
- 15.Cooper PD, McComb C, Steele EJ. Vaccine. 1991;9:408–415. doi: 10.1016/0264-410x(91)90127-r. [DOI] [PubMed] [Google Scholar]
- 16.Cooper PD, Petrovsky N. Glycobiology. 2011;21:595–606. doi: 10.1093/glycob/cwq201. [DOI] [PMC free article] [PubMed] [Google Scholar]
- 17.Poulain N, Dez I, Perrio C, Lasne M-C, Prud’homme M-P, Nakache E. J Controlled Release. 2003;92:27–38. doi: 10.1016/s0168-3659(03)00251-7. [DOI] [PubMed] [Google Scholar]
- 18.Castelli F, Sarpietro MG, Micieli D, Ottimo S, Pitarresi G, Tripodo G, Carlisi B, Giammona G. Eur J Pharm Sci. 2008;35:76–85. doi: 10.1016/j.ejps.2008.06.005. [DOI] [PubMed] [Google Scholar]
- 19.Vervoort L, Van den Mooter G, Augustijns P, Busson R, Toppet S, Kinget R. Pharm Res. 1997;14:1730–1737. doi: 10.1023/a:1012179813102. [DOI] [PubMed] [Google Scholar]
- 20.Hinrichs WLJ, Prinsen MG, Frijlink HW. Int J Pharm. 2001;215:163–174. doi: 10.1016/s0378-5173(00)00677-3. [DOI] [PubMed] [Google Scholar]
- 21.Van Drooge DJ, Hinrichs WLJ, Frijlink HW. J Pharm Sci. 2004;93:713–725. doi: 10.1002/jps.10590. [DOI] [PubMed] [Google Scholar]
- 22.Eriksson JHC, Hinrichs WLJ, de Jong GJ, Somsen GW, Frijlink HW. Pharm Res. 2003;20:1437–1443. doi: 10.1023/a:1025762328267. [DOI] [PubMed] [Google Scholar]
- 23.Ronkart SN, Deroanne C, Paquot M, Fougnies C, Blecker CS. Food Chem. 2010;119:317–322. [Google Scholar]
- 24.Blecker C, Fougnies C, Van Herck JC, Chevalier JP, Paquot M. J Agric Food Chem. 2002;50:1602–1607. doi: 10.1021/jf010905b. [DOI] [PubMed] [Google Scholar]
- 25.Coussement P. Inulin and Oligofructose as Dietry Fibre: Analytical, Nutritional and Legal Aspects. In: Sungsoo Cho S, Prosky L, Dreher M, editors. Complex Carbohydrates in Food. Marcel Dekker, Inc; New York: 1999. pp. 203–212. [Google Scholar]
- 26.Roberfroid MB. Br J Nutr. 2005;93:S13–S25. doi: 10.1079/bjn20041350. [DOI] [PubMed] [Google Scholar]
- 27.Vanloo J, Coussement P, Deleenheer L, Hoebregs H, Smits G. Crit Rev Food Sci Nutr. 1995;35:525–552. doi: 10.1080/10408399509527714. [DOI] [PubMed] [Google Scholar]
- 28.Koo HN, Hong SH, Seo HG, Yoo TS, Lee KN, Kim NS, Kim CH, Kim HM. J Nutr Biochem. 2003;14:598–605. doi: 10.1016/j.jnutbio.2003.07.002. [DOI] [PubMed] [Google Scholar]
- 29.Petrovsky N. Vaccine. 2006;24:S26–S29. [Google Scholar]
- 30.Fuchs A. Starch/Stärke. 1987;39:335–343. [Google Scholar]
- 31.Carpita NC, Housley TL, Hendrix JE. Carbohydr Res. 1991;217:127–136. [Google Scholar]
- 32.Matusek A, Meresz P, Le TKD, Oersi F. Eur Food Res Technol. 2009;228:355–365. [Google Scholar]
- 33.Biermann CJ. Adv Carbohydr Chem Biochem. 1988;46:251–271. [Google Scholar]
- 34.L’Homme C, Arbelot M, Puigserver A, Biagini A. J Agric Food Chem. 2003;51:224–228. doi: 10.1021/jf0204699. [DOI] [PubMed] [Google Scholar]
- 35.Nasab EE, Habibi-Rezaei M, Khaki A, Balvardi M. Int J Food Eng. 2009;5:1–10. [Google Scholar]
- 36.BeMiller JN, Steinheimer TR, Allen EE. Clin Chem. 1967;13:261–269. [PubMed] [Google Scholar]
- 37.BeMiller JN. Carbohydr Res. 1972;21:154–155. doi: 10.1016/s0008-6215(00)81741-3. [DOI] [PubMed] [Google Scholar]
- 38.Courtin CM, Van den Broeck H, Delcour JA. J Chromatogr. 2000;866:97–104. doi: 10.1016/s0021-9673(99)01064-x. [DOI] [PubMed] [Google Scholar]
- 39.Buchanan S, Kubler D, Meigs C, Owens M, Tallman A. Int J Chem Kinet. 1983;15:1229–1234. [Google Scholar]
- 40.Yaylayan VA, Ismail AA. J Carbohydr Chem. 1992;11:149–158. [Google Scholar]
- 41.Hyvönen L, Varo P, Koivistoinen P. J Food Sci. 1977;42:657–659. [Google Scholar]
- 42.Morris GA, Hall LD. J Am Chem Soc. 1981;103:4703–4711. [Google Scholar]
- 43.Oka M, Ota N, Mino Y, Iwashita T, Komura H. Chem Pharm Bull (Tokyo) 1992;40:1203–1207. doi: 10.1248/cpb.40.1203. [DOI] [PubMed] [Google Scholar]
- 44.Duker J, Serianni AS. Carbohydr Res. 1993;249:281–303. doi: 10.1016/0008-6215(93)84096-o. [DOI] [PubMed] [Google Scholar]
- 45.Jaseja M, Perlin AS, Dais P. Magn Reson Chem. 1990;28:283–289. [Google Scholar]
- 46.De Bruyn A, Van Loo J. Carbohydr Res. 1991;211:131–136. doi: 10.1016/0008-6215(91)84151-4. [DOI] [PubMed] [Google Scholar]
- 47.Hobley P, Howarth O, Ibbett RN. Magn Reson Chem. 1996;34:755–760. [Google Scholar]
- 48.Lemieux R, Stevens J. Can J Chem. 1966;44:249–262. [Google Scholar]
- 49.Barclay T, Ginic-Markovic M, Johnston MJ, Cooper P, Petrovsky N. Carbohydr Res. 2012;347:136–141. doi: 10.1016/j.carres.2011.11.003. [DOI] [PMC free article] [PubMed] [Google Scholar]
- 50.Cockman M, Kubler DG, Oswald AS, Wilson L. J Carbohydr Chem. 1987;6:181–201. [Google Scholar]
- 51.Shallenberger R. Pure Appl Chem. 1978;50:1409–1420. [Google Scholar]
- 52.Yaylayan VA, Ismail AA, Mandeville S. Carbohydr Res. 1993;248:355–360. [Google Scholar]
- 53.Mega TL, Cortes S, Van Etten RL. J Org Chem. 1990;55:522–528. [Google Scholar]
- 54.Wada T, Ohguchi M, Iwai Y. Biosci, Biotechnol, Biochem. 2003;67:1327–1334. doi: 10.1271/bbb.67.1327. [DOI] [PubMed] [Google Scholar]
- 55.de Graaf RA, Lammers G, Janssen LPBM, Beenackers AACM. Starch/Stärke. 1995;47:469–475. [Google Scholar]
- 56.Honda S. Monosaccharide Analysis by Capillary. In: Thibault P, Honda S, editors. Methods in Molecular Biology: Capillary Electrophoresis of Carbohydrates. Vol. 213. Humana Press Inc; New Jersey: 2003. pp. 79–92. [DOI] [PubMed] [Google Scholar]
- 57.Wrolstad RE, Decker EA, Schwartz SJ, Sporns P. Handbook of Food Analytical Chemistry: Water, Proteins, Enzymes, Lipids and Carbohydrates. John Wiley & Sons; Hoboken: 2004. pp. 721–722. [Google Scholar]
- 58.Wolff D, Czapla S, Heyer AG, Radosta S, Mischnick P, Springer J. Polymer. 2000;41:8009–8016. [Google Scholar]
- 59.Angyal SJ, Pickles V. Aust J Chem. 1972;25:1695–1710. [Google Scholar]
- 60.Heyraud A, Rinaudo M, Taravel FR. Carbohydr Res. 1984;128:311–320. [Google Scholar]
- 61.Wack M, Blaschek W. Carbohydr Res. 2006;341:1147–1153. doi: 10.1016/j.carres.2006.03.034. [DOI] [PubMed] [Google Scholar]
- 62.Miles JJ. J Food Qual. 1995;18:369–378. [Google Scholar]
- 63.Pinheiro Torres A, Oliveira F. J Food Eng. 1999;40:181–188. [Google Scholar]
- 64.Tombari E, Salvetti G, Ferrari C, Johari G. J Phys Chem B. 2007;111:496–501. doi: 10.1021/jp067061p. [DOI] [PubMed] [Google Scholar]
- 65.Moiseev YV, Khalturinskii NA, Zaikov GE. Carbohydr Res. 1976;51:39–54. [Google Scholar]
- 66.Fleming SE, GrootWassink JWD, Murray ED. C R C Crit Rev Food Sci Nutr. 1979;12:1–28. doi: 10.1080/10408397909527271. [DOI] [PubMed] [Google Scholar]
- 67.Edward J. Chem Ind (London) :1102–1104. [Google Scholar]
- 68.André I, Putaux JL, Chanzy H, Taravel FR, Timmermans JW, de Wit D. Int J Biol Macromol. 1996;18:195–204. doi: 10.1016/0141-8130(95)01075-0. [DOI] [PubMed] [Google Scholar]
- 69.Liu JH, Waterhouse AL, Chatterton NJ. J Carbohydr Chem. 1994;13:859–872. [Google Scholar]
- 70.Gottlieb HE, Kotlyar V, Nudelman A. J Org Chem. 1997;62:7512–7515. doi: 10.1021/jo971176v. [DOI] [PubMed] [Google Scholar]
Associated Data
This section collects any data citations, data availability statements, or supplementary materials included in this article.


