Abstract
Several fluorescent proteins (FPs) are prone to forming low affinity oligomers. This undesirable tendency is exacerbated when FPs are confined to membranes or when fused to naturally oligomeric proteins. Oligomerization of FPs limits their suitability for creating fusions with proteins of interest. Unfortunately, no standardized method evaluates the biologically relevant oligomeric state of FPs. Here, we describe a quantitative visual assay for assessing whether FPs are sufficiently monomeric under physiologic conditions. Membrane-associated FP-fusion proteins, by virtue of their constrained planar geometry achieve high effective concentrations. We exploited this propensity to develop an assay to measure FP tendencies to oligomerize in cells. FPs were fused on the cytoplasmic end of an endoplasmic reticulum (ER) signal anchor membrane protein (CytERM) and expressed in cells. Cells were scored based on the ability of CytERM to homo-oligomerize with proteins on apposing membranes and restructure the ER from a tubular network into organized smooth ER (OSER) whorl structures. The ratio of nuclear envelope and OSER structures mean fluorescent intensities for cells expressing EGFP or mGFP CytERM established standards for comparison of uncharacterized FPs. We tested three FPs and identified two as sufficiently monomeric while a third previously reported as monomeric was found to strongly oligomerize.
Keywords: Dimer, Monomer, GFP, Endoplasmic Reticulum, Membrane, Fluorescence
INTRODUCTION
Over the last twenty years, since the cloning and expression of Aequorea victoria green-fluorescent protein (GFP) [1,2], there have been numerous efforts to both improve the spectral and biochemical properties of presently available fluorescent proteins (FPs) and discover new species [3,4]. The goal of bright, photostable, fast folding/maturing, and monomeric FPs has driven protein engineering research to produce the latest generation of FPs [3,5-7].
Selecting monomeric FPs is critical when designing FP-fusion proteins and fluorescence resonance energy transfer (FRET) reporters [4]. Inappropriate interactions [8], organelle reorganization [9], and false-positive FRET measurements [8] are some of the adverse consequences of using nonmonomeric FPs. To maximize FP utility and avoid undesirable artifacts, it is critical to have a reliable means to measure the oligomeric state of a FP under physiologically relevant conditions.
Researchers primarily rely on in vitro methods to assess the oligomeric state of FPs. Traditional in vitro analyses include ultracentrifugation, gel filtration or electrophoresis and structural studies [5,10-12]. These techniques measure the propensity of purified FPs, commonly at non-physiological concentrations, to interact. These methods do not necessarily recapitulate the various conditions FPs encounter when expressed in live cells. Studies of proteins in solution do not account for the effective concentration of a protein in a cell. While one can readily calculate approximately how many FP molecules are expressed per cell, it is a much more difficult task to determine the effective concentration if the protein is attached to or confined to an architecturally convoluted organelle. Furthermore, the same FP may be sufficiently monomeric as a cytoplasmic protein, but could easily form disruptive oligomers when fused to an integral membrane protein. To replicate such conditions and to complement in vitro analyses researchers have supplemented biochemical approaches with yeast-2 hybrid screens and FRET assays [10], to measure oligomerization in vivo. However, no standardized quantitative cell methods exist currently to evaluate the oligomeric state of FPs, especially under conditions where they would be most likely to oligomerize. Towards this end, we have developed an assay that can test the ability of FPs to dimerize in live cells.
The OSER assay exploits the ability of dimerizing FP membrane protein fusions to restructure the ER architecture [9]. The propensity of overexpressed integral membrane proteins to reorganize ER tubules into OSER structures has been described by several groups [13,14]. One mechanism for this process occurs through weakly dimeric FPs, such as EGFP localized to the cytosolic face of the ER membrane, which can interact in an anti-parallel orientation [15] to dynamically bring ER membrane together and drive the restructuring of ER membranes into bright visually distinct OSER structures [9]. Disrupting the dimer inducing hydrophobic interface of GFP [15] with monomerizing mutations (A206K, L221K, F223R) [8] abolishes OSER formation by EGFP [9]. In this study, we exploited this process and quantify the induction of OSER whorls in mammalian cells transiently expressing the cytoplasmically oriented ER Membrane (CytERM) construct fused to a variety of FPs, including EGFP, monomeric GFP (mGFP), superfolder GFP (sfGFP) [5], msfGFP, and TagRFP [16].
RESULTS AND DISCUSSION
Expression of CytERM-EGFP induces ER restructuring
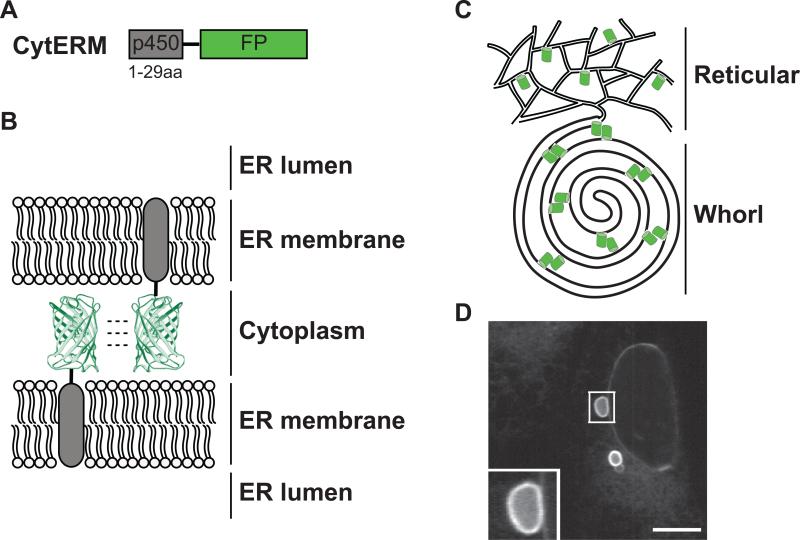
To localize FPs to the cytosolic face of the ER membrane we selected amino acids 1-29 of cytochrome p450 , which is the signal anchor transmembrane domain required to anchor the FP into the ER membrane [9]. FPs were inserted downstream of the p450 transmembrane segment to create the CytERM-FP fusion protein (Fig. 1A). FP dimerization is sufficient to associate apposing ER membranes (Fig. 1B), restructuring the tubular ER network to generate organized smooth ER (OSER) whorl structures (Fig. 1C). CytERM-EGFP when transiently expressed in U2OS cells induces OSER whorl structures; similar structures are seen in cell types including Cos-7 cells [9]. In fluorescent images, whorls appeared as hollow dark structures encircled by bright ER membrane tagged fluorescent edge (Fig. 1D, inset).
Figure 1. Expression of CytERM restructures the ER into OSER through oligomeric interactions of fluorescent proteins.
(A) CytERM, fusion illustration of amino acids 1-29 of cytochrome p450 with fluorescent protein. (B) Model of opposing ER membrane remodeling due to fluorescent protein oligomerization. (C) Illustration depicting reorganization of ER due to fluorescent protein interaction from typical reticular network to OSER whorl. (D) OSER whorl in U2OS cells transiently expressing CytERM-EGFP. Inset of OSER whorl. Scale bar = 10 μm.
Characterization and localization of CytERM-constructs
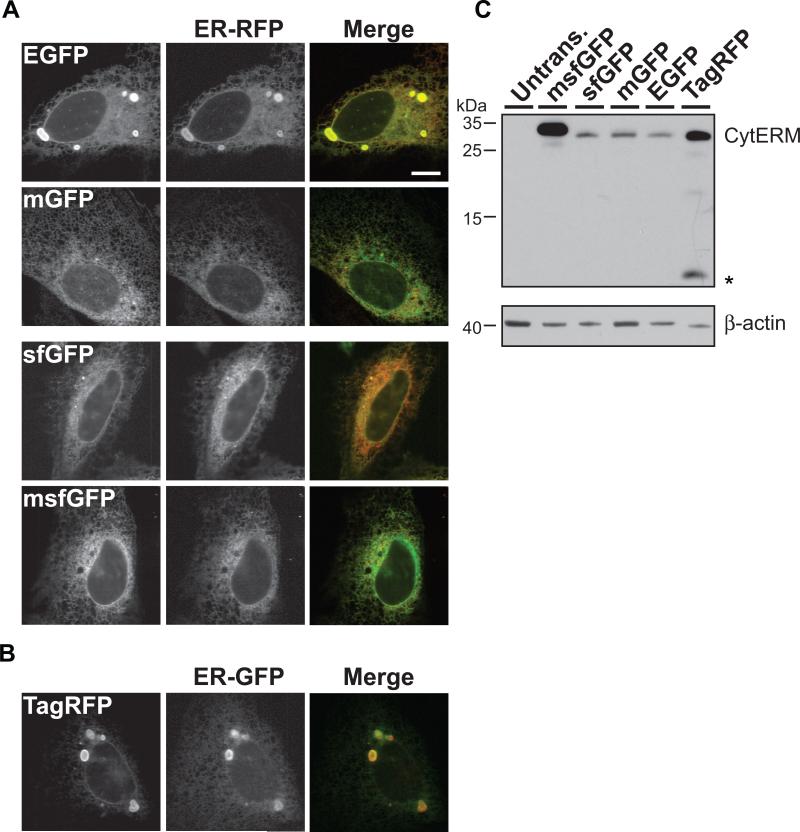
CytERM-EGFP, -mGFP, -sfGFP, -msfGFP and -TagRFP were co-transfected with an inert ER localized reporter (ER-GFP, ER-RFP, respectively) [17,18] to confirm ER localization (Fig. 2A). Immunoblot results with anti-GFP or anti-RFP antibodies established that CytERM fusion proteins migrated to their expected molecular size, ~34 kD, in transiently transfected cells (Fig. 2C). In CytERMEGFP, -TagRFP expressing cells OSER structures are clearly seen in representative cells. However, we sought to obtain a more quantitative means to discriminate propensities of FPs to oligomerize.
Figure 2. Characterization of CytERM.
(A) CytERM-EGFP, -mGFP, -sfGFP, -msfGFP colocalizes with ER-RFP in the ER in co-transfected U2OS cells. (B) CytERM-TagRFP colocalizes with ER-GFP within the ER of co-transfected U2OS cells. Scale bars = 10 μm (C) Immunoblot of cells transfected with CytERM-EGFP, mGFP, sfGFP, msfGFP and TagRFP and stained with anti-GFP or anti-RFP migrate to predicted molecular weights (upper blot). Asterisks (*) indicate TagRFP cleavage product produced during cell lysate preparation. Anti-β-actin stained blot illustrates comparable sample loading (lower blot).
OSER-assay quantification
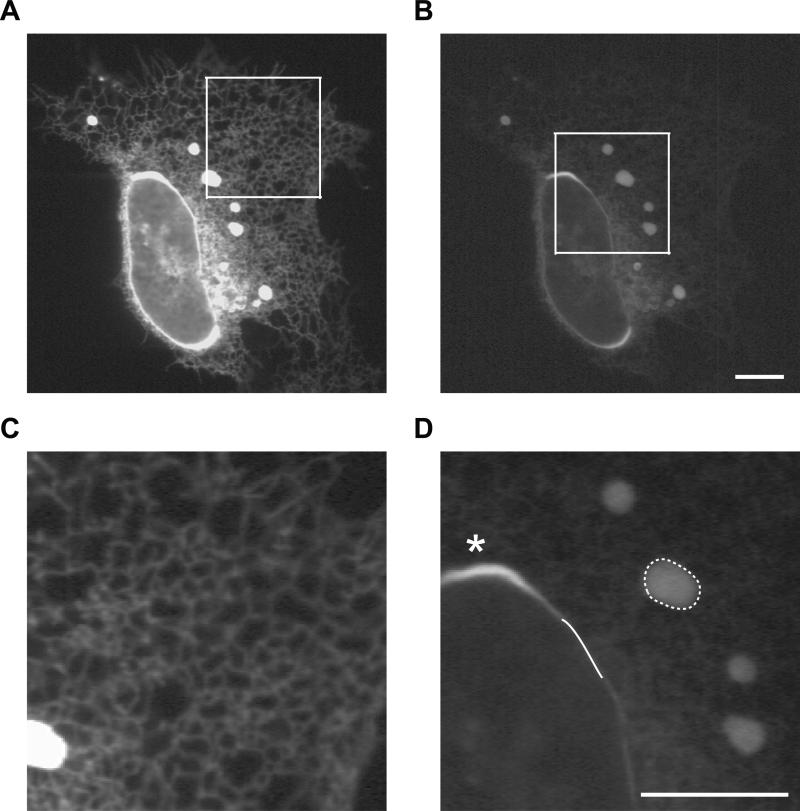
Cells included in OSER assay analysis were first evaluated to eliminate gross over-expression artifacts. Classical ER reticular networks and spheroid nuclei in adherent U2OS culture cells expressing the CytERM-fusion were clearly visible in measured cells (Fig. 3A, B). Imaging of single cells permitted discrimination between moderate and highly over-expressing cells. Multi-lobed nuclei (Supp. Fig. 1D), high levels of ER sheet architecture (Supp. Fig. 1C, arrows) [19] and condensed cells (Supp. Fig. 1B), which a r e morphologies consistent with highly stressed or unhealthy cells, were also excluded from the OSER assay quantitation.
Figure 3. Cell selection criteria and manual measurement practice for OSER assay.
(A) Representative image depicting selection criteria of OSER assay. CytERM-EGFP expressing U2OS cells with reticular ER network characteristic of cells selected for analysis. (B) Zoomed inset of (A). (C) OSER whorl structures are induced in cells expressing CytERM-EGFP. (D) Inset of (C) represents the manual tracing of OSER whorl (dotted line) and nuclear envelope MFI measurements (solid line) required for quantitative analysis. Asterisks (*) highlight a region of the nuclear envelop excluded from analysis. Scale bars = 10 μm.
The remaining cells were analyzed using ImageJ software. Structures were manually traced using the freehand selection tool (Fig. 3D, dashed-white circle) and the mean fluorescent intensities (MFI) were recorded for selected areas. Nuclear envelope (NE) MFI was measured using the line tracing tool; a single nucleus was manually traced in three separate regions, an example of a single trace is depicted in Figure 3D as a white line. The three NE MFI values were averaged for an individual cell. Areas of the nucleus with OSER karmellae [20] were excluded from NE selections (Fig. 3D asterisks, Supp. Fig. 1A arrowhead).
In the OSER assay, all structures visibly distinct from the ER reticular networks were included in measurements. Fluorescent microscopy lacks sufficient resolution to visually distinguish the regular membrane structures of OSER whorls from disorganized anastomosing ER [18]. Inclusion of all discernible non-reticular structures circumvents issues of operator bias during data collection.
To enhance the general utility of the OSER assay, we included ratiometric analysis to evaluate monomeric verses oligomeric FPs. Rather than using absolute MFI values, the ratio of structure MFI: NE MFI was calculated. This ratio permits comparison of FPs with different spectral characteristics. For example, data collection for a green and red FP or FPs with different relative brightnesses requires distinctive imaging parameters: excitation wavelength, filter sets and exposure times. Without a mechanism for normalizing values these differences would prevent meaningful comparison between FPs.
OSER assay method validation
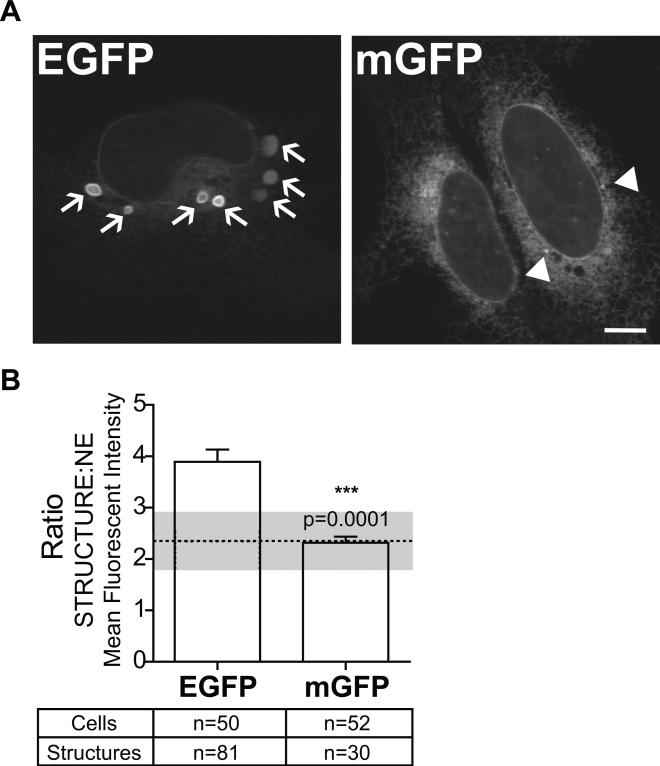
To establish the OSER method, our first efforts were to validate the method by comparing a known dimer forming FP, EGFP with monomeric mGFP (EGFP with L221K mutation). U2OS cells transiently expressing CytERM-EGFP or CytERM-mGFP were imaged (Fig. 4A) and analyzed. Arrows indicate OSER whorl structures. Structures denoted by arrowheads in CytERM-mGFP expressing cells indicate non-OSER whorl structures (Fig. 4A). Analysis of CytERM-mGFP expressing cells established a monomeric threshold value of 2.3±0.6 based on the ratio of structure MFI: NE MFI. This value will be comparatively used to discriminate between monomeric, FPs (a ratio ≤ 2.3±0.6) and oligomeric FPs (ratios > than 2.3±0.6).
Figure 4. Analysis of CytERM-EGFP and -mGFP validates the methodology of OSER assay.
(A) CytERM-EGFP induced OSER whorl structures in transiently expressed in U2OS cells (arrows highlight OSER whorls). CytERM-mGFP expression produces structures that are not OSER whorls (arrowheads highlight non-OSER structures). All structures are manually traced during analysis. Scale bar = 10 μm. (B) OSER assay ratiometric measurements of structures:nuclear envelope MFI, values presented as mean±SEM. Dotted line indicates monomeric threshold of fluorescent proteins, 2.3 ± 0.1.
Measuring oligomeric tendencies of superfolder GFP and TagRFP
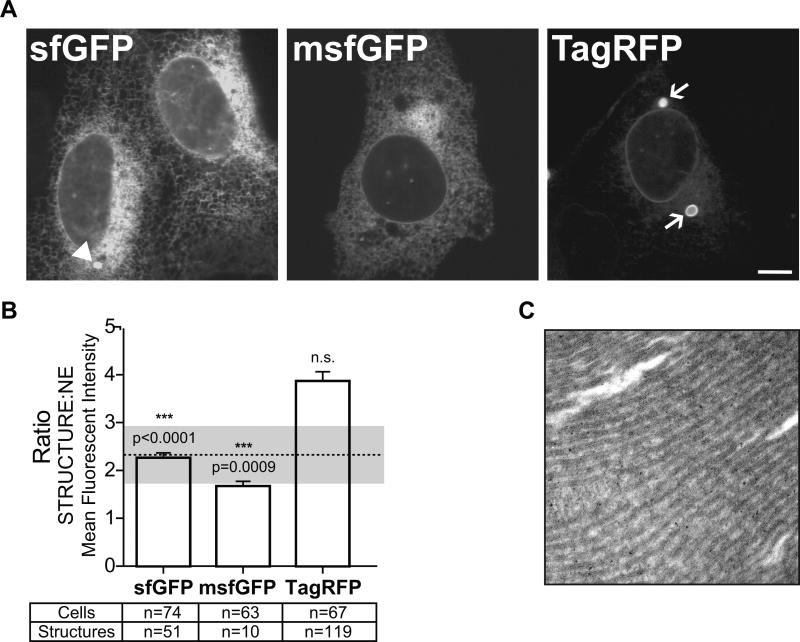
The monomeric threshold established in the validation step was compared to the new FPs we examined: sfGFP, msfGFP and TagRFP, which have been reported as monomeric. Previous reports conclude based on crystallization data and inferences of the A206V substitution sfGFP exists as a monomer [5]. Data has also shown TagRFP to be monomer as determined by gel filtration and electrophoresis measurements [16,21]. However, based on its crystal structure, TagRFP oligomerizes under high protein concentrations [7].
U2OS cells transiently expressing CytERM-sfGFP, -msfGPF or -TagRFP were imaged (Fig. 5A) and analyzed. Structures denoted by arrowheads in CytERM-sfGFP expressing cells indicate non-OSER structures as confirmed by electron microscopy (data not shown). The average structure MFI: NE MFI of sfGFP and msfGFP was compared to the monomeric threshold. By OSER assay standards sfGPF and msfGFP data values fall below the monomer threshold (Fig. 5B), confirming previous findings that sfGFP is also monomeric in live cells.
Figure 5. Application of OSER assay to uncharacterized sfGFP, monomerized sfGFP and TagRFP reveal sfGFPs as monomer as determined by CytERM-mGFP threshold value.
(A) U2OS cells transiently expressing CytERM-sfGFP, -msfGFP or -TagRFP. CytERM-sfGFP expressing cells contain non-OSER whorl structures (arrow head). CytERM-TagRFP transfected cells produce OSER whorls as indicated by arrows. Scale bar = 10 μm. (B) Ratio values presented as mean ± SEM of CytERM-sfGFP, -msfGFP and -TagRFP (structure:nuclear envelope MFI). Dotted line indicates monomeric threshold of fluorescent proteins, 2.3 ± 0.1. CytERM-sfGFP, -msfGFP fall below the monomeric threshold and are statistically significantly different (p<0.0001, 0.0009 respectively), indicating both FPs are monomeric by these measurements. CytERM-TagRFP ratio measurement, 3.9 ± 0.2, is not statistically different from CytERM-dGFP ratio measurements (3.9 ± 0.2). (C) Electron micrograph image of U2OS cells transiently expressing CytERM-TagRFP, showing representative stacked ER membrane characteristic of OSER structures.
OSER analysis contradicts the original TagRFP report, but agrees with a more recent analysis [7]. As indicated by arrows in the TagRFP panel OSER structures form in CytERM-TagRFP expressing cells (Fig. 5A, arrows). Electron microscopy images confirm these structures as true OSER whorls (Fig. 5C) Quantitative analysis finds CytERM-TagRFP expressing cells have an average structure MFI: NE MFI almost two times greater than the monomeric threshold (Fig. 5B). In fact, TagRFP is even more prone to OSER formation than EGFP. Thus, TagRFP is not suitable for integral membrane protein fusions or inherently oligomeric protein fusions and should be used with caution for any fusion protein.
Analyses of the quantifiable properties of OSER whorl structures
To further distinguish OSER whorls from non-OSER structures, we examined additional quantifiable properties of ER structures. Structure size and the number of structures per cell were analyzed (Supp. Fig. 2). The obtained values followed the same trend observed for the measurements of fluorescence intensity ratios. EGFP and TagRFP OSER have notably larger average structure areas (Supp. Fig. 2A), 8.7±1.2 μm2 and 6.0±0.5 μm2, respectively, and a significantly greater number of structures per cell, ≥2.4, as compared with mGFP, sfGFP and msfGFP (Supp. Fig. 2B). These data provide additional evidence that oligomerizing FP OSER structures are quantitatively distinct from monomeric FP structures.
Additionally, we report the average nuclear envelope MFI of cells containing structures (open circles) compared to cells lacking (closed circles) revealed another significant difference between cells expressing CytERM-EGFP or -TagRFP and those expressing -mGFP, -sfGFP or -msfGFP (Supp. Fig. 3). Cells expressing CytERM-EGFP or -TagRFP containing structures have a significantly higher NE MFI than cells with no structures. Our data are consistent with previous findings that established a threshold level of FP construct expression robustly correlated with the formation of OSER [18]. The propensity of CytERM-TagRFP to form OSER also exhibited an expression level dependence that follows the same trend as EGFP. However, MFI proved to be too arbitrary of a parameter for robust comparative analyses.
Conclusions
The OSER assay represents a novel and valuable tool for determining the tendency for FPs to form oligomers under physiologically relevant conditions. Importantly, the minimal requirement for supplies and equipment, typically available at most institutions, makes the OSER assay practical for most investigators. The assay can be recapitulated and implemented with other transfectable adherent cell culture cells, the CytERM construct fusion to the FP in question, and the proper imaging equipment setup and software. A parameter worth briefly discussing is the choice of cell lines. Any cell line can conceivably be used for the assay. However, cells need to be readily transfectable and have a modest to large ER. In addition, the assay is optimal with acute high levels of FP expression. Evaluation of FP effects on OSER formation with inducible cell lines or stably transfected cells is possible, but often requires evaluation of a much larger sampling of cells. While OSER formation has been shown to be dependent on expressed levels of protein, screening is easiest when most cells are expressing and a range of expression levels can be observed. One might be tempted to conclude that the high levels of acute CytERM expression required for OSER formation suggest that FP oligomerization represents a rare or extreme phenomenon. However, it is important to remember that the OSER assay is a visual assay for FP oligomerization. The false positive FRET signal that oligomerizing proteins can generate [8] can occur at even low FP expression levels, but the role of FP oligomerization is not easily discerned.
The OSER assay, at this time is not a high throughput means of analysis and contains a time consuming manual tracing data processing step. However, efforts to automate the manual data collection could further increase the efficiency of this analysis.
For our objectives this assay was utilized to examine the oligomeric state of FPs. However, one could imagine using the same principle to study additional weak and reversible protein-protein interactions. The remodeling of the ER network of tubules into OSER structures is a dynamic process. Protein dynamics studies established that OSER-inducing FP interactions remain transient and dynamic throughout the ER [9]. Thus, OSER formation is not due to static dimerization events and could be sensitive enough to measure formation of transient oligomers. Creating fusions of the known monomeric, CytERM-msfGFP construct with proteins of interest would provide a visible measure to assess protein-protein interactions. A positive protein-protein interaction would, in theory, promote OSER structure formation. Under these conditions, OSER would be visible due to the msfGFP fluorescence, but the protein-protein interaction, not the FP-interactions, would generate structure formation.
Materials and Methods
Mammalian plasmid
EGFP and mGFP (L221K) CytERM constructs have been previously described [9]. Briefly, to construct C1 (1-29)P450 GFP C1 [22], the transmembrane domain (amino acids 1-29) of cytochrome P450 was cloned into the EGFP N1 vector (Clontech, Palo Alto, CA) with BglII/HindIII restriction sites. sfGFP, msfGFP (V206K) and TagRFP were inserted downstream of the P450 transmembrane signal anchor domain (amino acids1-29) at AgeI/NotI sites. Site-directed mutagenesis with primers Forward 5' CCTGAGCACCCAGTCCAAGCTTAGCAAAGACCCC AACG 3'
Reverse 5' CGTTGGGGTCTTTGCTAAGCTTGGACTGGGTGCT CAGG 3' created msfGFP (V206K). ER-GFP and ER-RFP constructs have been previously described [9,18]. All constructs were confirmed by sequencing. CytERM ER localization was confirmed via co-transfection with ER-GFP or ER-RFP.
Cell culture and transfection
U2OS cells were routinely cultured in RPMI medium (Mediatech, Manassas, VA), supplemented with 5 mM glutamine, penicillin/streptomycin (Invitrogen, Carlsbad, CA), and 10% heat inactivated fetal bovine serum (Hyclone from Thermo Scientific, Rockford, IL) at 37°C in 5% CO2. For imaging experiments, cells were grown in 8 well LabTek coverglass chambers (Nunc, Rochester, NY). All constructs were transiently transfected for 16-20 hours into cells using Lipofectamine 2000 (Invitrogen) according to the manufacturer's instructions.
Live cell fluorescence imaging
Cells were imaged in phenol red-free RPMI supplemented with 10 mM Hepes (Fisher, and 10% fetal bovine serum. Live cells were imaged on a 37°C environmentally controlled chamber of a confocal microscope system (Zeiss LSM 5 LIVE microscope with Duoscan attachment; Carl Zeiss MicroImaging, Inc., Thornwood, NY.) with a 63X/1.4 NA oil objective and a 489 nm 100mW diode laser with a 495-555 and 520-555 nm bandpass filter for GFP and a 40mW 561 nm diode laser with a 575-615 nm bandpass and 655 nm longpass filter for TagRFP. For quantitative analyses, dual images were acquired for each field of view to capture both the lower fluorescence intensity ER tubular network and the high intensity OSER structures, setting were determined using software's range indicators and selecting intensity settings below maximum pixel intensity value for each structure respectively. Composite figures were prepared using ImageJ (National Institutes of Health), Photoshop CS4 and Illustrator CS4 software (Adobe Systems, San Jose, CA).
Immunoblots
Total cell lysates for immunoblotting were prepared in 1% SDS, 0.1 M Tris, pH 8.0 using cells in 24 well plates at 80-90% confluence. Proteins were separated using 12% Tris-tricine gels, transferred to nitrocellulose, probed with the indicated antibodies, and developed using enhanced chemiluminescent reagents (Pierce, Rockford, IL), and exposed to X-ray film. Antibodies used included anti-GFP and anti-RFP (generous gifts from Ramanujan S. Hegde, Laboratory of Molecular Biology, Cambridge, UK), anti-β actin (Sigma Aldrich, St. Louis, MO) and horseradish peroxidase-labeled anti-mouse or anti-rabbit (Jackson Immunoresearch Laboratories, West Grove, PA).
Electron microscopy
Cells were fixed for 30 minutes in 2% glutaraldehyde in 0.1 M cacodylate buffer, pH 7.4. After fixation cells were scraped to detach, pelleted and resuspended in fresh fixative and incubated at 4°C overnight. Fixed cells were further treated with osmium tetroxide and embedded in epon by standard procedures. Lead citrate stained thin (65 nm) sections were observed under a CM10 (Philips) transmission electron microscope [9].
Statistical analysis
To minimize the inconsistencies of cell-to-cell variation, we selected flat, mono-nucleate, nonmitotic cells with a normal ER reticular tubular network in cultures between 50% and 70% confluence for analysis. We used a two-tailed Student's t-test with Prism software (GraphPad Software, San Diego, CA) to compare the different conditions. Variances of data sets were compared using an F-test (GraphPad) to establish whether to use equal or nonequal variance t-tests.
Supplementary Material
Supporting Information
Supplemental Figure 1: OSER assay exclusion criteria for analyzed cells.
During nuclear envelope manual tracing for MFI measurements, (A) karmellae structures were excluded from traceable region (arrowhead). During analysis, condensed cell lacking defined nuclei (B), cells with changes in ER network morphology to primarily sheeted ER (arrow) (C), or with lobed nuclei (D) were excluded from measurements. Scale bars = 10 μm.
Supplemental Figure 2: Comparison of additional OSER assay parameters.
(A) The measured area of each structure, as determined by manual tracing. (B) Average number of structures per cell.
Supplemental Figure 3: Relative expression level CytERM-fusion protein in cells correlates with OSER formation in CytERM-EGFP and -TagRFP expressing cells.
The relative NE MFI of cells containing measureable structures and cells lacking when transiently expressing the respective CytERM-fusion: (A) EGFP, (B) mGFP, (C) sfGFP, (D) msfGFP and (E) TagRFP.
Acknowledgments
We thank Dr. Ramanujan S. Hegde (National Institutes of Health, NIH) for the anti-GFP and RFP antibodies. We thank the Einstein Analytical Imaging Facility for use of the Zeiss Duoscan. This work was supported by grants from the National Institute of General Medical Sciences (NIGMS) (R01GM086530- 01) (E.L.S.), National Institute of Diabetes and Digestive and Kidney Diseases NIDDK (5PO1DK041918) (E.L.S), and NIH Training Program in Cellular and Molecular Biology and Genetics Grant T32 GM007491 (L.M.C.). The content is solely the responsibility of the authors and does not necessarily represent the official views of the NIGMS or the NIH. E.L.S. and L.M.C conceived and designed the study. L.M.C, M.F., M.F. performed the experiments. L.M.C and E.L.S analyzed the data and wrote the manuscript. The authors declare no competing financial interests.
List of Abbreviations
- CytERM
Cytoplasmic oriented Endoplasmic Reticulum Membrane reporter
- EGFP
Enhanced Green Fluorescent Protein
- ER
Endoplasmic Reticulum
- FP
Fluorescent Protein
- FRET
Fluorescence Resonance Energy Transfer
- mGFP
Monomeric Green Fluorescent protein
- NE
Nuclear Envelope
- OSER
Organized Smooth Endoplasmic Reticulum
- sfGFP
Superfolder Green Fluorescent Protein
References
- 1.Heim R, Prasher DC, Tsien RY. Wavelength mutations and posttranslational autoxidation of green fluorescent protein. Proc Natl Acad Sci. 1994;91:12501–4. doi: 10.1073/pnas.91.26.12501. [DOI] [PMC free article] [PubMed] [Google Scholar]
- 2.Prasher DC, Eckenrode VK, Ward WW, Prendergast FG, Cormier MJ. Primary structure of the Aequorea victoria green-fluorescent protein. Gene. 1992;111:229–233. doi: 10.1016/0378-1119(92)90691-h. [DOI] [PubMed] [Google Scholar]
- 3.Shaner NC, Patterson GH, Davidson MW. Advances in fluorescent protein technology. J Cell Sci. 2007;120:4247–60. doi: 10.1242/jcs.005801. [DOI] [PubMed] [Google Scholar]
- 4.Snapp EL. Fluorescent proteins: a cell biologist's user guide. Trends in Cell Biol. 2009;19:649–55. doi: 10.1016/j.tcb.2009.08.002. [DOI] [PMC free article] [PubMed] [Google Scholar]
- 5.Pédelacq J-D, Cabantous S, Tran T, Terwilliger TC, Waldo GS. Engineering and characterization of a superfolder green fluorescent protein. Nat Biotechnol. 2006;24:79–88. doi: 10.1038/nbt1172. [DOI] [PubMed] [Google Scholar]
- 6.Rizzo M a, Springer GH, Granada B, Piston DW. An improved cyan fluorescent protein variant useful for FRET. Nat Biotechnol. 2004;22:445–9. doi: 10.1038/nbt945. [DOI] [PubMed] [Google Scholar]
- 7.Subach OM, Malashkevich VN, Zencheck WD, Morozova KS, Piatkevich KD, Almo SC, Verkhusha VV. Structural characterization of acylimine-containing blue and red chromophores in mTagBFP and TagRFP fluorescent proteins. Chem Biol. 2010;17:333–41. doi: 10.1016/j.chembiol.2010.03.005. [DOI] [PMC free article] [PubMed] [Google Scholar]
- 8.Zacharias D a, Violin JD, Newton AC, Tsien RY. Partitioning of lipid-modified monomeric GFPs into membrane microdomains of live cells. Science. 2002;296:913–6. doi: 10.1126/science.1068539. [DOI] [PubMed] [Google Scholar]
- 9.Snapp EL, Hegde RS, Francolini M, Lombardo F, Colombo S, Pedrazzini E, Borgese N, Lippincott-Schwartz J. Formation of stacked ER cisternae by low affinity protein interactions. J Cell Biol. 2003;163:257–69. doi: 10.1083/jcb.200306020. [DOI] [PMC free article] [PubMed] [Google Scholar]
- 10.Baird GS, Zacharias D a, Tsien RY. Biochemistry, mutagenesis, and oligomerization of DsRed, a red fluorescent protein from coral. Proc Natl Acad Sci. 2000;97:11984–9. doi: 10.1073/pnas.97.22.11984. [DOI] [PMC free article] [PubMed] [Google Scholar]
- 11.Laue TM, Stafford WF. Modern applications of analytical ultracentrifugation. Annu Rev Biophys Biomol Struct. 1999;28:75–100. doi: 10.1146/annurev.biophys.28.1.75. [DOI] [PubMed] [Google Scholar]
- 12.Gurskaya N. GFP-like chromoproteins as a source of far-red fluorescent proteins. FEBS Lett. 2001;507:16–20. doi: 10.1016/s0014-5793(01)02930-1. [DOI] [PubMed] [Google Scholar]
- 13.Almsherqi ZA, Kohlwein SD, Deng Y. Cubic membranes: a legend beyond the Flatland* of cell membrane organization. J Cell Biol. 2006;173:839–44. doi: 10.1083/jcb.200603055. [DOI] [PMC free article] [PubMed] [Google Scholar]
- 14.Landh T. From entangled membranes to eclectic morphologies: cubic membranes as subcellular space organizers. FEBS Lett. 1995;369:13–17. doi: 10.1016/0014-5793(95)00660-2. [DOI] [PubMed] [Google Scholar]
- 15.Yang F, Moss LG, Phillips GN., Jr The molecular structure of green fluorescent protein. Nat Biotechnol. 1996;14:1246–1251. doi: 10.1038/nbt1096-1246. others. [DOI] [PubMed] [Google Scholar]
- 16.Merzlyak EM, Goedhart J, Shcherbo D, Bulina ME, Shcheglov AS, Fradkov AF, Gaintzeva A, Lukyanov KA, Lukyanov S, Gadella TWJ. Bright monomeric red fluorescent protein with an extended fluorescence lifetime. Nat Methods. 2007;4:555–557. doi: 10.1038/nmeth1062. others. [DOI] [PubMed] [Google Scholar]
- 17.Dayel MJ, Hom EF, Verkman a S. Diffusion of green fluorescent protein in the aqueous-phase lumen of endoplasmic reticulum. Biophys J. 1999;76:2843–51. doi: 10.1016/S0006-3495(99)77438-2. [DOI] [PMC free article] [PubMed] [Google Scholar]
- 18.Snapp EL, Sharma A, Lippincott-Schwartz J, Hegde RS. Monitoring chaperone engagement of substrates in the endoplasmic reticulum of live cells. Proc Natl Acad Sci. 2006;103:6536–41. doi: 10.1073/pnas.0510657103. [DOI] [PMC free article] [PubMed] [Google Scholar]
- 19.Voeltz GK, Prinz WA, Shibata Y, Rist JM, Rapoport TA. A class of membrane proteins shaping the tubular endoplasmic reticulum. Cell. 2006;124:573–86. doi: 10.1016/j.cell.2005.11.047. [DOI] [PubMed] [Google Scholar]
- 20.Wright R, Basson M, D'Ari L, Rine J. Increased amounts of HMG-CoA reductase induce “karmellae”: a proliferation of stacked membrane pairs surrounding the yeast nucleus. J Cell Biol. 1988;107:101–14. doi: 10.1083/jcb.107.1.101. [DOI] [PMC free article] [PubMed] [Google Scholar]
- 21.Subach OM, Gundorov IS, Yoshimura M, Subach FV, Zhang J, Grüenwald D, Souslova E a, Chudakov DM, Verkhusha VV. Conversion of red fluorescent protein into a bright blue probe. Chem Biol. 2008;15:1116–24. doi: 10.1016/j.chembiol.2008.08.006. [DOI] [PMC free article] [PubMed] [Google Scholar]
- 22.Szczesna-Skorupa E, Chen CD, Rogers S, Kemper B. Mobility of cytochrome P450 in the endoplasmic reticulum membrane. Proc Natl Acad Sci. 1998;95:14793–8. doi: 10.1073/pnas.95.25.14793. [DOI] [PMC free article] [PubMed] [Google Scholar]
Associated Data
This section collects any data citations, data availability statements, or supplementary materials included in this article.
Supplementary Materials
Supporting Information
Supplemental Figure 1: OSER assay exclusion criteria for analyzed cells.
During nuclear envelope manual tracing for MFI measurements, (A) karmellae structures were excluded from traceable region (arrowhead). During analysis, condensed cell lacking defined nuclei (B), cells with changes in ER network morphology to primarily sheeted ER (arrow) (C), or with lobed nuclei (D) were excluded from measurements. Scale bars = 10 μm.
Supplemental Figure 2: Comparison of additional OSER assay parameters.
(A) The measured area of each structure, as determined by manual tracing. (B) Average number of structures per cell.
Supplemental Figure 3: Relative expression level CytERM-fusion protein in cells correlates with OSER formation in CytERM-EGFP and -TagRFP expressing cells.
The relative NE MFI of cells containing measureable structures and cells lacking when transiently expressing the respective CytERM-fusion: (A) EGFP, (B) mGFP, (C) sfGFP, (D) msfGFP and (E) TagRFP.


