

Abstract
A number of factors have been identified that increase the risk of HCC. Recently it has become appreciated that type II diabetes increases the risk of developing HCC. This represents a patient population that can be identified and targeted for cancer prevention. The biguanide metformin is a first line therapy for the treatment of type II diabetes where it exerts its effects primarily on the liver. A role of metformin in HCC is suggested by studies linking metformin intake for control of diabetes with a reduced risk of HCC. While a number of preclinical studies demonstrate the anticancer properties of metformin in a number of tissues, no studies have directly examined the effect of metformin on preventing carcinogenesis in the liver, one of its main sites of action. We show in these studies that metformin protected mice against chemically induced liver tumors. Interestingly, metformin did not increase AMPK activation, often shown to be a metformin target. Rather metformin decreased the expression of several lipogenic enzymes and lipogenesis. Additionally, restoring lipogenic gene expression by ectopic expression of the lipogenic transcription factor SREBP1c rescues metformin mediated growth inhibition. This mechanism of action suggests that metformin may also be useful for patients with other disorders associated with HCC where increased lipid synthesis is observed. As a whole these studies demonstrate that metformin prevents HCC and that metformin should be evaluated as a preventive agent for HCC in readily identifiable at risk patients.
Keywords: Metformin, HCC, Tumor growth, lipogenesis, chemoprevention
Introduction
Primary liver cancer is the fifth most common cancer and has the third highest rate of mortality worldwide. Hepatocellular carcinoma (HCC) represents ~85% of all primary liver cancer. Although the incidence of some cancers is declining, incidences of HCC are increasing worldwide (1, 2). Even in the United States it is the fastest growing cause of cancer related deaths in men (1, 3). Overall 5-year survival is less than 15%, and for patients with advanced stage disease, 5-year survival is less than 2% (4). Therefore identification and chemopreventive intervention of patients at risk for HCC represents one of the best strategies for reducing morbidity and mortality from this cancer.
A number of risk factors have been identified that increase the risk of HCC. Hepatitis B virus (HBV) and hepatitis C virus (HCV) represent the most significant risk factors for HCC (5). However, epidemiological evidence demonstrates an increasing role for diabetes in the development of HCC. Patients with type II diabetes have a 2-3 fold increased relative risk of HCC (3, 6, 7). Furthermore the comorbidities of obesity and diabetes are reported to account for 37% of HCC cases in patients without HBC or HCV infection (8). Several studies have demonstrated an increase in HCC in rodent models of diabetes illustrating a more direct link between diabetes and HCC (9-11). Therefore diabetics represent a patient population at risk for HCC that can readily be identified.
Metformin is a biguanide that has been used for the treatment of type II diabetes and non alcoholic fatty liver disease (NAFLD) (12, 13). Metformin has an excellent therapeutic index with few side affects being associated with long term treatment. While studies show that diabetes increases the relative risk of HCC, several studies now show that treatment of diabetics with metformin was a associated with a reduced risk of HCC (14, 15). Despite this association between metformin and reduced HCC, an anticancer role for metformin has not been examined in the main organ site of action. Therefore we set out to determine the role of metformin as a chemopreventive agent in HCC.
Materials and methods
Cell culture and growth assays
H4IIE and McA-RH7777 rat hepatoma, HepG2 human hepatoblastoma cell lines were obtained from ATCC. ATCC characterizes cell lines by short tandem repeat profiling. Experiments were performed with cells within 6 months of receipt or resuscitation. Huh7 human hepatocarcinoma were also used but authentication was not performed. All cells were grown in DMEM supplemented with 10% FBS and pen/strep. Experiments were performed with cells at less than 25 passages after receipt. 5000 cells/well were seeded in a 96 well plate and allowed to attach for 24 hours. Cells were then treated with 250 μM to 10 mM metformin. Cells were treated for 48 hours and cell growth determined using WST-1 (Roche) as per manufacturer’s instructions. For lipogenic rescue experiments H4IIE and McA-RH7777 rat hepatoma cell lines were transfected with a vector control or constitutively active SREBP1c (CA-SREBP1c) construct (Addgene). This construct encodes the cleaved, nuclear form of SREBP1c, which is constitutively active. Cells were selected in G418 and induction of Srebp1c and lipogenic gene expression confirmed by RT-PCR. Cells were seeded into 60 cm2 dishes and treated with metformin for 72 hr and cell growth assessed using a hemocytometer.
In vivo experiments
C57BL/6J mice were obtained from Jackson Labs and maintained by Animal Care facility at the University of Maryland, Baltimore. All mice procedures were done in accordance with University of Maryland IACUC care guidelines. Forty, two-week-old male mice (10 mice per group) were injected IP with 25mg/kg body weight diethylnitrosamine (DEN). Several pups died shortly after DEN treatment reducing the number of mice per group to 7. Mice were weaned at 4 weeks of age and fed control chow or chow containing metformin (Base diet was AIN-76-A, Bioserv, Frenchtown PA) at a dose of 250mg/kg body weight for 24 weeks or 36 weeks. Prior to euthanasia, mice were weighed and fed and fasting glucose levels obtained (Aviva Accuchek). At the termination of experiment mice were euthanized by CO2 asphyxiation followed by cervical dislocation. Livers were harvested and fixed in formalin or snap frozen for subsequent RNA or protein analysis. Visible tumors were also counted in 36 week group. For short term metformin experiments, mice were given control or metformin chow for two weeks and then liver and muscle removed for analysis.
Hepatic histology
Livers were embedding in paraffin and 5 μM sections cut and stained with hematoxylin-eosin by the University of Maryland Pathology Core and Mass Histology Services (Worcester, MA). Pathological analysis including tumors number and size was determined blinded by a pathologist (W.T).
RNA isolation and Reverse transcription
RNA was isolated from liver tissue or cells using Trizol reagent (Invitrogen) and cDNA synthesized as previously described (16). Real time PCR was performed with SYBR Green reagent (Applied Biosystems) using the primers shown in Supplemental Table 1. Actin or 18S were used as endogenous controls.
Western blotting
Livers were homogenized, protein extracted, separated by SDS-PAGE and transferred to nitrocellulose as previously described (16). Immunoblotting was performed for AMPK, p-AMPK, p-TSC2, ACLY, p-ACLY, ACC, p-ACC and FASN (Cell Signaling) followed by HRP secondary antibodies (Jackson Immunological). Actin was used as a control and proteins visualized using chemiluminescence (Pierce).
Triglyceride analysis
Triglyceride levels in liver tissue were determined by a colorimetric method using a triglyceride quantification kit (Biovision, CA). Briefly, 50 mg of liver tissue was homogenized in 1 ml solution containing 5% NP-40 in water and absorbance was read at 570nm as per manufacturer’s recommendations.
Cell growth assay
H4IIE and McA-RH7777 rat hepatoma, Huh7 human hepatocarcinoma, HepG2 human hepatoblastoma cell lines were obtained from ATCC and grown in DMEM supplemented with 10% FBS and pen/strep. Experiments were performed with cells at less than 25 passages after receipt. 5000 cells/well were seeded in a 96 well plate and allowed to attach for 24 hours. Cells were then treated with 250 μM to 10 mM metformin. Cells were treated for 48 hours and cell growth determined using WST-1 (Roche) as per manufacturer’s instructions. To access viability, cells were plated in 60 cm2 dishes, treated with metformin as described. Trypan blue exclusion was used to access viability using the Countess Cell Counter. For lipogenic rescue experiments H4IIE and McA-RH7777 rat hepatoma cell lines were transfected with a vector control or constitutively active SREBP1c (CA-SREBP1c) construct (Addgene). This construct encodes the cleaved, nuclear form of SREBP1c, which is constitutively active. Cells were selected in G418 and induction of Srebp1c and lipogenic gene expression confirmed by RT-PCR. Cells were seeded into 60 cm2 dishes and treated with metformin for 72 hr and cell growth assessed using a hemocytometer.
Statistical Analysis
Data are presented as mean ± SD or SE with indicated number of samples shown in figure legends. Statistical significance of differences between groups was analyzed by Student’s t test, and at least p < 0.05 was considered to be statistically significant. Level of significance is indicated in figure legends. To determine the number of mice for these studies, a Wilcoxon (Mann-Whitney) rank sum test was used with a 0.05 two sided significance level.
Results
Metformin prevents DEN induced tumorigenesis
Metformin has been investigated for cancer in a number of different organ sites. One of the primary indications for metformin is inhibition of hepatic glucose output by the liver. However, previous studies have not examined the effect of metformin in liver cancer. Therefore we treated several different HCC cell lines with increasing doses of metformin. Metformin decreased the growth of the cell lines in a dose dependent manner after 48 hr (Figure 1A-D). Viability did not appear to be affected by metformin at the doses used (Supplementary Figure 1A-C). It should be pointed out that viability was determined using trypan blue exclusion on cells remaining attached to the plate. Therefore any non-viable cells that had detached would be missed. However, we did not observe significantly fewer cells in the metformin treated samples after 48 hr compared to the start of the experiment. Nevertheless, at much higher doses of metformin we do observe a decrease in viability (data not shown). While these data show that metformin inhibits established liver cancer cell growth, it raises the question as to whether metformin can reduce liver carcinogenesis.
Figure 1.
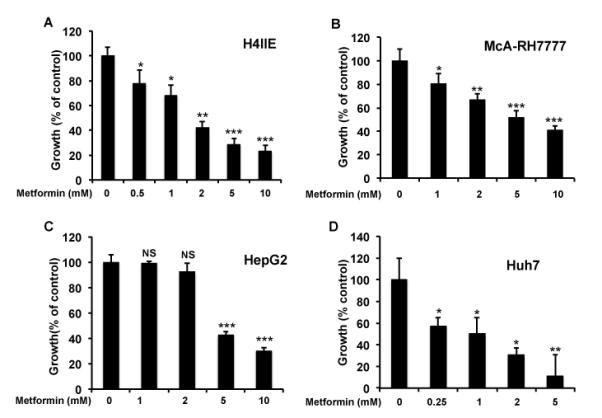
Metformin decreases the growth of HCC cell lines. Dose dependent decrease in cell growth in A) H4IIE B) McA-RH7777, C) HepG2, and D) Huh7 cell lines treated with the indicated doses of metformin as described in materials and methods. Cell growth was measured using Wst-1 colormeteric assay. N= 6 ± SE. * p < 0.05, ** p < 0.005 *** p < 0.0005.
We investigated the effect of metformin on HCC using the liver specific carcinogen DEN. Following treatment and weaning, mice were fed metformin-containing chow and mice euthanized after 24 or 36 weeks. Body weight of mice did not differ between control and metformin treated mice (Supplementary Figure 2A). In addition, the ratio of liver weight to body weight was also not different (Supplementary Figure 2B). No visible surface tumors were present on the livers of either control or metformin treated mice after 24 weeks. H&E examination of livers showed metformin treated mice developed 57% fewer tumors compared to control chow fed mice (Figure 2A). The size of the liver tumors from metformin treated mice was also reduced ~ 37% compared to control mice (Figure 2B). Despite the decrease in tumor formation, there was no histopathological difference between tumors of control or metformin treated mice (Figure 2C). Often an increase in liver to body weight ratio demonstrates an increase in liver tumor burden. The lack of a difference in our studies may be due to both groups having tumors present, albeit there were fewer tumors in metformin treated mice. In addition, the increased ratio is usually associated with abundant tumor burden, which was not observed in our studies. In the 36-week group, metformin treatment reduced the number of tumor number as determined by histopathology almost 60% (Figure 2D). The size of tumors was tumors was also reduced significantly (Figure 2E). In addition, visible tumors on the surface of the liver were reduced nearly 80% (Figure 2F and G, white spots are a reflection of light).
Figure 2.

Metformin inhibits DEN-induced hepatocellular carcinogenesis. A) Metformin reduces liver tumor multiplicity compared control treated mice at 24 weeks. B) Reduced liver tumor size in mice treated with metformin at 24 weeks. C) Representative H&E staining of paraffin embedded liver sections. Sections also indicate no change in pathology of tumors. D) Tumor number from livers of mice treated with control or metformin diet for 36 weeks. E) Reduced liver tumor size in mice treated with metformin at 36 weeks. F) Metformin reduces visible surface tumors after 36 weeks following DEN treatment. G) Representative liver from control or metformin treated mice after 36 weeks following DEN treatment. Mice were injected with DEN at 2 weeks of age and then placed on control or metformin chow diet after weaning. Mice were euthanized 24 or 36 weeks after DEN treatment. N=7 mice/group ± SE, *p<0.05, **p < 0.001.
Metformin suppresses liver tumorigenesis independent of AMPK
Previous studies have shown that metformin exerts its effect via activation of AMP kinase (17-20). The total protein levels of AMPK in the livers of metformin treated mice did not change compared to control fed mice. Interestingly, the active form of AMPK, phosphorylated AMPK (pAMPK), did not change following treatment with metformin for 24 weeks (Figure 3A and Supplemental Figure 3A). We also confirmed that that AMPK was not active by examining phosphorylation of the AMPK target, TSC2 which was unaltered following treatment with metformin (Supplemental Figure 3A).
Figure 3.

Metformin does not increase AMPK activation but does promote glucose homoeostasis. A) Metformin does not increase AMPK expression or phosphorylation. Protein extracts from livers of control and metformin treated mice were separated by SDS Page and immunoblotted for AMPK, phospho-AMPK, and actin as a control. Metformin decreases B) Pepck and C) G6Pase mRNA expression in livers of treated mice. RNA was isolated from livers of control and metformin treated mice and RT-PCR performed for Pepck and G6pase. Metformin reduces D) fed and E) fasting glucose levels. Mice were fed or fasted overnight, tail vein blood obtained and glucose levels determined. N = 4-6 ± SD. * p < 0.05, ** p < 0.005.
The most well known role of metformin is glycemic control and not necessarily AMPK activation. Metformin mediates its antidiabetic effects in part by inhibiting the expression of PEPCK and G6Pase, key mediators of hepatic gluconeogenesis (12, 17, 21). Metformin treatment suppressed the expression of PEPCK and G6Pase mRNA and protein (although the effect on G6pase protein was less pronounced) (Figure 3B, 3C and Supplemental Figure 3B). We also examined whether metformin had a physiological effect on treated mice. Control mice had normal fed glucose levels (~165 mg/dL), whereas metformin decreased fed glucose levels (143 mg/dL) although it was still in the normal fed glucose range (Figure 3D). Fasting glucose in control mice was reduced to 96 mg/dL, and 76 mg/dL in metformin treated mice (Figure 3E). This confirms that metformin reduces circulating glucose levels in DEN treated mice without inducing clinical hypoglycemia (glucose levels <55 mg/dL). These data demonstrate that metformin is altering glucose homeostasis without increasing AMPK activity in the liver. This is in agreement with recent studies demonstrating that metformin treatment reduces glucose production independent of AMPK activation (22).
The lack of metformin induced AMPK activation was surprising given the evidence in the literature. However, the first report of AMPK activation in vivo by metformin was shown in muscle and not liver. To confirm this tissue specific effect on AMPK, we treated mice with metformin for two weeks and examined pAMPK in liver and muscle. Treatment with metformin increased pAMPK in muscle from metformin treated mice (Supplemental Figure 4A). In contrast, there was no change to liver pAMPK (Supplemental Figure 4B). This demonstrates that oral administration of metformin activates AMPK in muscle but not in the liver. The effects of metformin on blood glucose and gluconeogenic gene expression confirm the physiological efficacy of metformin in our experiments despite the lack of AMPK activation in the liver. These data strongly suggest that metformin is inhibiting liver tumorigenesis in an AMPK independent manner.
Metformin inhibits tumor growth by reducing lipogenesis
De novo lipogenesis from glucose has become recognized as an important pathway in cancer (23-25). Increased lipogenesis has been demonstrated in liver tumors compared to normal adjacent tissue (26). The tumors showed increased expression of key enzymes regulating fatty acid synthesis and lipogenesis. Therefore we examined the effect of metformin on lipogenic gene expression during DEN induced carcinogenesis. Acetyl-CoA carboxylase (ACC) is the rate-limiting enzyme in the synthesis of fatty acids, which converts acetyl CoA to malonyl CoA. ACC mRNA and protein levels were reduced in metformin treated mice (Figure 4A and 4D and Supplementary Figure 5). AMPK decreases lipogenesis in part by phosphorylating ACC, which reduces ACC activity. Surprisingly, phosphorylation of ACC was actually reduced in livers from metformin treated mice (Figure 4D and Supplementary Figure 5). It is unclear why pACC is reduced (more active), but might reflect compensation by the liver as a result of reduced lipid synthesis. Regardless, the lack of an increase in ACC phosphorylation further demonstrates that metformin does not activate AMPK in these studies and that the mechanism of metformin mediated growth inhibition is AMPK independent. We then examined the expression of fatty acid synthase (FASN), a large multifunctional enzyme that synthesizes palmitate from acetyl CoA and malonyl CoA. FASN mRNA and protein levels were significantly decreased from livers of mice treated with metformin (Fig 4B and 4D and Supplementary Figure 5). In order for glucose to be used for de novo fatty acid synthesis, the enzyme ATP citrate lyase (ACLY) is required to make acetyl coA available in the cytoplasm for fatty acid synthesis. The expression of ACLY RNA levels was reduced in the livers from metformin treated mice (Figure 4C). In addition, the protein expression of ACLY was also reduced (Figure 4D and Supplementary Figure 5). We also examined the expression of phosphorylated active ACLY. pACLY levels were also reduced from the livers of metformin treated mice (Figure 4D and Supplementary Figure 5). Lipogenesis in the liver is a function of increased fatty acid synthesis and fatty acid esterification into triglycerides. Therefore to confirm the effect of metformin on hepatic lipogenesis, we examined triglyceride concentrations in the livers of control and metformin treated mice. As expected based on previous studies, metformin treatment significantly reduced liver triglyceride levels (Figure 4E). Together, these data demonstrate that metformin coordinates the down regulation of pathways driving de novo lipogenesis from glucose.
Figure 4.

Metformin decreases the expression of enzymes driving hepatic lipogenesis. Treatment of mice with metformin decreases the expression of fatty acid synthesis genes, A) Acc and B) Fasn. C) Metformin decreases the expression of the citrate cleavage enzyme, Acly. D) Metformin decreases the protein expression of ACC, FASN and ACLY, and active ACLY (phosphorylated). Metformin treatment does not increase AMPK activation as evidence by lack of an increase in ACC phosphorylation. Total cell lysates were prepared from liver tissues extracted from control and metformin treated mice. Immunoblotting was performed for: ACC, p-ACC, ACLY, p-ACLY, and FAS. Tubulin was used as an endogenous control. E) Metformin decreases liver triglycerides. For RT PCR and triglycerides levels, N = 4-6 ± SD. * p< 0.05 ** p < 0.005.
Induction of lipogenic gene expression rescues the growth inhibiting effects of metformin
Next we examined the effect of metformin on the expression of lipogenic genes in the HCC cell lines described above. Similar to what we observed in vivo, metformin reduced the expression of ACLY, ACC and FASN in the HCC cell lines (Figure 5A-D). These data strongly suggests an association between a reduction in lipogenic gene expression and inhibition of growth by metformin. Therefore, we wanted to determine whether the reduction in lipogenic gene expression is mediating the growth effects of metformin. Rather than overexpress a single lipogenic gene we wanted to restores the expression of all three lipogenic genes. SREBP1c is a key transcription factor driving lipogenic gene expression in the liver (27). In addition, SREBP1c is associated with the lipogenic phenotype observed in cancer (28, 29). We used a cleaved nuclear form of SREBP1c, which is constitutively active (CA-SREPB1c). Ectopic expression of CA-SREBP1c in H4IIE and MCA-RH7777 hepatoma cell lines induced the expression of Srepb1c and all three lipogenic genes (Supplemental Figure 6A-6D). Cells were then treated with metformin and effects on cell growth determined. Metformin treatment of the vector control cells with the indicated doses reduced growth ~ 40% in both cell line (Figure 5E and 5F). However, in the CA-SREBP1c expressing cells, growth inhibition was significantly reduced, with growth being restored to untreated levels. This demonstrates that the anti cancer effects of metformin are in part mediated by reducing lipogenic gene expression.
Figure 5.

Inhibition of lipogenic gene expression is responsible for the growth effects of metformin. Treatment with metformin decreases lipogenic gene expression in A) H4IIE B) MCA-RH7777 C) HepG2 and D) Huh7 HCC cell lines. Expression was normalized to β-actin and expressed relative to control. N=3 ± SD, * p < 0.05, ** p <0.005 compared to control. Induction of lipogenic gene expression by ectopic expression of SREBP1c rescues metformin mediated growth inhibition in E) H4IIE and F) MCA-RH7777 HCC cell lines. Stable pcDNA vector control and CA-SREBP1c expressing cell lines were established. Cells were treated with metformin for 72 hr and cell growth determined using a hemocytometer. N=3 ± SD, * p < 0.01.
Discussion
Hepatocellular carcinoma is typically associated with a poor prognosis. Most patients are diagnosed with advanced disease which has a 5 year survival of ~ 2%. Therefore prevention of HCC represents the best strategy to reduce mortality and morbidity. This requires the identification of patients at risk for HCC and the development of safe chemopreventive agents. Type II diabetics have significant increased risk for developing HCC (3, 6, 7). The increased risk represents a growing health concern since diabetes rates are increasing, due in part to the obesity epidemic. Metformin is a first line drug of choice for the treatment of type II diabetes. In addition to its anti-diabetic effects, preclinical studies show that metformin has anticancer properties in vitro and in vivo (6, 19, 30-34). Epidemiological evidence shows a significant reduction in HCC in diabetic patients taking metformin (14, 15). Surprisingly, there have been no preclinical studies on the ability of metformin to inhibit HCC despite the liver being the main metformin responsive tissue. The studies we describe here show that metformin significantly protects against HCC formation and tumor growth. In addition, our data shows this is part via downregulation of multiple steps in de novo lipogenesis.
Several potential mechanisms have been proposed for inhibitory action of metformin on tumor growth (19, 35-37). Early reports suggested that metformin exerts its effect via activation of the energy sensor AMPK (17-20). However in our studies we did not observe an increase in phosphorylated AMPK in the livers of treated mice, although fed and fasting glucose levels as well as gluconeogenic targets were reduced. This was further confirmed by the lack of phosphorylation of AMPK downstream targets, ACC and TSC2. This is in line with several recent studies highlighting AMPK independent effects of metformin on glucose homeostasis and tumor growth in vitro and in vivo (22, 34, 38-40). Although administration of metformin to mice did not alter AMPK activation in liver, we did observe activation in muscle. Indeed, the original manuscript describing metformin-mediated activation of AMPK in vivo was shown in muscle (18).
These studies and others still contradict several studies showing AMPK activation in the liver by metformin. One likely explanation may be that mice were treated for an extended period of time in our experiments where as the other studies used short-term treatment (17). In addition, it was recently demonstrated by Memmott et al, that AMPK activation by metformin in the liver may be route dependent (34). They showed that intraperitoneal (IP) but not oral metformin treatment increased the phosphorylation of AMPK in liver. It is believed that IP administration leads to a higher systemic concentration compared to oral administration (34). It is important to note that metformin is currently approved for orally administration, and therefore IP administered metformin is not clinically appropriate.
This prompted us to investigate other potential mechanisms responsible for the chemopreventive effects of metformin. De novo lipogenesis represents a common feature of many types of cancers and in particular HCC. The expression and activity of the two main fatty acid synthesis enzymes, ACC and FASN are elevated in several different cancer types including HCC. ACC is the rate-limiting step of de novo fatty acid synthesis, which converts acetyl CoA to malonyl CoA. FASN generates palmitate from acetyl CoA and malonyl CoA. Similarly our studies show that metformin reduces FASN expression in the livers of treated mice. In addition, we observe a decrease in ACC expression as well. In support of the potential of metformin to inhibit cancer growth via fatty acid synthesis, recently Algire et al showed that metformin treatment of tumor bearing mice led to a reduction in FASN expression in tumors (37). Although metformin is reported to reduce fatty acid synthesis by activating AMPK, since we did not observe an increase in AMPK activation, an AMPK independent mechanism is most likely responsible. Regardless, these studies are the first to show the effect of metformin on lipogenic pathways in an autochthonous cancer model.
ACC and FASN utilize acetyl CoA for de novo lipogenesis in the cytoplasm. However acetyl CoA derived from glucose is generated in the mitochondria. In order for acetyl CoA to participate in fatty acid synthesis, it must be made available in the cytoplasm. Cells accomplish this by converting acetyl CoA and oxaloacetate (OAA) in the TCA cycle into citrate, which can then be exported to the cytoplasm. In the cytoplasm ATP-citrate lyase (ACLY) converts citrate back to OAA and acetyl CoA. We show that metformin also reduces ACLY expression. This would further reduce the ability of cells to perform de novo lipogenesis from glucose. The importance of ACLY in cancer is highlighted by studies showing that genetic or chemical inhibition of ACLY has anticancer effects (41, 42). The ability of metformin to reduce cell growth by inhibiting the gene expression of several genes driving fatty acid synthesis was confirmed using a genetic rescue approach. SREBP1c is a master regulator of lipogenesis in the liver. In addition, ACLY, ACC and FASN are direct transcriptional targets of SREBP1c. Ectopic expression of SREBP1c induced lipogenic gene expression and blocked the growth inhibitory effects of metformin in HCC cell lines. This demonstrates that the ability of metformin to reduce cell growth is in part mediated via inhibition of expression of multiple lipogenic genes. Therefore unlike inhibitors of fatty acid synthesis that target only one step, our data demonstrates that metformin regulates multiple pathways involved in fatty acid synthesis.
The studies we describe here were performed in non-diabetic mice. However, metformin is most likely as effective in diabetic or obese conditions. Indeed, recent studies show that metformin is more effective at reducing tumor growth in mice receiving a diet promoting obesity and diabetes (31, 37). In addition, the mechanism of action suggests it may be more effective in diabetic models. Diabetes is associated with increased fatty acid synthesis and hepatic steatosis (25, 43) both of which promote HCC (25, 44). Future studies will determine the ability of metformin to protect against HCC in diet and genetic rodent models of diabetes and obesity.
Our data also has relevance for cancer prevention with regard to other risk factors associated with HCC. NAFLD and obesity are independent risk factor for HCC. Both of these conditions are associated with increased lipogenesis and hepatic steatosis. However, it should be noted that NAFLD, obesity and diabetes are often co-morbidities, and found in most cases of HCC. These studies also have bearing for patients with HBV and HCV. Many patients with HBV and HCV have hepatic steatosis, and increased fatty acid synthesis (45-48). The significance of this is underscored by a 100-fold increased risk of HCC in patients the co-morbidities of diabetes and obesity with hepatitis (49). Therefore this represents a particularly important candidate group for consideration for metformin as a chemoprevention approach.
One of the advantages of metformin is its relatively safe toxicity profile. In addition, metformin is already approved for diabetes and therefore its introduction into the clinic streamlined. There are currently over 20 clinical trials investigating the role of metformin as an anticancer agent (50). However, none of these are investigating the ability of metformin to reduce cancer in the liver, its main target organ of action. Prior to these trials it would be valuable to determine at what time point during liver carcinogenesis metformin is effective. In conclusion our data demonstrates that metformin inhibits HCC in part by inhibition of hepatic lipogenesis. This provides a rationale for clinical trials into the efficacy of metformin in HCC in patients that can readily be identified such as diabetics and other pathologies associated with hepatic lipogenesis.
Supplementary Material
Acknowledgments
This work was supported by the University of Maryland Greenebaum Cancer Center CRF and the NIDDK (DK064685) to G.D.G.
References
- 1.El-Serag HB, Rudolph KL. Hepatocellular carcinoma: epidemiology and molecular carcinogenesis. Gastroenterology. 2007;132:2557–76. doi: 10.1053/j.gastro.2007.04.061. [DOI] [PubMed] [Google Scholar]
- 2.Parkin DM, Bray F, Ferlay J, Pisani P. Global cancer statistics, 2002. CA Cancer J Clin. 2005;55:74–108. doi: 10.3322/canjclin.55.2.74. [DOI] [PubMed] [Google Scholar]
- 3.El-Serag HB. Hepatocellular carcinoma: recent trends in the United States. Gastroenterology. 2004;127:S27–34. doi: 10.1053/j.gastro.2004.09.013. [DOI] [PubMed] [Google Scholar]
- 4.El-Serag HB, Mason AC, Key C. Trends in survival of patients with hepatocellular carcinoma between 1977 and 1996 in the United States. Hepatology. 2001;33:62–5. doi: 10.1053/jhep.2001.21041. [DOI] [PubMed] [Google Scholar]
- 5.Davila JA, Morgan RO, Shaib Y, McGlynn KA, El-Serag HB. Hepatitis C infection and the increasing incidence of hepatocellular carcinoma: a population-based study. Gastroenterology. 2004;127:1372–80. doi: 10.1053/j.gastro.2004.07.020. [DOI] [PubMed] [Google Scholar]
- 6.Decensi A, Puntoni M, Goodwin P, et al. Metformin and cancer risk in diabetic patients: a systematic review and meta-analysis. Cancer Prev Res (Phila) 2010;3:1451–61. doi: 10.1158/1940-6207.CAPR-10-0157. [DOI] [PubMed] [Google Scholar]
- 7.El-Serag HB, Richardson PA, Everhart JE. The role of diabetes in hepatocellular carcinoma: a case-control study among United States Veterans. The American journal of gastroenterology. 2001;96:2462–7. doi: 10.1111/j.1572-0241.2001.04054.x. [DOI] [PubMed] [Google Scholar]
- 8.Polesel J, Zucchetto A, Montella M, et al. The impact of obesity and diabetes mellitus on the risk of hepatocellular carcinoma. Ann Oncol. 2009;20:353–7. doi: 10.1093/annonc/mdn565. [DOI] [PubMed] [Google Scholar]
- 9.Hill-Baskin AE, Markiewski MM, Buchner DA, et al. Diet-induced hepatocellular carcinoma in genetically predisposed mice. Hum Mol Genet. 2009;18:2975–88. doi: 10.1093/hmg/ddp236. [DOI] [PMC free article] [PubMed] [Google Scholar]
- 10.Park EJ, Lee JH, Yu GY, et al. Dietary and genetic obesity promote liver inflammation and tumorigenesis by enhancing IL-6 and TNF expression. Cell. 2010;140:197–208. doi: 10.1016/j.cell.2009.12.052. [DOI] [PMC free article] [PubMed] [Google Scholar]
- 11.Yamasaki K, Hayashi Y, Okamoto S, Osanai M, Lee GH. Insulin-independent promotion of chemically induced hepatocellular tumor development in genetically diabetic mice. Cancer Sci. 2010;101:65–72. doi: 10.1111/j.1349-7006.2009.01345.x. [DOI] [PMC free article] [PubMed] [Google Scholar]
- 12.Wiernsperger NF, Bailey CJ. The antihyperglycaemic effect of metformin: therapeutic and cellular mechanisms. Drugs. 1999;58(Suppl 1):31–9. doi: 10.2165/00003495-199958001-00009. discussion 75-82. [DOI] [PubMed] [Google Scholar]
- 13.Marchesini G, Brizi M, Bianchi G, Tomassetti S, Zoli M, Melchionda N. Metformin in non-alcoholic steatohepatitis. Lancet. 2001;358:893–4. doi: 10.1016/s0140-6736(01)06042-1. [DOI] [PubMed] [Google Scholar]
- 14.Donadon V, Balbi M, Mas MD, Casarin P, Zanette G. Metformin and reduced risk of hepatocellular carcinoma in diabetic patients with chronic liver disease. Liver Int. 2010;30:750–8. doi: 10.1111/j.1478-3231.2010.02223.x. [DOI] [PubMed] [Google Scholar]
- 15.Donadon V, Balbi M, Ghersetti M, et al. Antidiabetic therapy and increased risk of hepatocellular carcinoma in chronic liver disease. World J Gastroenterol. 2009;15:2506–11. doi: 10.3748/wjg.15.2506. [DOI] [PMC free article] [PubMed] [Google Scholar]
- 16.Drori S, Girnun GD, Tou L, et al. Hic-5 regulates an epithelial program mediated by PPARgamma. Genes Dev. 2005;19:362–75. doi: 10.1101/gad.1240705. [DOI] [PMC free article] [PubMed] [Google Scholar]
- 17.Shaw RJ, Lamia KA, Vasquez D, et al. The kinase LKB1 mediates glucose homeostasis in liver and therapeutic effects of metformin. Science. 2005;310:1642–6. doi: 10.1126/science.1120781. [DOI] [PMC free article] [PubMed] [Google Scholar]
- 18.Zhou G, Myers R, Li Y, et al. Role of AMP-activated protein kinase in mechanism of metformin action. J Clin Invest. 2001;108:1167–74. doi: 10.1172/JCI13505. [DOI] [PMC free article] [PubMed] [Google Scholar]
- 19.Zakikhani M, Dowling R, Fantus IG, Sonenberg N, Pollak M. Metformin is an AMP kinase-dependent growth inhibitor for breast cancer cells. Cancer Res. 2006;66:10269–73. doi: 10.1158/0008-5472.CAN-06-1500. [DOI] [PubMed] [Google Scholar]
- 20.Zakikhani M, Dowling RJ, Sonenberg N, Pollak MN. The effects of adiponectin and metformin on prostate and colon neoplasia involve activation of AMP-activated protein kinase. Cancer Prev Res (Phila) 2008;1:369–75. doi: 10.1158/1940-6207.CAPR-08-0081. [DOI] [PubMed] [Google Scholar]
- 21.Hundal RS, Krssak M, Dufour S, et al. Mechanism by which metformin reduces glucose production in type 2 diabetes. Diabetes. 2000;49:2063–9. doi: 10.2337/diabetes.49.12.2063. [DOI] [PMC free article] [PubMed] [Google Scholar]
- 22.Foretz M, Hebrard S, Leclerc J, et al. Metformin inhibits hepatic gluconeogenesis in mice independently of the LKB1/AMPK pathway via a decrease in hepatic energy state. J Clin Invest. 2010;120:2355–69. doi: 10.1172/JCI40671. [DOI] [PMC free article] [PubMed] [Google Scholar]
- 23.Menendez JA, Lupu R. Fatty acid synthase and the lipogenic phenotype in cancer pathogenesis. Nature reviews. 2007;7:763–77. doi: 10.1038/nrc2222. [DOI] [PubMed] [Google Scholar]
- 24.Deberardinis RJ, Sayed N, Ditsworth D, Thompson CB. Brick by brick: metabolism and tumor cell growth. Curr Opin Genet Dev. 2008;18:54–61. doi: 10.1016/j.gde.2008.02.003. [DOI] [PMC free article] [PubMed] [Google Scholar]
- 25.Postic C, Girard J. The role of the lipogenic pathway in the development of hepatic steatosis. Diabetes Metab. 2008;34:643–8. doi: 10.1016/S1262-3636(08)74599-3. [DOI] [PubMed] [Google Scholar]
- 26.Yahagi N, Shimano H, Hasegawa K, et al. Co-ordinate activation of lipogenic enzymes in hepatocellular carcinoma. Eur J Cancer. 2005;41:1316–22. doi: 10.1016/j.ejca.2004.12.037. [DOI] [PubMed] [Google Scholar]
- 27.Sato R. Sterol metabolism and SREBP activation. Arch Biochem Biophys. 2010;501:177–81. doi: 10.1016/j.abb.2010.06.004. [DOI] [PubMed] [Google Scholar]
- 28.Furuta E, Pai SK, Zhan R, et al. Fatty acid synthase gene is up-regulated by hypoxia via activation of Akt and sterol regulatory element binding protein 1. Cancer Res. 2008;68:1003–11. doi: 10.1158/0008-5472.CAN-07-2489. [DOI] [PubMed] [Google Scholar]
- 29.Porstmann T, Santos CR, Griffiths B, et al. SREBP activity is regulated by mTORC1 and contributes to Akt-dependent cell growth. Cell Metab. 2008;8:224–36. doi: 10.1016/j.cmet.2008.07.007. [DOI] [PMC free article] [PubMed] [Google Scholar]
- 30.Dowling RJ, Zakikhani M, Fantus IG, Pollak M, Sonenberg N. Metformin inhibits mammalian target of rapamycin-dependent translation initiation in breast cancer cells. Cancer Res. 2007;67:10804–12. doi: 10.1158/0008-5472.CAN-07-2310. [DOI] [PubMed] [Google Scholar]
- 31.Algire C, Zakikhani M, Blouin MJ, Shuai JH, Pollak M. Metformin attenuates the stimulatory effect of a high-energy diet on in vivo LLC1 carcinoma growth. Endocr Relat Cancer. 2008;15:833–9. doi: 10.1677/ERC-08-0038. [DOI] [PubMed] [Google Scholar]
- 32.Tomimoto A, Endo H, Sugiyama M, et al. Metformin suppresses intestinal polyp growth in ApcMin/+ mice. Cancer Sci. 2008;99:2136–41. doi: 10.1111/j.1349-7006.2008.00933.x. [DOI] [PMC free article] [PubMed] [Google Scholar]
- 33.Hosono K, Endo H, Takahashi H, et al. Metformin suppresses azoxymethane-induced colorectal aberrant crypt foci by activating AMP-activated protein kinase. Mol Carcinog. 2010;49:662–71. doi: 10.1002/mc.20637. [DOI] [PubMed] [Google Scholar]
- 34.Memmott RM, Mercado JR, Maier CR, Kawabata S, Fox SD, Dennis PA. Metformin prevents tobacco carcinogen--induced lung tumorigenesis. Cancer Prev Res (Phila) 2010;3:1066–76. doi: 10.1158/1940-6207.CAPR-10-0055. [DOI] [PMC free article] [PubMed] [Google Scholar]
- 35.Kourelis TV, Siegel RD. Metformin and cancer: new applications for an old drug. Med Oncol. 2011 doi: 10.1007/s12032-011-9846-7. [DOI] [PubMed] [Google Scholar]
- 36.Memmott RM, Dennis PA. LKB1 and mammalian target of rapamycin as predictive factors for the anticancer efficacy of metformin. J Clin Oncol. 2009;27:e226. doi: 10.1200/JCO.2009.25.3963. author reply e7. [DOI] [PubMed] [Google Scholar]
- 37.Algire C, Amrein L, Zakikhani M, Panasci L, Pollak M. Metformin blocks the stimulative effect of a high-energy diet on colon carcinoma growth in vivo and is associated with reduced expression of fatty acid synthase. Endocr Relat Cancer. 2010;17:351–60. doi: 10.1677/ERC-09-0252. [DOI] [PubMed] [Google Scholar]
- 38.Kalender A, Selvaraj A, Kim SY, et al. Metformin, independent of AMPK, inhibits mTORC1 in a rag GTPase-dependent manner. Cell Metab. 2010;11:390–401. doi: 10.1016/j.cmet.2010.03.014. [DOI] [PMC free article] [PubMed] [Google Scholar]
- 39.Ben Sahra I, Laurent K, Loubat A, et al. The antidiabetic drug metformin exerts an antitumoral effect in vitro and in vivo through a decrease of cyclin D1 level. Oncogene. 2008;27:3576–86. doi: 10.1038/sj.onc.1211024. [DOI] [PubMed] [Google Scholar]
- 40.Guigas B, Bertrand L, Taleux N, et al. 5-Aminoimidazole-4-carboxamide-1-beta-D-ribofuranoside and metformin inhibit hepatic glucose phosphorylation by an AMP-activated protein kinase-independent effect on glucokinase translocation. Diabetes. 2006;55:865–74. doi: 10.2337/diabetes.55.04.06.db05-1178. [DOI] [PubMed] [Google Scholar]
- 41.Hatzivassiliou G, Zhao F, Bauer DE, et al. ATP citrate lyase inhibition can suppress tumor cell growth. Cancer Cell. 2005;8:311–21. doi: 10.1016/j.ccr.2005.09.008. [DOI] [PubMed] [Google Scholar]
- 42.Bauer DE, Hatzivassiliou G, Zhao F, Andreadis C, Thompson CB. ATP citrate lyase is an important component of cell growth and transformation. Oncogene. 2005;24:6314–22. doi: 10.1038/sj.onc.1208773. [DOI] [PubMed] [Google Scholar]
- 43.Wang Q, Jiang L, Wang J, et al. Abrogation of hepatic ATP-citrate lyase protects against fatty liver and ameliorates hyperglycemia in leptin receptor-deficient mice. Hepatology. 2009;49:1166–75. doi: 10.1002/hep.22774. [DOI] [PubMed] [Google Scholar]
- 44.Yang S, Lin HZ, Hwang J, Chacko VP, Diehl AM. Hepatic hyperplasia in noncirrhotic fatty livers: is obesity-related hepatic steatosis a premalignant condition? Cancer Res. 2001;61:5016–23. [PubMed] [Google Scholar]
- 45.Na TY, Shin YK, Roh KJ, et al. Liver X receptor mediates hepatitis B virus X protein-induced lipogenesis in hepatitis B virus-associated hepatocellular carcinoma. Hepatology. 2009;49:1122–31. doi: 10.1002/hep.22740. [DOI] [PubMed] [Google Scholar]
- 46.Hajjou M, Norel R, Carver R, et al. cDNA microarray analysis of HBV transgenic mouse liver identifies genes in lipid biosynthetic and growth control pathways affected by HBV. J Med Virol. 2005;77:57–65. doi: 10.1002/jmv.20427. [DOI] [PubMed] [Google Scholar]
- 47.Kim K, Kim KH, Kim HH, Cheong J. Hepatitis B virus X protein induces lipogenic transcription factor SREBP1 and fatty acid synthase through the activation of nuclear receptor LXRalpha. Biochem J. 2008;416:219–30. doi: 10.1042/BJ20081336. [DOI] [PubMed] [Google Scholar]
- 48.Lerat H, Kammoun HL, Hainault I, et al. Hepatitis C virus proteins induce lipogenesis and defective triglyceride secretion in transgenic mice. J Biol Chem. 2009;284:33466–74. doi: 10.1074/jbc.M109.019810. [DOI] [PMC free article] [PubMed] [Google Scholar]
- 49.Chen CL, Yang HI, Yang WS, et al. Metabolic factors and risk of hepatocellular carcinoma by chronic hepatitis B/C infection: a follow-up study in Taiwan. Gastroenterology. 2008;135:111–21. doi: 10.1053/j.gastro.2008.03.073. [DOI] [PubMed] [Google Scholar]
- 50.ClinicalTrials.gov http://clinicaltrials.gov/ct2/results?term=metformin+cancer&pg=1. [cited; Available from:
Associated Data
This section collects any data citations, data availability statements, or supplementary materials included in this article.