

Abstract
Background
Tissue background autofluorescence induced by standard murine diets containing chlorophyll is a significant problem for fluorescence whole-body imaging. However, since red chlorophyll autofluorescence delineates the gastrointestinal (GI) tract in the abdomen of the mouse, it should be possible to dynamically and non-invasively image intestinal motions. Herein, we non-invasively imaged for the first time intestinal motions, such as peristaltic and segmental motions, without an exogenous imaging agent, using red chlorophyll fluorescence.
Methods
Mice were illuminated with 660 nm light from a laser diode and autofluorescence at 710 nm was acquired dynamically for 5 mins with 200 ms exposure time. Fluorescent imaging data were analyzed to generate a three dimensional spatio-temporal map to quantify intestinal motions.
Results
Peristaltic and segmental motions were observed in vivo in mice. Our quantification showed that the frequency and propagation velocity of peristaltic contractile waves in the small intestine were measured to be 28.6 cycles/min and 1.82 ± 0.56 cm/s, respectively.
Conclusions & Inferences
This simple, but unexplored imaging technique can provide a means to monitor intestinal motility disorders and response to therapeutic agents.
Keywords: autofluorescence, fluorescence imaging, intestinal motion, chlorophyll
1. Introduction
Depending upon the excitation wavelength, tissue autofluorescence is produced by endogenous chromophores, such as elastin, collagen, porphyrins, tryptophan, and NADH [1]. It has also been shown that chlorophyll from the alfalfa in commonly used laboratory murine diets fluoresces between 650 to 750 nm [2]. Thus, when mice are excited by 660 nm excitation light, strong background autofluorescence resulting from ingested food along the gastrointestinal (GI) tract in the abdominal region is detected, which provides a significant limitation for in vivo fluorescence molecular imaging, especially using red excitable fluorophores, such as Cy5.5 and Alexa 650 and 680. Therefore, there has been great effort to eliminate unwanted autofluorescent signals, including use of chlorophyll free food and/or multiplexing imaging [2–5].
The GI tract has various controlled motions, such as peristaltic and segmental motions, to mix and propel its contents as an essential part of digestion and absorption. Non-invasive computed tomography (CT) or magnetic resonance imaging (MRI) following oral gavage of barium or iodine solution, respectively, has been used to assess GI motions, such as peristaltic and segmental motions [6–9]. Recently, we demonstrated for the first time, non-invasive near-infrared fluorescence (NIRF) imaging with sufficient temporal resolution and sensitivity to image dynamic contractile motion of the murine intestines following injection of an exogenous NIR fluorophore, indocyanine green (ICG) [10]. Since ingested food travels through the GI tract, we hypothesize that autofluorescence imaging can be used to non-invasively assess intestinal motions in mice. Yet to date, there have been no studies to image intestinal motions using autofluorescent signals. The goal of this study is to non-invasively and quantitatively image intestinal contractile activity in mice using autofluorescence generated by chlorophyll fluorescence without administration of exogenous imaging agents.
2. Materials and Methods
Six to eight week old mice that carry a rasa1 floxed allele (rasa1 fl/fl) [11] were maintained in standard cages with free access to water and pellets (Purina 5053, Labdiet PMI Nutritional International, St. Louis, MO) prior to imaging. Rasa1 fl/fl mice are completely normal and thus used for GI imaging. Under isofluorane anesthesia, mice were clipped and depilatory agents were used to remove residual hair 24 hr before fluorescence imaging. For autofluorescence imaging, 660 nm light from a laser diode (500 mA, 660 nm) via a diffuser and a 660 nm bandpass filter (Image quality, model 660.0–1.0, Andover Corp., Salem, NH) illuminated the whole body of an anesthetized mouse, which was at 37 °C on a warming pad. Red fluorescence in the abdominal region of the mouse was collected through a 710 nm bandpass filter (Image quality, model 710.0–2.0, Andover Corp., Salem, NH). Fluorescent images were acquired by an electron-multiplying CCD camera (EMCCD, PhotonMax, Tucson, AZ) with 200 ms integration time for about 5 mins. We measured abdominal skin temperature using an infrared thermometer and observed no temperature changes during dynamic fluorescence imaging. A macrolens (Leica Z16 APO, Leica Microsystems, Inc., Bannockburn, IL) was also used to achieve a greater magnification, which was placed on the EMCCD camera. For acquisition of white-light images, the optical filters were removed and a low-power lamp illuminated the subject. Image acquisition was accomplished by V++ software (Digital Optics, Aukland, New Zealand). Necropsy of the mouse with exposure of the abdomen was also performed and the GI tract was removed and laid out on black paper for autofluorescence imaging. Animal experiments were approved by and performed in accordance with The University of Texas Health Science Center Institutional Animal Care and Usage Committee and in accordance with NIH guidelines.
Fluorescent imaging data were analyzed using Matlab (The MathWorks, Inc., Natick, MA). Regions of interest (ROIs) of equivalent areas were selected along the fluorescent intestines on sequential frames of fluorescence images as was similarly done for lymphatic imaging [12]. We selected small circular ROIs of equivalent size to minimize the respiratory motion artifacts. The averaged fluorescent intensity within each selected ROI was plotted as a function of imaging time and ROI to generate a three-dimensional (3-D) spatio-temporal map. Thus, the propagation velocity and the frequency of intestinal contractility were assessed. In this study, we defined peristaltic motion (or contractility) as aboral propagation of contractile waves along the intestines.
3. Results
As reported by others and our group [2–4], autofluorescence along the GI tract in the abdominal region of the mouse was observed (Figure 1A). Mice showed different digestive status at each imaging time point as indicated by autofluorescence imaging. Thus, non-uniformly distributed autofluorescence was detected throughout the intestines in the excised whole GI tract (Figure 1B) and a magnified fluorescence image demonstrated that autofluorescence came from ingested food containing chlorophyll (Figure 1C). It is unknown how much chlorophyll is required in the diet to get a good image; however, with a normal eating pattern we were able to obtain high quality images. Since in vivo autofluorescence images showed clear delineation of the intestines in the abdomen, we performed dynamic autofluorescence imaging. Peristaltic motion, which is a radially symmetrical contraction and relaxation of smooth muscle to propel contents though the intestines, was imaged non-invasively (Supplemental movie 1). To quantify peristaltic motion, 46 ROIs were selected along the fluorescent intestines (Figure 2B) and a 3-D map was generated as a function of time and ROI (Figure 2C). A 3-D map showed the aboral propagation of the contractile wave along the small intestine as shown in Video 1. The patterns illustrated in Figure 2C are similar to those during the migrating motor complexes (MMC), due to slow movement of fluorescent intraluminal contents (red broken arrow). The frequency of peristalsis and propagation velocity were measured to be 28.6 cycles/min and 1.82 ± 0.56 cm/s, respectively, which is agreement with our previous data (the frequency of 27 – 35 cycles/min and the propagation velocity of 0.82 ± 0.5 to 2.04 ± 1.12 cm/s) using NIRF imaging with injection of ICG, indicating there is no effect of administration of ICG on intestinal motions. We also observed the propagation of peristaltic motion in the cecum at the propagation velocity of 0.31 ± 0.05 cm/s. In addition to peristaltic motion, segmental motion, which undergoes alternate contraction and relaxation necessary to mix food and chyme, was also visualized in a different mouse (Supplemental movie 2). A 3-D plot after selection of 46 ROIs on the fluorescent intestines (Figure 3E) showed segmental patterns (Figure 3F), which were different from peristaltic motion. Our analysis can assess intestinal motions in more than one section of the intestines at a time; however, we found that there was no motion in the other two sections below the one analyzed as shown in Supplemental movie 2. Although respiratory movements were not corrected for in the construction of 3-D spatio-temporal maps, dynamic changes of fluorescent intensities of small ROIs situated in the center of the fluorescent intestines are shown in Figures 2C and 2F and Supplemental movies and arise due to intestinal contractile activity.
Figure 1.
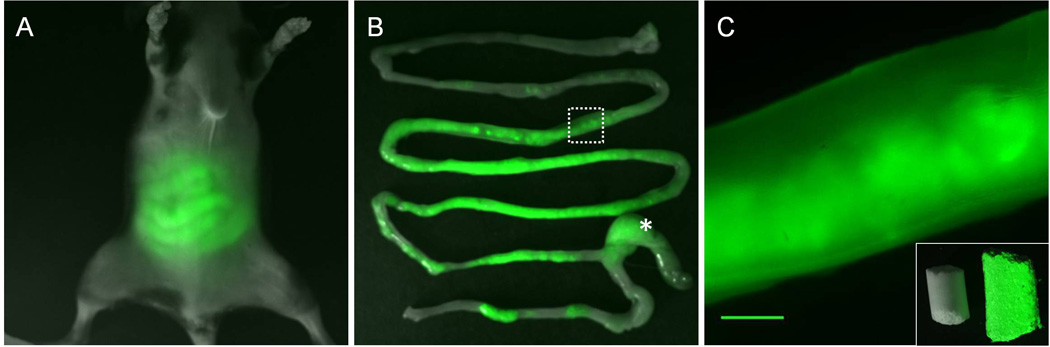
Overlay of white light and fluorescent images of a mouse (A) and of the excised whole GI tract (B). Asterisk, Cecum. (C) Magnified fluorescent image of the white rectangle in (B) showing autofluorescence produced by standard murine diet containing chlorophyll. Inset, overlay of white light and fluorescent images of chlorophyll free (left) and chlorophyll containing standard diet (right). Scale bar: 1mm.
Figure 2.
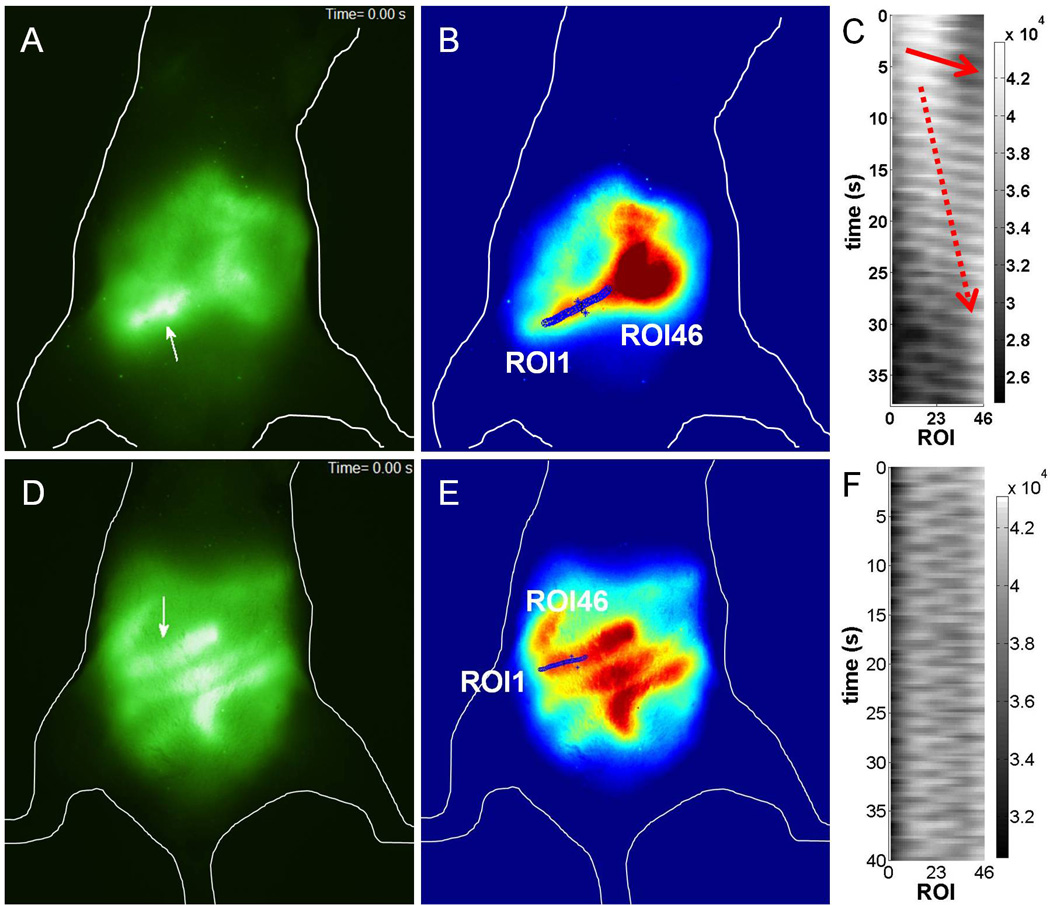
Fluorescent images of peristaltic motion in (A) a ventral view of a mouse and (B) after selection of 46 ROIs along the fluorescent small intestine. Arrow, location where peristaltic motion occurred. (C) 3-D plot of fluorescent intensity as a function of time and ROI showing the propagation of the contractile waves indicated by a red arrow. Fluorescent images of segmental motion in (E) a ventral view of a mouse and (F) after selection of 46 ROIs along the fluorescent small intestine. (G) 3-D spatio-temporal map of fluorescent intensity as a function of time and ROI demonstrating segmental motion (arrows).
4. Discussion
We successfully demonstrated for the first time, the ability to non-invasively and quantitatively image intestinal motions using autofluorescence induced by standard murine diet containing chlorophyll without administration of an exogenous imaging agent. However, we cannot measure the intestinal flow, since non-invasive fluorescence imaging of the intestines may not provide accurate information about the diameter of the intestines, due to the intense scattering of light by tissues. Thus, we only assessed the intestinal contractility. The fluorescence imaging system reported herein can easily be combined with a traditional, invasive video imaging method. Since intestinal contractile motions are influenced by pathological conditions (such as inflammatory bowel disease), this simple, but unexplored imaging technique using autofluorescence can be used as a tool to monitor disease progression and possibly therapeutic response, at least in preclinical studies. In addition, after reducing the chlorophyll fluorescence using chlorophyll free diets in mice, gastric and intestinal emptying can also be non-invasively and quantitatively imaged with use of regular murine diets containing chlorophyll. Furthermore, dynamic red autofluorescence imaging can be used with NIRF imaging using a NIR fluorescent molecular imaging agent specifically targeted to GI disease markers.
Supplementary Material
Supplemental movie 1. Movie from a series of static fluorescent images, depicting peristaltic contractility of the small intestine.
Supplemental movie 2. Movie from a series of static fluorescent images, depicting segmental contractility of the small intestine.
Acknowledgements
We would like to acknowledge Dr. Philip King at University of Michigan for kindly providing rasa1 fl/fl mice. We thank Holly Robinson and Dr. Norman W. Weisbrodt for technical assistance and for helpful comments on intestinal contractility, respectively. We also thank reviewers for their constructive comments. This work was supported in parts by a pilot/feasibility grant from NIH/National Institute of Diabetes and Digestive and Kidney Disease, Center Grant P30 DK56338 (S.K), R01 CA128919 (E.M.S) and U54 CA136404 (E.M.S).
Footnotes
Author contributions
S.K.: study concept and design; acquisition of data; analysis and interpretation of data; drafting of the manuscript. C.D.: analysis of data. E.S.: study supervision; critical revision of the manuscript for intellectual content.
Competing Interests: The authors have no competing interests.
References
- 1.Weagle G, Paterson PE, Kennedy J, Pottier R. The nature of the chromophore responsible for naturally occurring fluorescence in mouse skin. J Photochem Photobiol B. 1988;2:313–320. doi: 10.1016/1011-1344(88)85051-6. [DOI] [PubMed] [Google Scholar]
- 2.Troy T, Jekic-McMullen D, Sambucetti L, Rice B. Quantitative comparison of the sensitivity of detection of fluorescent and bioluminescent reporters in animal models. Mol Imaging. 2004;3:9–23. doi: 10.1162/15353500200403196. [DOI] [PubMed] [Google Scholar]
- 3.Inoue Y, Izawa K, Kiryu S, Tojo A, Ohtomo K. Diet and abdominal autofluorescence detected by in vivo fluorescence imaging of living mice. Mol Imaging. 2008;7:21–27. [PubMed] [Google Scholar]
- 4.Bouchard MB, MacLaurin SA, Dwyer PJ, Mansfield J, Levenson R, Krucker T. Technical considerations in longitudinal multispectral small animal molecular imaging. J Biomed Opt. 2007;12:051601. doi: 10.1117/1.2799188. [DOI] [PubMed] [Google Scholar]
- 5.Adams KE, Rasmussen JC, Darne C, et al. Direct evidence of lymphatic function improvement after advanced pneumatic compression device treatment of lymphedema. Biomed Opt Express. 2010;1:114–125. doi: 10.1364/BOE.1.000114. [DOI] [PMC free article] [PubMed] [Google Scholar]
- 6.Bercik P, Wang L, Verdu EF, et al. Visceral hyperalgesia and intestinal dysmotility in a mouse model of postinfective gut dysfunction. Gastroenterology. 2004;127:179–187. doi: 10.1053/j.gastro.2004.04.006. [DOI] [PubMed] [Google Scholar]
- 7.Der T, Bercik P, Donnelly G, et al. Interstitial cells of cajal and inflammation-induced motor dysfunction in the mouse small intestine. Gastroenterology. 2000;119:1590–1599. doi: 10.1053/gast.2000.20221. [DOI] [PubMed] [Google Scholar]
- 8.Der-Silaphet T, Malysz J, Hagel S, Larry Arsenault A, Huizinga JD. Interstitial cells of cajal direct normal propulsive contractile activity in the mouse small intestine. Gastroenterology. 1998;114:724–736. doi: 10.1016/s0016-5085(98)70586-4. [DOI] [PubMed] [Google Scholar]
- 9.Ailiani AC, Neuberger T, Brasseur JG, et al. Quantitative analysis of peristaltic and segmental motion in vivo in the rat small intestine using dynamic MRI. Magn Reson Med. 2009;62:116–126. doi: 10.1002/mrm.21982. [DOI] [PubMed] [Google Scholar]
- 10.Kwon S, Sevick-Muraca EM. Non-invasive, dynamic imaging of murine intestinal motility. Neurogastroenterol Motil. 2011;23 doi: 10.1111/j.1365-2982.2011.01736.x. 881-e344. [DOI] [PMC free article] [PubMed] [Google Scholar]
- 11.Lapinski PE, Bauler TJ, Brown EJ, Hughes ED, Saunders TL, King PD. Generation of mice with a conditional allele of the p120 Ras GTPase-activating protein. Genesis. 2007;45:762–767. doi: 10.1002/dvg.20354. [DOI] [PubMed] [Google Scholar]
- 12.Kwon S, Sevick-Muraca EM. Mouse phenotyping with near-infrared fluorescence lymphatic imaging. Biomed Opt Express. 2011;2:1403–1411. doi: 10.1364/BOE.2.001403. [DOI] [PMC free article] [PubMed] [Google Scholar]
Associated Data
This section collects any data citations, data availability statements, or supplementary materials included in this article.
Supplementary Materials
Supplemental movie 1. Movie from a series of static fluorescent images, depicting peristaltic contractility of the small intestine.
Supplemental movie 2. Movie from a series of static fluorescent images, depicting segmental contractility of the small intestine.