

Abstract
Residue contacts predicted from correlated positions in a multiple sequence alignment are often sparse and uncertain. To some extent, these limitations in the data can be overcome by grouping the contacts by secondary structure elements and enumerating the possible packing arrangements of these elements in a combinatorial manner. Strong interactions appear frequently but inconsistent interactions are down-weighted and missing interactions up-weighted. The resulting improved consistency in the predicted interactions has allowed the method to be successfully applied to proteins up to 200 residues in length which is larger than any structure previously predicted using sequence data alone.
Keywords: protein fold recognition, decoy models, correlated mutations, residue contact prediction
Introduction
The prediction of protein structure from sequence data is a computational problem that has been pursued over many years, employing a wide variety of methods.1 One early approach that met with some limited success was to combinatorially enumerate different folds and evaluate the resulting models using basic principles of protein structure.2, 3 While not being a pure ab initio (physico-chemical) method, the combinatorial search over a fold-space had the advantage that it did not include any information from known protein structures, either in the form of empirical potentials or more directly in the form of structural fragments.4–6 Despite more recent refinements,7, 8 the combinatorial approach was limited to protein structures under 150 residues and beyond this the possible combinations, while still simple to enumerate, cannot be distinguished by the generic measures used to evaluate them.
To improve the identification of the correct models, measures based on residue covariance have been used9, 10 which it was hoped would provide even just a few specific constraints that would limit the possible solutions to a small number, ideally one, including the native (true) fold. Previously, such attempts were hindered, principally, by a lack of sequence data; however, with the recent acceleration in the accumulation of known sequences, this limitation is becoming less of a restriction. Recent attempts to use residue covariation have been based on families of many sequences11 and have met with greatly improved success.12
Although the accuracy of contacts predicted from correlated positions has improved, their distribution throughout any particular structure can be uneven which can lead to poorly constrained or unconstrained regions in the constructed model. In this article, we describe a method that allows the distribution of predicted contacts to be refined to anticipate missing constraints.
Results and Discussion
Overview of the methods with a “worked” example
Starting from a single (target) sequence, the PLATO server7 generates many thousands of models. This process, which is outlined in Figure 1, begins with a multiple sequence alignment for the protein family which is either compiled automatically or taken from a collection. The full alignment is used to calculate predicted residue contacts from correlated positions (as described in the Methods section) and in addition, a smaller more diverse subset of sequences is used for secondary structure prediction. As these predictions seldom agree exactly, all variations are considered as a basis for model construction. The numbers of predicted β-strands and α-helices are used to select fragments of idealized secondary structure lattices that could support them. For example: 5 strands and 5 helices could be allocated as 2 α's above and 3 α's below a 5-stranded sheet or 1 α above and 4 below. These “architectures” of unconnected secondary elements are represented as 2-5-3 and 1-5-4. Adding a third dimension (with a twist) develops these abstract representations into 3D “stick” models which are used to enumerate (almost) all possible chain paths (folds) over the framework. As the number of folds can reach many thousands, simple “rules” are employed to limit their numbers by avoiding loop crossovers and left-hand connections. The remaining folds, typically 1000, are ranked on generic structural properties, such as hydrophobic burial. In the current work, we also include a component from the predicted residue contacts to score and rank the models. From the initial ranking, called the “full list,” the top 500 models (called the “best list”) were re-ranked on just the degree of matching found for the predicted contacts. In the results presented below, we examine the top scoring folds in both the full and best lists along with the top folds in the re-ranked best-list as this ranking gives greater emphasis to these more specific contact data, having excluded models that were poorly constructed. Before considering the overall results, we will illustrate the process by considering one protein in detail.
Figure 1.
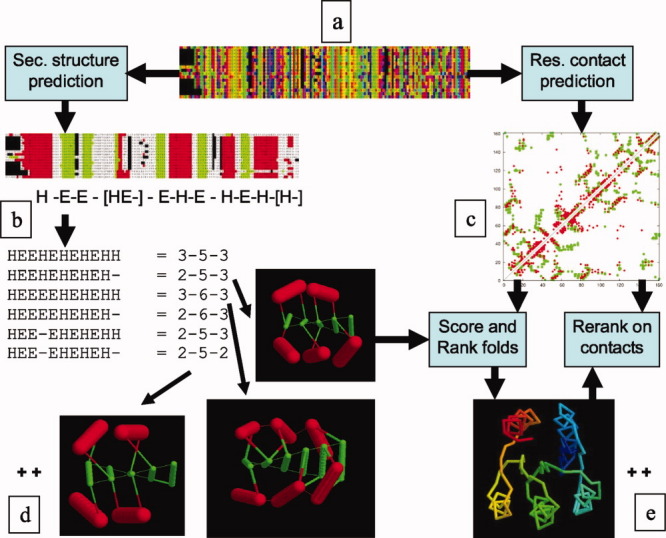
Data flow in PLATO. A multiple sequence alignment (colored by amino acid type) [a] is used to predict secondary structure elements (SSEs, H = α, E = β) [b] and residue contacts [c]. From the variation in the SSEs, combinations are generated by permuting the type of the ambiguous elements (in brackets) and each is mapped to a set of idealized architectures (called Forms) which are identified by the number of SSEs in each layer above, in and below the β-sheet. The structures of three Forms are selected as examples (2-5-3, 3-6-3, and 2-5-2) but typically many hundreds are used in practice [d]. For each Form, the SSE “sticks” (red = α, green = β) are connected in all possible ways consistent with the predicted order of SSEs and some simple topological and geometric rules, giving rise to many thousands of folds. Each fold is scored by general principles of protein structure and, in addition, by the predicted contacts, giving rise to a set of ranked folds, only one of which is shown [e]. The top 500 folds are then re-ranked on the predicted contacts alone which are shown in the “dot-plot” where red dots are predicted and green dots are observed contacts.
Figure 2(a) shows the multiple sequence alignment for the MnmE G-domain (2gj8A) which is a member of the Ras G-protein superfamily but with an additional edge β-strand. From this, the secondary structure is predicted and summarized as H (α) and E (β). The third element, however, is ambiguous and could be either α or β. The folds generated when this secondary structure element (SSE) is taken as α tend to be Rossmann-like, following the alternating αβ pattern [Fig. 2(b)] whereas when taken as a β-strand, Ras-like folds are made [Fig. 2(c)]. The more regular Rossmann pattern scores best in the initial ranking (full and best lists), however the contact map (Fig. 1) contains a clear β-hairpin between the 4th and 5th elements (seen as an anti-diagonal bar around residue 50) and pairings of the first strand that are not consistent with a Rossmann-like fold. Taking greater account of these in the re-ranked list gives preference to the correct Ras-like fold.
Figure 2.

Example application to 2gj8A. (a) A multiple sequence alignment leads to predicted SSEs with the 4th element predicted as half α (red, H) and half β (green, E). Of the two smallest β strands, marked with an “e,” the first is not seen in the native structure and the second is not typical of the superfamily. Given 7 or 8 strands with 4 or 5 helices, the top scoring folds constructed by PLATO were based on 2-7-3 and 2-8-2 Forms with the top scoring (incorrect) fold shown in (b) as a topology diagram (α = circle, β = triangle with up being towards and down away from the viewer). However, for reasons discussed in the text, re-ranking with just the contact data gave preference to the more correct fold shown in (c). This differs from the native topology only in the addition of a short edge-strand (small triangle) which does not affect the remaining topology. The SSEs in each topology diagram are labeled with a simple coordinate with A, B, a designating the upper α, β and lower α layers, respectively, followed by a number giving the SSE position relative to the first element in the layer and prefixed by a sign with “+” = towards and “−“ = away directions. When read in sequence, these coordinates constitute the “topology strings” used below to summarize protein folds. (The fold in (c) = +B+0.−A+0.+B−3. −B−2.+B−1. −a+0.+B+1. −a+1.+B+2. −B+4.+B+3. −A+1.). Parts (d) and (e) show the superposition of the two models on the native structure colored from red for close similarity to blue for weak similarity. By RMSD, the models are almost indistinguishable (7.8/157 and 7.4/155, Angstroms/residues) which illustrates that RMSD is a poor indicator of topological equivalance [Hollup et al. (2011) Comp Biol Chem 35:174–188). However, a good match (yellow–red) can be seen across all six core strands in the model with the correct topology (e) whereas the left side of the model in (d) is all blue–green indicating weak or no similarity. The models are in the same orientation as their corresponding topology diagrams in parts (b) and (c). [Color figure can be viewed in the online issue, which is available at wileyonlinelibrary.com.]
“Training” test set
The method was applied to the five proteins that have been used previously. Although these are described as a training set, there is no component in the current method that has the capacity for memorizing structure but since the current protocol has been developed with these proteins, they do not constitute an independent sample. The earlier version of our method had produced good results with these proteins and in this section, we check that the current changes to the method do not result in any deterioration in performance.
The results for the five “training” proteins are shown in Table I where it can be seen that the selection of the true folds dominate the top ranked positions with roughly 50% of the folds being correct in the top 10–20 ranked models. This is an improvement over the previous results. The combined packing/contact score gave the best results, with little gain being made by re-ranking the best list using just the predicted contacts. In the absence of predicted contact data, only the Chey-Y like protein (3chyA, 128 residues) had any correct folds in the top 20 ranked models.
Table I.
Fold Recognition Over the “training” Decoy Sets
| Number of decoy models | Full list true folds in | Best list true folds in | Reranked best true folds in | |||||
|---|---|---|---|---|---|---|---|---|
| PDB code | Full | Best | Top 10 | Top 20 | Top 10 | Top 20 | Top 10 | Top 20 |
| 2trx | 11,478 | 1633 | 8 | 14 | 8 | 14 | 6 | 13 |
| 1coz | 3892 | 616 | 2 | 2 | 2 | 3 | 0 | 0 |
| 3chy | 6821 | 1123 | 10 | 20 | 10 | 20 | 10 | 18 |
| 1f4p | 7767 | 1396 | 8 | 10 | 8 | 10 | 4 | 5 |
| 5p21 | 17,417 | 2497 | 4 | 6 | 6 | 12 | 8 | 12 |
Target test set
The protocol outlined in the Methods section was applied to the proteins in the target set without any alteration from their application to the “training” set. All that was given to the automatic protocol was the sequence of the target protein and the non-redundant protein sequence data collection from which a multiple sequence alignment was compiled and used without intervention. The results of these runs are summarized below in which the true topology is represented as a string (see Table II for a summary and Supporting Information for structure superpositions and Fig. 2 for an interpretation of the topology strings). In the absence of contact data, the correct fold did not appear in the top 20 ranked models for any of the proteins considered below except 3guvA.
Table II.
Fold Recognition Over the Test Decoy Sets
| Number of decoy models | Full list true folds in | best list true folds in | Reranked best true folds in | |||||
|---|---|---|---|---|---|---|---|---|
| PDB code | Full | Best | Top 10 | Top 20 | Top 10 | Top 20 | Top 10 | Top 20 |
| 2r4q | 7836 | 1355 | 4 | 8 | 4 | 8 | 10 | 16 |
| 1l1s | 2337 | 857 | 0 | 1 | 0 | 2 | 3 | 3 |
| 3guv | 11,695 | 1982 | 10 | 20 | 10 | 20 | 10 | 19 |
| 2gj8 | 42,040 | 1915 | 0 | 0 | 0 | 0 | 10 | 20 |
| 2amj | 4313 | 931 | 4 | 4 | 6 | 6 | 0 | 0 |
| 2opi | 2374 | 1044 | 0 | 0 | 0 | 0 | 1 | 1 |
A domain of fruA from Bacillus subtilis
2r4qA (102) = +B+0.−A+0.+B−1.−a+0.+B+1.+B+2.−A+1
The top scoring folds under all ranking schemes had the correct β-sheet topology for this protein but under the combined packing/contact score, the terminal helix was flipped. Re-ranking the best list by just the contact score brought the correct fold at the top.
Ginkbilobin-2, an antifungal protein from Ginkgo biloba
3a2eA (108) = +B+0.−A+0.+B+4.−B+3.+A−1.−B+1.+B+2
The PLATO server made many models with the correct 0-5-2 architecture* for this protein but the native protein contains a left-handed βαβ connection combined with a pair of crossing loops, both of which are filtered-out by PLATO.
A protein of unknown function MTH1491 from Methanobacterium thermoautotrophicum
1l1sA (111) = +B+0.−A+0.+B−1.−A−1.+B−2.+B−3.−a+0.+B+1
Ranked on the combined score, the top models were based on a small Form with 1-3-2 architecture and despite having the correct overall fold, the edge strands and some helices were poorly constrained. The re-ranked best list however had a model with the more complete 1-5-2 Form in top position with the correct fold.
A resolvase family site-specific recombinase from Streptococcus pneumoniae
3guvA (149) =+B+0.−A+0.+B−1.−a+0.+B+1.−a+1.+B+2.(−A+1)
Under all rankings, the top folds corresponded to the native with the exception of the orientation of the long terminal α-helix, which does not pack on the β-sheet but forms a coiled-coil in the dimeric native structure. Excluding this helix after the chain break in the structure (leaving 121 residues) the top models were all correct.
The MnmE G-domain from Escherichia coli
2gj8A] (161) = +B+0. −A+0.−B−2.+B−1.−a+0.+B+1.−a+1.+B+2.−B+4.+B+3.−-A+1
The top models under the combined score were a good approximations to this Ras-like protein except that the irregular amino terminal edge of the domain had been predicted in a more regular (Rossmann-like) way. The re-ranked best list, however, reproduced the Ras-type topology on this edge with the one slight deviation of linking an exposed loop as a short extra strand on the edge of the sheet.
A modulator of drug activity B from Escherichia coli
2amjA (180) = +B+0.−A+0.+B−1.−a+0.+B+1.−a+1.+B+2.−a+2.+B+3.−A+1
The same model was ranked top in both the full and best lists and had the correct fold. The top folds in the re-ranked best list, however, all included an extra edge strand resulting in a rearrangement on the C-terminal edge of the domain with the correct fold being displaced to rank 60.
A putative Zn-dependent hydrolase of the metallo-β-lactamase superfamily from Thermotoga maritima
1vjnA (194)
Unlike the proteins considered above, 1vjnA has two β-sheets, forming a three-layer ββα architecture (0−6+7−3), with a helix on the empty face bringing it close to a 4-layer architecture. The PLATO server considered all three and four layer Forms with the dominant selections being the 4-layer αββα architecture, resulting from the prediction of the helix and some other loops as α-helices. The combinations of almost 20 secondary structure elements over this size of Form are “astronomic” and the correct fold was not found.
l-Fuculose-1-phosphate aldolase from Bacteroides thetaiotaomicron
1opiA (202) = −A+0.+B+0.−B−1.+B−2.+a+0.−B+1.−A+2.+B+4.−a+1.−B+2.+B+3.−A+1
The same fold was top of both the full and best list and was a good approximation to the native fold with the exception of a swap between the first and third (edge) β-strands. Although this seems reasonable on the basis of their relative hydrophobicity, the predicted contacts linked the first strand to deeper SSEs and in the re-ranked topology the top fold corresponded to the native.
Conclusions
The prediction of protein topology using predicted contacts has allowed the application of the combinatoric method to identify the fold of proteins up to 200 residues in length—well above anything that has been achieved previously from sequence data alone, which includes fragment-based methods and the PLATO method itself. Above 200 residues, success was only partial and further improvement in the methods will be required, including a more detailed analysis of the balance between the contributions of the generic packing and the specific contacts. Rather than over-optimize such features in the current work, we have presented the results for both protocols which indicate a preference towards placing a greater emphasis on the predicted contacts. In its current form the method has some practical limitations that can be overcome by refinement, however, a more fundamental limitation is the extent to which structural constraints can be extracted from the multiple sequence alignment and before any refinements are implemented, additional effort will be directed to improving the prediction of the underlying residue contact data.
Methods
Residue contact prediction
Residue contacts were predicted by sparse inverse covariance matrix estimation, an improvement of our previous technique of calculating the full matrix inverse of the mutual information matrix.12, 13 Covariance matrices were estimated from multiple sequence alignments generated using iterated HMM searches and inverted using the graphical Lasso method,14 essentially as described in Jones et al (2011).15 Our version of the method differs in a few minor respects: the choice of regularization parameters (rho = 0.001 was used for off-diagonal elements, rho = 1.0 for diagonal elements) and we did not apply shrinkage.
Secondary structure prediction
The prediction of SSEs followed that implemented in the PLATO server7 (Fig. 1), which applies PSIPRED16 to a diverse alignment of around 15 sequences, generating a set of prediction variations. In the current application, these were augmented by the prediction of secondary structure from the predicted contacts. Any contact between residues i and i+4 is indicative of an α-helix but can also arise from non-hydrogen bonded contacts in a more general coil region. To implement these biases, the strength of each contact was summed over its i...i+4 span and the resulting profile used to bias the PSIPRED predictions.
The values of the 1,4 contact profile were set to have zero mean and the propensity to predict each structure type was altered by shifting the level of the PLATO scores by a factor w for α, w/2 for coil and −w/2 for β structure. The size of the scaling factor w was determined empirically to have a value commensurate with the RMS range of the PSIPRED values, giving a marked, but not dominating, contribution to the predictions. The resulting set of modified predictions was then added to the original predictions with the removal of any that were unmodified.
Secondary structure packing
Despite the improvements in the data processing described in the previous section, the accuracy of the contact prediction at the level of residue interaction remains only around 50% over the number of contacts expected in a small protein (around 300–500). To reduce sensitivity to accuracy at this level, it was found that the analysis of contacts at the level of SSEs led to in improvement in fold recognition.13 This method grouped the contacts associated with a SSE pair into an overall interaction strength and an orientation component based on the asymmetry of residue interactions between the amino and carboxy halves of the two SSEs. Of these measures, the interaction strength is the more robust but the orientation is often very clear for strongly interacting pairs of long SSEs.
Bipartite graph matching
The problem of mapping a set of secondary structure interactions onto a given three dimensional structure is isomorphic with the comparison of two protein structures where the connectivity of one chain is unknown.17 When the connectivity of both chains is known, then a variation of the dynamic programming algorithm, termed double dynamic programming (DDP), can be used to find a good solution as a path through the matrix.18 Without any chain connectivity, then an intuitive “greedy” algorithm would be to match the strongest pair as measured by the similarity of their interactions, then pick the second strongest and so on until all pairings are made. A more robust and less greedy implementation of this approach is the stable marriage algorithm (SMA).
The SMA was applied in a similar manner to dynamic programming in the DDP algorithm: given that SSEs m and n are equivalent, then how similar are their interactions? Say, helix m has a strong packing with helix i in the predicted contact matrix and we know that helix n packs with helix j in the structure, then a matrix is constructed in which position i, j has a high value. When all i, j level pairs are calculated, the SMA identifies the best match-up of pairs to give the highest score which provides a guide to how good the original pairing was of m with n. The process is repeated for all m and n and as with DDP, the resulting high-level matrix could be presented again to the SMA to extract the final pairings. However, as this considers only pairwise information the evaluation of packing between all established pairings was used to assess the selection of the next pairing.
Packing consistency refinement
Application of the double stable marriage (DSM) algorithm described above to SSE contact data and a secondary structure lattice (“stick” model) will produce a single unique highest scoring solution but because the stick model has several equivalent pairings, there will be equally many solutions with scores that are almost as good. To get a reasonable sample over these, we ran the DSM algorithm 100 times with a small random component (±5%) added to each pair interaction at the low-level. The resulting set of pairings were then re-scored using a combination of a sum of their pair-wise interactions, their predicted exposure (by PLATO) and the length of the chain path. This combined score was used to weight the observed SSE interactions and their connections over the stick lattice into a weighted sum over the 100 trials.
Protein data
“Training” test set
The set of five proteins used previously12 was employed again in the current work to provide a direct comparison with the earlier results.
Target test set
Proteins in PFAM were considered in order of decreasing family size and any all-alpha, repetitive or multi-domain proteins were excluded, along with any that were less than 100 residues in length.
The predicted contact data can be found in the Supporting Information.
Footnotes
By “architecture” we mean the number of undirected, unconnected SSE ‘sticks’ in layers. For three layers these are summarized as α-β-α or if there are two β-sheets, as α-β+β-α. Any outer layer count can be zero (see Figure 1).
Supplementary material
Additional Supporting Information may be found in the online version of this article.
References
- 1.Baker D, Taylor WR. Ab initio structure prediction. In: Subramanian S, editor. Encyclopedia of genetics, genomics, proteomics and bioinformatics, Vol. 7: Bioinformatics. Chichester, UK: Wiley; 2005. pp. 3245–3251. [Google Scholar]
- 2.Cohen FE, Sternberg MJE, Taylor WR. Analysis and prediction of protein b-sheet structures by a combinatorial approach. Nature. 1980;285:378–382. doi: 10.1038/285378a0. [DOI] [PubMed] [Google Scholar]
- 3.Cohen FE, Sternberg MJE, Taylor WR. Analysis and prediction of the packing of a-helices against a β-sheet in the tertiary structure of globular proteins. J Mol Biol. 1982;156:821–862. doi: 10.1016/0022-2836(82)90144-9. [DOI] [PubMed] [Google Scholar]
- 4.Jones DT. Predicting novel protein folds by using FRAGFOLD. Proteins. 2001;45(Suppl. 5):127–132. doi: 10.1002/prot.1171. [DOI] [PubMed] [Google Scholar]
- 5.Bradley P, Misura KMS, Baker D. Toward high-resolution de novo structure prediction for small proteins. Science. 2005;309:1868–1871. doi: 10.1126/science.1113801. [DOI] [PubMed] [Google Scholar]
- 6.Zhang Y, Skolnick J. The protein structure prediction problem could be solved using the current PDB library. Proc Natl Acad Sci USA. 2005;102:1029–1034. doi: 10.1073/pnas.0407152101. [DOI] [PMC free article] [PubMed] [Google Scholar]
- 7.Taylor WR, Bartlett GJ, Chelliah V, Klose D, Lin K, Sheldon T, Jonassen I. Prediction of protein structure from ideal forms. Proteins. 2008;70:1610–1619. doi: 10.1002/prot.21913. [DOI] [PubMed] [Google Scholar]
- 8.Taylor WR, Hollup SM, MacDonald JT, Jonassen I. Probing the “dark matter” of protein fold-space. Structure. 2009;17:1244–1252. doi: 10.1016/j.str.2009.07.012. [DOI] [PubMed] [Google Scholar]
- 9.Taylor WR, Hatrick K. Compensating changes in protein multiple sequence alignments. Protein Eng. 1994;7:341–348. doi: 10.1093/protein/7.3.341. [DOI] [PubMed] [Google Scholar]
- 10.Pollock DD, Taylor WR, Goldman N. Coevolving protein residues: maximum likelihood identification and relationship to structure. J Mol Biol. 1999;287:187–198. doi: 10.1006/jmbi.1998.2601. [DOI] [PubMed] [Google Scholar]
- 11.Bartlett GJ, Taylor WR. Using scores derived from statistical coupling analysis to distinguish correct and incorrect folds in de-novo protein structure prediction. Proteins. 2008;71:950–959. doi: 10.1002/prot.21779. [DOI] [PubMed] [Google Scholar]
- 12.Sadowski MI, Maksimiak K, Taylor WR. Direct correlation analysis improves fold recognition. Comput Biol Chem. 2011;35:323–332. doi: 10.1016/j.compbiolchem.2011.08.002. [DOI] [PMC free article] [PubMed] [Google Scholar]
- 13.Taylor WR, Sadowski MI. Structural constraints on the covariance matrix derived from multiple aligned protein sequences. PLoS-one. 2011 doi: 10.1371/journal.pone.0028265. http://dx.plos.org/10.1371/journal.pone.0028265. [DOI] [PMC free article] [PubMed] [Google Scholar]
- 14.Friedman J, Hastie T, Tibshirani R. Sparse inverse covariance estimation with the graphical lasso. Biostatistics. 2008;9:432–441. doi: 10.1093/biostatistics/kxm045. [DOI] [PMC free article] [PubMed] [Google Scholar]
- 15.Jones DT, Buchan WA, Cozzetto D, Pontil M. PSICOV: precise structural contact prediction using sparse invariance covariance estimation on large multiple sequence alignments. Bioinformatics. 2011 doi: 10.1093/bioinformatics/btr638. Epub ahead of print. doi: 10.1093/bioinformatics/btr638. [DOI] [PubMed] [Google Scholar]
- 16.Jones DT. The PSIPRED protein structure prediction server. Bioinformatics. 2000;16:404–405. doi: 10.1093/bioinformatics/16.4.404. [DOI] [PubMed] [Google Scholar]
- 17.Taylor WR. Protein structure comparison using bipartite graph matching. Mol Cell Proteomics. 2002;1:334–339. doi: 10.1074/mcp.t200001-mcp200. [DOI] [PubMed] [Google Scholar]
- 18.Taylor WR. Protein structure alignment using iterated double dynamic programming. Protein Sci. 1999;8:654–665. doi: 10.1110/ps.8.3.654. [DOI] [PMC free article] [PubMed] [Google Scholar]
Associated Data
This section collects any data citations, data availability statements, or supplementary materials included in this article.