

Abstract
Mercury is a potent toxicant of concern to both the general public and occupationally exposed workers (e.g., dentists). Recent studies suggest that several genes mediating the toxicokinetics of mercury are polymorphic in humans and may influence inter-individual variability in mercury accumulation. This work hypothesizes that polymorphisms in key glutathione synthesizing enzyme, glutathione s-transferase, and selenoprotein genes underlie inter-individual differences in mercury body burden as assessed by analytical mercury measurement in urine and hair, biomarkers of elemental mercury and methylmercury, respectively. Urine and hair samples were collected from a population of dental professionals (n=515), and total mercury content was measured. Average urine (1.06±1.24 ug/L) and hair mercury levels (0.49±0.63 ug/g) were similar to national U.S. population averages. Taqman assays were used to genotype DNA from buccal swab samples at 15 polymorphic sites in genes implicated in mercury metabolism. Linear regression modeling assessed the ability of polymorphisms to modify the relationship between mercury biomarker levels and exposure sources (e.g., amalgams, fish consumption). Five polymorphisms were significantly associated with urine mercury levels (GSTT1 deletion), hair mercury levels (GSTP1-105, GSTP1-114, GSS 5’), or both (SEPP1 3’UTR). Overall, this study suggests that polymorphisms in selenoproteins and glutathione-related genes may influence elimination of mercury in the urine and hair or mercury retention following exposures to elemental mercury (via dental amalgams) and methylmercury (via fish consumption).
Keywords: elemental mercury, methylmercury, polymorphism, gene-environment, selenoprotein, glutathione s-transferase
INTRODUCTION1
Mercury toxicokinetics and toxicodynamics are largely influenced by the chemical form of the metal. Though humans are exposed to mercury through a variety of sources (e.g. vaccines, thermostats, compact fluorescent lights), the main sources of elemental mercury (inorganic) and methylmercury (organic) exposure come from dental amalgams and fish consumption, respectively (ATSDR, 1999; Clarkson and Magos, 2006). Urine is commonly used to measure elemental mercury exposure and blood or hair to measure methylmercury exposure (Berglund et al., 2005; Clarkson et al., 2007). However, each biomarker shows tremendous inter-individual variation, and this complicates risk assessment. For example, mercury typically accumulates 250 times more in the hair than it does in the blood, though this ratio ranges widely among individuals (ATSDR, 1999; Berglund et al., 2005). The half-life of methylmercury in hair ranges from 33 to 120 days (Birke et al., 1972), and the half-life of inhaled elemental mercury ranges from 35-90 days in the whole body (Hursh et al., 1976). Failure to understand such inter-individual variation in the accumulation of mercury, its distribution to various biomarkers and its half-life in the body may lead to risk assessment decisions that fail to protect the most susceptible individuals.
Inter-individual variation in mercury biomarkers may be partly explained by genetic factors. For example, mercury is eliminated following conjugation with glutathione, a process that may involve glutathione s-transferases (GSTs; GST theta 1, GSTT1; GST mu 1, GSTM1; GST pi 1, GSTP1) and indirectly depends on enzymes of the glutathione synthesis and degradation pathways (glutamate-cysteine ligase catalytic and modifier submits, GCLC, GCLM; glutathione synthetase, GSS; glutathione reductase, GSR; γ-glutamyltransferase 1, GGT1) (Ballatori and Clarkson, 1985; Rooney 2007). Selenoproteins (e.g. selenoprotein pi 1, SEPP1; glutathione peroxidases, GPX) combat the oxidative stress created by mercury and bind the toxicant directly via selenocysteine residues (Chen et al., 2006). Genetic polymorphisms are ubiquitous among these glutathione and selenoprotein genes that facilitate the distribution, metabolism and elimination of mercury. As documented in recent epidemiological studies, such polymorphisms can influence mercury biomarker levels, which may ultimately improve understanding of inter-individual variability following exposure to methylmercury (Custodio et al., 2004; Engström et al., 2008; Gundacker et al., 2007, 2009) and elemental mercury (Custodio et al. 2005; Gundacker et al., 2009).
The aforementioned studies provide early evidence that genetic polymorphisms in key mercury handling genes may underlie differences in mercury distribution and accumulation in exposure biomarkers. However, discrepancies exist among the studies (see Table 1 for more details, including results of this study). For example, Custodio et al. (2004) found the minor allele (T) of the GSTP1-114 polymorphism (rs1138272) to be associated with increased blood mercury levels while Engström et al. (2008) found the opposite in subjects with higher fish consumption. Disparate findings may be related to differences between the studies in terms of biomarkers examined, statistical methodologies utilized, sources of mercury exposure, and polymorphism frequency. Here we aim to address these limitations and help improve understanding of gene-environment interactions influencing mercury biomarker levels by studying both forms of mercury (through analytical measurement of biomarkers in urine and hair), various sources of exposure (dental amalgams and fish as determined from surveys), and additional polymorphisms in glutathione-related (GSTT1, GSTM1, GSTP1, GSTM3, GGT1, GSS, GSR, GCLC, GCLM) and selenoprotein (SEPP1, GPX1, GPX4) genes in a group of dental professionals that are exposed to mercury via occupational and environmental routes. Polymorphisms in the listed genes, which are important in the metabolism and elimination of mercury, are hypothesized to affect individual susceptibility to elemental mercury and/or methylmercury accumulation in the body as assessed by urine and hair biomarkers.
Table 1.
Summary of results in studies assessing the association of genetic polymorphisms with mercury biomarker levels.
| Reference | Population | n | Hg Biomarkers | Exposure Sources | Polymorphis ms Assessed | Polymorphisms Significantly Associated with Higher Biomarker Hg Levels | Polymorphisms Significantly Associated with Lower Biomarker Hg Levels |
|---|---|---|---|---|---|---|---|
| This study | Michigan dental professionals | 208 to 482 | hair, urine | dental amalgam, fish | see Table 3 | Positive genotype by amalgam interaction in urine Hg: SEPP1 3’UTR CT/TT; positive genotype by fish Hg interaction in hair Hg model: GSS 5’ CG/GG | Ln(hair Hg) and GSTP1-105 G; Ln(urine Hg): GSTT1 -/-; negative main effect in urine Hg model: SEPP1 3’UTR T and GSTT1 -/-; negative main effect in hair Hg model: GSTP1-105 G and GSTP1-114 T; negative genotype by fish Hg interaction in hair Hg model: SEPP1 3’UTR T |
| Custodio et al., 2004 | Swedish adults | 365 | erythrocytes | fish | GCLC (rs17883901), GCLM (rs41303970), GSTP1-105, -114 (rs1695, rs1138272), GSTA1 (rs3957396), GSTT1 and GSTM1 deletion | GCLC T and/or GSTP1-114 T carriers had steeper regression of erythrocyte Hg on polyunsaturated fatty acids | |
| Custodio et al., 2005 | Ecuadorian gold miners and buyers | 309 | whole blood, plasma, urine | gold mining practices | GCLC, GCLM, GSTP1-105, GSTP1-114, GSTA1, GSTT1 and GSTM1 deletion | GCLM T and elevated blood, plasma, urine Hg in moderately exposed miners | |
| Gundacker et al., 2007 | Austrian students | 174 to 222 | whole blood, urine, hair | fish | GSTT1 and GSTM1 deletion | GSTT1/M1 deletions and hair Hg | |
| Engström et al., 2008 | Swedish adults | 292 | erythrocytes | fish | GCLC, GCLM, GSTP1-105, GSTP1-114 | GCLM TT and erythrocyte Hg (adjusted for polyunsaturated fatty acids) | GSTP1-105 G and/or GSTP1-114 T have less steep regression of erythrocyte Hg on polyunsaturated fatty acids |
| Gundacker et al., 2009 | Austrian students | 184 to 304 | whole blood, hair, urine | dental amalgam, fish | GCLC, GSTP1-105, GSTP1-114, GSTA1, GSTT1 and GSTM1 deletion, metallothionein SNPs | GSTP1-105 G and unadjusted median blood and hair Hg; in CATREG analysis on dichotomized Hg levels: GSTP1-114 T and/or GCLC T and hair Hg; GSTP1-114 T and/or GCLC T on blood Hg, near sig; GSTM1 deletion and/or GSTP1-105 G on hair Hg; GSTT1 deletion and GSTP1-114 T on Hair Hg | GSTA1 A and unadjusted median blood Hg |
MATERIALS AND METHODS
Study Population
A convenience sample of 515 dental professionals (dentists, hygienists, and other related professions) was recruited during the 2009 (n=231) and 2010 (n=284) Michigan Dental Association (MDA) Annual Conventions. Institutional Review Board (IRB) approval was obtained for this study from the University of Michigan (HUM00027621).
Survey Data
For each participant a self-administered survey provided information on subject demographics (e.g., age, gender, weight), occupational practices (e.g., hours worked per week, number of amalgams removed and placed per week), and personal exposures to elemental mercury (amalgams in subject’s mouth) and methylmercury (fish consumption). Subjects provided detailed information on fish consumption (e.g., portion size, type of fish, monthly consumption). Fish data were used to estimate a mercury intake variable (ug per kg body weight per day) using mercury concentration data from the U.S. Food and Drug Administration for each fish species (Bahnick et al., 1994; Mierzykowski et al., 2001; U.S. FDA).
Mercury Exposure Assessment
Spot urine samples, biomarkers of elemental mercury exposure, (>30 mL) were collected from each participant and stored frozen. Hair samples, biomarkers for methylmercury, (>10 mg) were cut from the occipital region of the scalp, and the first 2 cm of hair (proximal end) were used for measurement. Total mercury levels in urine and hair were measured using a direct mercury analyzer (DMA-80, Milestone Inc., CT) according to U.S. EPA Method 7473 as previously described (Basu et al., 2010; Paruchuri et al., 2010). Quality control measures included incorporating one blank, one replicate sample, and a certified reference material (CRM; hair: NIES Japan CRM#13; two urine CRMs: QMEQAS08U-01 and ClinChek; dogfish liver: DOLT, National Research Council Canada) in every batch of 10-15 samples. All samples exceeded the theoretical method detection limits, defined as 3x SD of blanks, (0.03 ug/L mercury for urine and 0.01 ug/g mercury for hair). Mean (±SD) recovery of mercury from CRMs was 94.4 ± 15.4%. Mean within day (3.1 ± 1.7%) and between day (6.7 ± 6.8%) variability of CRMs were similar to that of duplicated subject samples.
Genotype Analyses
To obtain DNA from buccal cells, subjects swabbed the inside of their cheeks with four cotton swabs for fifteen seconds each. Cotton swabs were stored at room temperature in 0.5 mL of buffer (100 mM sodium chloride, 10 mM Tris base, 10 mM EDTA, 0.5% sodium dodecyl sulfate with 0.1 mg/mL of Proteinase K, according to Min et al., 2006). DNA was purified from buccal cells using Promega SV Wizard Genomic DNA purification kits (Promega Corporation, Madison, WI), and DNA quantification was performed using PicoGreen reagent with relative fluorescence measured by a Perkin Elmer HTS 7000 Plus Bioassay Reader (Shelton, CT).
Over the two study years, fifteen polymorphisms were genotyped in glutathione s-transferases, glutathione synthesizing enzymes, and selenoproteins, but in a given study year ten or eleven polymorphisms were genotyped. Fourteen polymorphisms (rs1695, rs1138272, rs3877899, rs713041, rs7579, rs17883901, rs41303970, rs1050450, rs5751901, rs7483, rs3761144, rs1002149, rs2911678, GSTT1 deletion) were genotyped using Taqman Allelic Discrimination Assays (Applied Biosystems; Livak et al., 1995). Results were read and interpreted using an ABI 7700 (Carlsbad, CA). All primers and probes were pre-designed by Applied Biosystems except for the GSTT1 deletion genotyping which utilized primers and probes designed by Mordukhovich et al. (2009). The GSTM1 deletion polymorphism was genotyped in the 2009 samples using the PCR-based method of Lee et al. (2009). GSTT1 and GSTM1 genotyping resulted in two distinct groups: deletion homozygotes and individuals with at least one intact copy of the gene.
Statistical Analysis
All statistical analyses were performed using PASW Statistics v18 (Chicago, IL). The 2009 and 2010 data were grouped together given that demographics, mercury biomarker levels and exposures had similar distributions both years. In all analyses, mercury values were natural log-transformed to achieve normality. The influence of genetic polymorphisms, assuming additivity of variant alleles, on mercury biomarker levels (hair or urine) was studied via simple linear regression models with one ordinal variable per polymorphism (coded 1=major homozygote, 2=heterozygote, 3=minor homozygote) in each model. The association of genetics with urine mercury and hair mercury biomarkers adjusted for predictors was also assessed by multiple linear regression. Base models without genetic variables were first created. All variables (e.g., demographics, fish consumption, occupational exposures) were included in the base model, and insignificant variables (p>0.05) were removed via a manual backward selection process. Final base models consisted of significant predictors of hair or urine mercury (p<0.05 for parameter estimate) unless otherwise noted. The effect of genotype (main effect and interaction with each exposure predictor variable) was then assessed with separate models for each polymorphism. Models with separate dummy variables for heterozygotes and minor homozygotes and interaction terms for each were also run (data not shown). The effect estimates (magnitude, direction, significance) for genotype obtained from this method, which did not assume genetic additivity, were similar to results reported here.
According to the method of Levine and Fahy (1945), which has been shown to reduce variability of metal excretion associated with spot urine samples, urine mercury levels were adjusted for the mean specific gravity (1.017) of the study population (Mason and Calder, 1994). The linear regression models described were run with unadjusted and adjusted urine. Parameter estimates did not notably change and significance only changed in a few instances in specific gravity adjusted models. Unadjusted models are reported here unless otherwise noted. In all urine mercury models, eight subjects were excluded due to a history of kidney disease (lithiasis, pyelonephritis, and/or orthostatic proteinuria) that may have influenced urinary excretion of mercury.
RESULTS
Descriptive Statistics
The majority of the 515 participants provided urine (n=502) and hair (n=505). Subjects lacking both biomarker samples and demographic information were excluded (n=4). Sixty-one percent of all subjects were female, and the majority of the population (>90%) self-identified racially as Caucasian. Table 2 provides average (±SD) demographic and occupational variables for the total population and occupation-stratified population (dentists, n=243 vs. non-dentists, n=268). Genders were unequally distributed in the occupational groups as 24% of dentists were female compared to 95% of non-dentists (e.g., dental hygienists, dental assistants). Stratification of subjects into two occupational groups yielded significant differences (p<0.05) between the groups. On average, dentists were older, removed and placed more dental amalgams in the office, and had more amalgams in their own mouths compared with non-dentists.
Table 2.
Mean (SD) of key demographic and exposure variables in total population and occupation stratified populations.
| Total Population | Occupation Stratified | ||
|---|---|---|---|
| Dentists | Non-Dentists | ||
| n | 511 | 243 | 268 |
| % Female | 61.3 | 24.3 | 94.8 |
| BMI (kg/m2) | 26.4 (4.7) | 26.4 (4.0) | 26.5 (5.3) |
| Age (years) | 52.1 (12.1) | 56.1 (11.6) | 48.3 (11.2)b |
| Hours worked/ week (in past 6 months) | 27.9 (11.6) | 29.1 (11.1) | 27.0 (11.9)a |
| # Amalgam (personal) | 4.1 (4.1) | 4.6 (4.2) | 3.7 (3.9)a |
| # Amalgam placed/ week | 12.1 (25.8) | 20.4 (31.1) | 4.7 (16.7)b |
| # Amalgam removed/ week | 13.3 (23.1) | 23.2 (27.2) | 4.4 (13.4)b |
| Hg Intake (ug/kg body weight/day) | 0.08 (0.13) | 0.09 (0.14) | 0.08 (0.12) |
| Urine Hg (ug/L) | 1.04 (1.18) | 1.37 (1.3) | 0.75 (0.97)b |
| Hair Hg (ug/g) | 0.49 (0.63) | 0.69 (0.81) | 0.31 (0.33)b |
denote p-value <0.05 and <0.001, respectively, for ANOVA test comparing dentists and non-dentists. ANOVA comparing urine and hair Hg used natural log-transformed values.
Mercury Biomarkers
Average mercury biomarker levels are reported in Table 2. Urine mercury (mean ±SD, 1.04±1.18 ug/L; median 0.66 ug/L) ranged from 0.03 to 9.26 ug/L with a distribution resembling that of the U.S. population according to the National Health and Nutrition Examination Survey (NHANES 2003-2004, median 0.48 ug/L; CDC, 2009). Dentists had significantly higher urine mercury levels compared to non-dentists (1.37±1.3 ug/L vs. 0.75±0.97 ug/L; p<0.001 for ANOVA comparing natural log-transformed values). The distribution of hair mercury (0.49±0.63 ug/g; range 0.02 to 6.15 ug/g) also resembled NHANES data from 1999-2000 (mean 0.47 ug/g; McDowell et al., 2004). Dentists had significantly higher hair mercury levels compared to non-dentists (0.69±0.81 vs. 0.31±0.33 ug/g; p<0.001) even though the estimated mercury intake from fish consumption was not significantly different between the two groups.
Genotype and Mercury Biomarkers
All genotyped polymorphisms achieved Hardy-Weinburg Equilibrium. Minor allele frequencies (MAF) for each polymorphism were generally similar to HapMap reference Caucasian population MAFs (Table 3). In statistical models comparing mercury levels among genotype groups, all polymorphisms were divided into major homozygote, heterozygote, and minor homozygote groups with the exception of GSTM1 and GSTT1 deletion polymorphisms which were divided into two genotype groups (double deletion vs. at least one intact copy).
Table 3.
Genotype frequencies of 15 polymorphisms in glutathione S-transferases, glutathione synthesizing enzymes, and selenoproteins and simple linear regression assessing the influence of genotype on mean urine and hair Hg levels (natural log-transformed). Significant (p<0.05) β estimates (95% CI) for genotype are reported from models of urine Hg or hair Hg.
| Gene | db SNP ID | Alleles | SNP Details | n | Minor allele frequency | Urine Hg | Hair Hg |
|---|---|---|---|---|---|---|---|
|
| |||||||
| GSTP1 | rs1695 | A>G | 105 Ile>Val | 485a | 0.32 | -0.22(-0.36, -0.07) | |
| GSTP1 | rs1138272 | C>T | 114 Ala>Val | 475a | 0.08 | ||
| GCLM | rs41303970 | C>T | 5’ near gene | 481a | 0.19 | ||
| SEPP1 | rs3877899 | C>T | 234 Ala>Thr | 485a | 0.24 | ||
| SEPP1 | rs7579 | C>T | 3’ UTR | 479a | 0.28 | -0.16(-0.3, -0.02) | |
| GSTT1 | N/A | + > - | Deletion | 437a | 0.41 | -0.27(-0.52, -0.02) | |
| GPX1 | rs1050450 | C>T | 200 Pro>Leu | 223b | 0.28 | ||
| GPX4 | rs713041 | C>T | 3’ UTR | 226b | 0.45 | ||
| GCLC | rs17883901 | G>A | 5’ near gene | 230b | 0.08 | ||
| GSTM1 | N/A | -> + | Deletion | 209b | 0.32 | ||
| GGT1 | rs5751901 | T>C | intron | 251c | 0.36 | ||
| GSTM3 | rs7483 | G>A | 224 Val>Ile | 243c | 0.26 | ||
| GSS | rs3761144 | C>G | 5’ near gene | 255c | 0.40 | ||
| GSR | rs1002149 | G>T | 5’ near gene | 240c | 0.18 | ||
| GSR | rs2911678 | T>A | intron | 250c | 0.24 | ||
Genotyped in subjects recruited in 2009 and 2010.
Genotyped in subjects recruited in 2009 only.
Genotyped in subjects recruited in 2010 only.
Simple linear regression models were used to test the differences in mean natural log-transformed urine (ug/L) or hair (ug/g) mercury levels among genotype groups for each polymorphism. Three statistically significant findings emerged (β estimate (95% CI) reported in Table 3). Urine levels were lower among individuals with double deletion of GSTT1 compared to those with the intact gene (-0.27 (95% CI: -0.52, -0.02) ug/L change in ln(urine Hg) with GSTT1 deletion). Likewise, individuals with the T allele for SEPP1 3’UTR (rs7579) had lower urine mercury levels (-0.16 (95% CI: -0.3, -0.02) ug/L change in ln(urine Hg) with each T alelle). Hair mercury levels differed by GSTP1-105 (rs1695) genotype with minor homozygotes (GG) exhibiting the lowest hair mercury measurements (-0.22 (-0.36, -0.07) ug/g change in ln(hair Hg) with each G allele).
Linear Regression Modeling of Urine Biomarker
Linear regression was used to model natural log-transformed urine mercury levels with significant exposure variables. In the final base model, significant predictors were number of dental amalgams in the subjects’ mouth (‘amalgam’), amalgams removed or placed per week in the dental office (‘amalgam handled’, an ordinal variable), and occupation (dentist vs. non-dentist) (Table 4). The categories for ‘amalgam handled’ were defined as follows: reference (0 amalgams handled), low (1 to 20 per week), medium (21 to 45), and high (>45). The effect of genotype for each polymorphism was tested (main effect, interactions between genotype and the three exposure variables). For all models, only the interactions between genotype and ‘amalgam’ are reported here as amalgams were the dominant predictor of urine Hg levels. The number of subjects in each model ranged from 204 to 466 depending on the polymorphism; not all polymorphisms were genotyped both years, and some subjects did not provide adequate DNA to complete the genotyping.
Table 4.
Parameter estimates from models of natural log-transformed urine Hg levels (unadjusted and adjusted for specific gravity) with exposure predictor variables, genotype, and genotype-by-amalgam interactions. Models with polymorphisms that have significant genotype variable(s) in at least one urine model are reported. Beta coefficients (95% CI) are listed for each predictor variable. Statistically significant beta coefficients (p<0.05) are bolded.
| SNP | na | Adj. r2 | Amalgam | Amalgam Handledb | Non-Dentist | Genotype | Genotype* Amalgam |
|---|---|---|---|---|---|---|---|
| Base Model | 492 | 0.23 | 0.08 (0.06, 0.1) | 0.12 (0.04, 0.21) | -0.45 (-0.64, -0.25) | ||
| SEPP1 3’UTR | 240, 186, 35 | 0.25 | 0.03 (-0.03, 0.08) | 0.11 (0.03, 0.2) | -0.44 (-0.64, -0.24) | -0.26 (-0.43, -0.08) | 0.04 (0.01, 0.07) |
| GSTT1 deletion | 347, 71 | 0.24 | 0.08 (0.02, 0.15) | 0.12 (0.03, 0.21) | -0.4 (-0.6, - 0.19) | -0.18 (-0.48, 0.12) | 0 (-0.06, 0.05) |
|
| |||||||
| Sp. Gravity Adjusted Urine | |||||||
| Base Model | 491 | 0.22 | 0.07 (0.06, 0.09) | 0.09 (0.02, 0.16) | -0.28 (-0.44, -0.12) | ||
| SEPP1 3’UTR | 240, 186, 35 | 0.23 | 0.05 (0.01, 0.09) | 0.08 (0.01, 0.15) | -0.29 (-0.45, -0.12) | -0.09 (-0.24, 0.05) | 0.02 (-0.01, 0.04) |
| GSTT1 deletion | 347, 71 | 0.23 | 0.07 (0.02, 0.13) | 0.08 (0.01, 0.16) | -0.23 (-0.4, - 0.07) | -0.25 (-0.5, - 0.00) | 0 (-0.04, 0.05) |
Number of subjects in model in each genotype group. Gentoype groups are major homozygote, heterozygote, minor homozygote for SEPP1 3’UTR and gene present vs. double deletion for GSTT1.
Ordinal variable for number of amalgams removed and placed per week (see text for category cut-offs).
Urine mercury models with nominally significant (p<0.05) genotype (main effect or interaction) terms are reported in Table 4 (see Supplemental Table 1 for all urine models). Significant main effects of genotype were observed for SEPP1 3’UTR (β estimate (95% CI)=-0.26 (-0.43, -0.08) ug/L) and GSTT1 deletion (-0.25 (-0.5, -0.00) ug/L), though the latter was only observed when urine was first adjusted for specific gravity. A significant interaction was observed with SEPP1 3’UTR T alleles and personal amalgams (β (95% CI)=0.04 (0.01, 0.07) ug/L), though the interactions with amalgam handled and occupation were not significant (data not shown).
Linear Regression Modeling of Hair Biomarker
Hair mercury levels (ln-transformed) were modeled using statistical methods similar to urine mercury modeling. The final base model included the most significant predictor of hair Hg, ‘fish Hg’ (calculated ug Hg intake per kg body weight per day from fish consumption, β (95% CI)=3.62 (2.96, 4.28) ug/g, see Table 5). Addition of genotype into the model resulted in two genotypes with significant main effects (GSTP1-105, rs1695, β (95% CI)= -0.22 (-0.38, -0.06) ug/g; GSTP1-114, rs1138272, -0.31 (-0.6, -0.03) ug/g). Significant interactions between genotype and fish Hg were also observed in models with SEPP1 3’UTR and GSS 5’ (rs3761144). Individuals with the minor allele (T) of SEPP1 3’UTR accumulated less mercury in the hair per intake from fish consumption (β (95% CI)=-1.61(-2.82, -0.4) ug/g change in ln(hair Hg) with each T allele). The opposite relationship was observed with the minor allele of GSS 5’ (G) and fish Hg (1.88 (0.44, 3.31) ug/g change in ln(hair Hg) per G allele). To highlight the nature of these results, two scatterplots of hair mercury by mercury intake from fish (both ln-transformed) are shown stratified by SEPP1 3’UTR genotype (Figure 1a) and GSS 5’ genotype (Figure 1b). Significant results (main effect or genotype-by-exposure variable interactions) were not observed for any other polymorphism in the models of urine or hair mercury (see Supplemental Tables 1 and 2 for all urine and hair models).
Table 5.
Parameter estimates from models of natural log-transformed hair Hg levels with exposure variable (estimated mercury intake from fish consumption, ug per kg body weight per day), genotype, and genotype-by-fish Hg interactions. Models with significant genotype variables are reported. Beta coefficients (95% CI) are reported for each predictor variable. Statistically significant beta coefficients (p<0.05) are bolded.
| SNP | na | Adj. r2 | Fish Hg | Genotype | Genotype* Fish Hg |
|---|---|---|---|---|---|
|
| |||||
| Base Model | 503 | 0.19 | 3.62 (2.96, 4.28) | ||
| GSTP1-105 | 214, 216, 44 | 0.2 | 2.87 (0.95, 4.8) | -0.22 (-0.38, - 0.06) | 0.42 (-0.73, 1.57) |
| GSTP1-114 | 393, 69, 2 | 0.2 | 2.91 (0.74, 5.07) | -0.31 (-0.6, -0.03) | 0.67 (-1.05, 2.39) |
| SEPP1 3’UTR | 245, 188, 36 | 0.19 | 6.22 (4.14, 8.29) | 0.15 (-0.02, 0.32) | -1.61 (-2.82, -0.4) |
| GSS 5’ | 94, 111, 44 | 0.15 | 0.34 (-2.13, 2.81) | -0.15 (-0.35, 0.06) | 1.88 (0.44, 3.31) |
Number of subjects in model in each genotype group. Genotype groups are major homozygote, heterozygote, minor homozygote.
Figure 1.
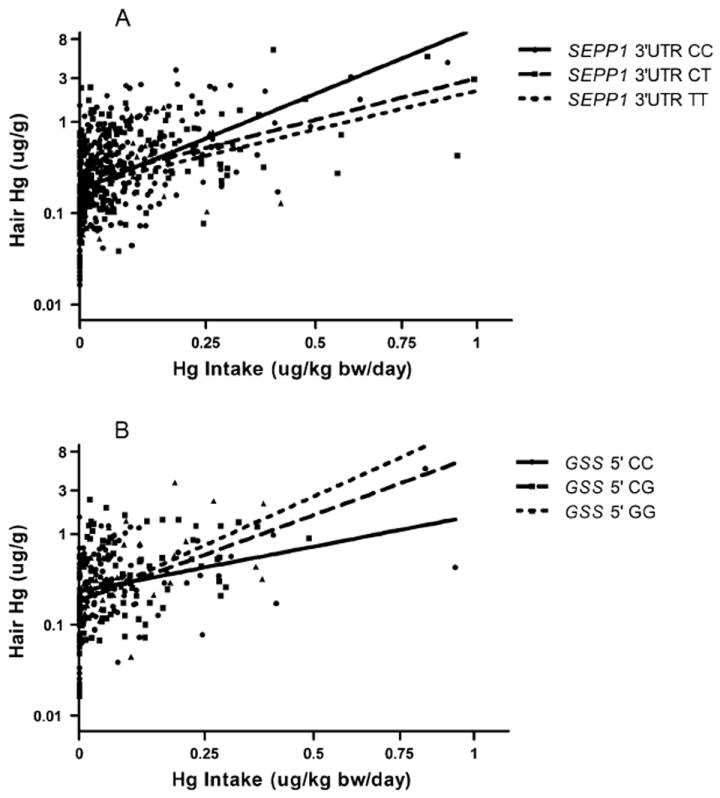
Modification of the relationship between Hg intake from fish consumption and hair Hg levels by a) SEPP1 3’UTR (C>T) genotype and b) GSS 5’ (C>G) genotype. Note: hair Hg and Hg intake are natural log-transformed, though axes are labeled with untransformed units for ease of interpretation.
DISCUSSION
Recent epidemiological studies suggest that seven genetic polymorphisms in GSTs and glutathione synthesizing enzymes may influence mercury accumulation in common biomarkers (hair, blood, urine) following exposure to elemental mercury or methylmercury (Custodio et al., 2004, 2005; Engström et al., 2008; Gundacker et al., 2007, 2009). Here, we build upon these studies and assess the influence of fifteen polymorphisms in GSTs, glutathione synthesizing enzymes and selenoproteins on the accumulation of both elemental mercury and methylmercury in urine and hair biomarkers, respectively, in a population of occupationally and environmentally exposed dental professionals. Our results suggest that five polymorphisms may affect accumulation of mercury in urine (GSTT1 deletion), hair (GSTP1-105, GSTP1-114, GSS 5’) or both (SEPP1 3’UTR).
Four nominally significant (p<0.05) polymorphism-mercury biomarker relationships were observed that have not been reported previously, including two SNPs (GSS 5’, SEPP1 3’UTR) genotyped for the first time in a mercury-gene study. A deletion polymorphism in GSTT1 was associated with decreased urine mercury in both simple (Table 3) and multivariate linear regression (Table 4), though the latter was significant only after adjusting for specific gravity. Effect modification of SEPP1 3’UTR genotype on the relationship between exposure source and mercury biomarker was observed in both urine and hair mercury models. The minor allele, T, of the SEPP1 3’UTR SNP was linked to lower urine mercury levels on average (Table 3). However, upon adjusting for elemental mercury exposures, each T allele was associated with greater urine mercury accumulation per amalgam (Table 4). In hair mercury models, SEPP1 3’UTR T was associated with lower hair mercury per unit of intake from fish consumption (Figure 1a, Table 5). Contrariwise, the GSS 5’ minor allele was associated with increasing hair mercury concentration per unit of fish mercury (Figure 1b, Table 5). This study also reports associations between minor alleles of two SNPs, GSTP1-105 and GSTP1-114, and decreased hair mercury concentrations though significant effect modification on the relationship between mercury intake from fish consumption and hair levels were not observed. Previous gene-mercury biomarker studies have assessed the same GSTP1 SNPs with conflicting results (Custodio et al., 2004; Engström et al., 2008; Gundacker et al., 2009).
Dental professionals provide a convenient sample to assess mercury-gene interactions as they share common exposure routes with the general population (e.g. fish consumption, personal amalgams) along with an additional occupational exposure. While dentists’ occupational exposures are typically higher than the average population, a shift towards use of composite resin fillings and safer handling of mercury may result in dentists having urine biomarker levels comparable to that of the general U.S. population (Eklund et al., 2010). Here, participating dentists and other related professionals (e.g., dental hygienists, dental assistants) exhibited urine and hair mercury levels similar to that of the general U.S. population according to NHANES (CDC, 2009; McDowell et al., 2004). The best predictors of urine mercury levels were personal dental amalgams and occupational exposure to amalgams with dentists having the greatest exposure and biomarker levels. Study subjects displayed a wide range of methylmercury exposure from fish consumption, enabling the study of both mercury forms.
Immense variability in mercury biomarker measurements and half-lives has been observed in human populations, complicating risk assessment of both elemental and methylmercury (Berglund et al., 2005; Burke et al., 1972; Hursh et al., 1976). Differential metabolism of mercury in the body could affect its half-life and reactivity, as conjugated mercury is less able to induce oxidative stress, bind to thiol groups, and/or inhibit proteins in the body. Functional GSTs, adequate glutathione and selenoproteins are essential for protection against mercury (Ballatori and Clarkson, 1985; Chen et al., 2006; Clarkson and Magos, 2006). Polymorphisms are ubiquitous among the genes encoding these mercury-handling proteins and have the potential to modify mercury toxicokinetics, reflected partially in biomarker levels, via altered enzyme activity or gene expression.
Previous studies assessing the association of genetic polymorphisms with mercury biomarkers focused on seven variants in glutathione synthesizing enzymes and glutathione s-transferases, six of which were genotyped here (see Table 1). Our results follow several trends previously reported, and this study further explores genotype-mercury relationships that were inconsistent in past research. Custodio et al. (2005) found the T allele of GCLM rs41303970 to be associated with increased blood, plasma and urine mercury in gold miners occupationally exposed to elemental mercury. Our study did not find associations between urine mercury levels and GCLM genotype. Genotype associations may differ based on the level of exposure as the miners had almost seven-fold higher urinary mercury compared to the dental population (miners: median=4.5 ug/L, maximum=230 ug/L; dental population: median=0.7 ug/L, maximum=9.3 ug/L). Other studies have explored the influence of glutathione-related polymorphisms on urine mercury levels, and a lack of significant outcomes indicate that the polymorphisms studied to date may not influence the variability observed in urinary excretion of elemental mercury. Alternatively, given that the impact of any individual polymorphism on mercury accumulation is expected to be small, studies to date may have insufficient power to detect some associations.
Two previous epidemiological studies have assessed the relationship between glutathione-related polymorphisms and hair mercury levels (Gundacker et al., 2007, 2009), and four explored the modifying effect of polymorphisms on methylmercury accumulation from fish consumption using blood as an exposure biomarker (Custodio et al., 2004; Gundacker et al. 2007, 2009; Engström et al., 2008). Several associative findings linking polymorphisms to hair or blood biomarker levels were inconsistent among studies (Table 1). Gundacker et al. found GSTM1 and GSTT1 deletions together (2007) or in combination with other SNPs (2009) to associate with higher hair mercury levels. The present study did not observe significant associations between GSTM1 or GSTT1 deletion polymorphisms and hair mercury concentrations when modeling single polymorphisms or combined GSTT1/GSTM1 genotype (both genes intact vs. at least one deletion).
Conflicting relationships between two GSTP1 SNPs (105 A>G; 114 C>T) and hair or blood biomarkers were observed among past studies. Given that both SNPs encode amino acid changes in GSTP1 that decrease enzyme activity (Ali-Osman et al., 1997), these SNPs may alter the ability of GSTP1 to conjugate glutathione to mercury or transport mercury-glutathione conjugates. This study suggests that both the GSTP1-105 G and GSTP1-114 T alleles are linked to decreased hair mercury levels (Table 5). Engström et al. (2008) found that carriers of GSTP1-105 G and/or GSTP1-114 T accumulated less mercury in erythrocytes per measured polyunsaturated fatty acids (an indicator of fish consumption), suggesting a similar trend as the findings of this study for GSTP1 variant alleles. In contrast, other studies found associations between GSTP1-105 G or GSTP1-114 T and higher hair or blood biomarker measurements, after adjustment for fish consumption in many cases and often in combination with other polymorphisms (Custodio et al., 2004; Gundacker et al., 2009). Several factors may influence these incongruent results. While hair and blood, especially erythrocytes, are both biomarkers for methylmercury exposure, two centimeters of scalp hair represent the average exposure over two months with a lag period of approximately one month while blood mercury levels reach a steady-state among consistent fish consumers but fluctuate among infrequent consumers (Berglund et al., 2005). Thus, while similar gene-mercury relationships could be observed in models of hair and blood mercury, they may be influenced by the frequency, duration, and dose of the exposure. Several significant findings in previous studies for GSTP1-105 and GSTP1-114 involved polymorphism combinations. Our sample size was not large enough to confidently test combinations of all fifteen polymorphisms studied.
Genotype of the SEPP1 3’UTR SNP significantly impacted both urine Hg (positive interaction with amalgam) and hair Hg (negative interaction with fish mercury) models. This SNP is found in the 3’ untranslated region (UTR), a gene region crucial to the regulation of selenocysteine incorporation. Selenocysteine is an amino acid unique to selenoproteins that can bind mercury-selenium conjugates or methylmercury (Khan and Wang, 2009). SEPP1 expression depends on genotype and selenium availability and can also be influenced by gender and BMI (Méplan et al., 2007, 2009). The 3’UTR T allele is linked to greater SEPP1 expression among people supplemented with selenium and higher prevalence of the 60 kDa isoform of SEPP1 which has more selenocysteine residues and greater mercury binding capacity (Méplan et al., 2007, 2009). Elevated elemental mercury exposure increases SEPP1 expression and the ability of SEPP1 to bind mercury as evident in highly exposed miners (Chen et al., 2006). In the dental population, individuals with CT or TT genotype had lower urine mercury levels on average (Table 3). However, the T allele modified the relationship between the source of exposure, dental amalgams, and urine mercury levels. At higher exposure levels, CT/TT individuals excrete more mercury in the urine per amalgam compared to those with the CC genotype (Table 4). The opposite relationship is observed for the hair biomarker whereby each additional T allele is associated with less accumulation of mercury in the hair given methylmercury intake from fish (Figure 1a). Expression changes of SEPP1 linked to the T genotype may explain the complex relationship observed between SEPP1 genotype, mercury biomarker levels, and exposures to mercury that may be complicated further by micronutrient status (e.g. selenium) and chemical speciation of mercury. Higher expression of SEPP1 from the CT or TT genotypes could affect mercury binding and subsequent distribution to various tissues. Excretion of elemental mercury and methylmercury via urine and hair, respectively, may be differentially modified by this SNP which warrants further investigation and incorporation of selenium biomarker levels into multivariate analysis.
Glutathione synthetase (GSS) is involved in glutathione synthesis, and a SNP upstream of the coding region (5’ C>G) may modify the relationship between mercury intake from fish consumption and hair mercury levels. With each variant allele (G), more mercury is accumulated in the hair given intake from fish consumption (Figure 1b, Table 5). This SNP, which is associated with sporadic amyotrophic lateral sclerosis among individuals with past heavy metal exposure, may influence expression of GSS directly or may be a marker for an expression-altering SNP (Morahan et al., 2007). Decreased expression of GSS leading to decreased glutathione synthesis could impact the body’s ability to eliminate methylmercury as a glutathione conjugate with the higher body burden reflected in hair Hg levels.
We found several nominally significant associations between polymorphisms in glutathione-related enzymes and SEPP1 and elemental mercury or methylmercury biomarker levels in a population of dental professionals despite several study limitations. This cross-sectional study was dependent upon self-reporting of mercury exposures (fish consumption, number of amalgams handled). Though the voluntary nature of subject participation could lead to selection bias, our subjects did not know their mercury levels or genotype prior to participation in the study, and we obtained a range of mercury biomarker levels similar to that of the general U.S. population (CDC, 2009; McDowell et al., 2004).
In the dually exposed MDA cohort, total Hg in urine was predicted by amalgam exposures and occupation, and hair Hg levels correlated with estimated mercury intake from fish. As such, total Hg in urine and hair were assumed to reflect elemental mercury and methylmercury exposures, respectively. While urine and hair are often used as biomarkers of different mercury species (Berglund et al., 2005), cohorts occupationally exposed to elemental mercury attribute a fraction of hair Hg to the elemental mercury exposure source (Wranová et al., 2008). Likewise, in populations with negligible elemental mercury exposure, urine Hg concentrations correlate with fish consumption (Ohno et al., 2007). While the possibility of such biomarker crossover cannot be eliminated, urine and hair Hg concentrations in the MDA cohort primarily reflect elemental mercury and methylmercury exposures, respectively.
In genotype analyses, the sample size was decreased due to inadequate DNA from a subset of subjects, and not all polymorphisms were genotyped each collection year resulting in sample sizes as small as 204 in some models. Previous gene-mercury biomarker studies found significant impacts of dual polymorphism combinations on mercury biomarker levels. However, due to the sample size and number of loci genotyped, polymorphism combinations could not be tested confidently in this study without encountering errors of multiple testing or insufficient power due to small numbers of cases with some genotype combinations. Without studying polymorphism combinations, we may have missed several significant relationships with mercury biomarkers that would mirror findings in previous studies. Overall, while several significant genotype-mercury biomarker relationships were observed (p<0.05), none remain significant after correction for multiple testing (p<0.002). As such, the nominally significant results reported in the MDA cohort should be considered trends and require further exploration in future cohort studies with greater power.
In conclusion, this study adds to growing knowledge about genetic associations with mercury biomarker levels and inter-individual variability in the toxicokinetics of elemental mercury and methylmercury. Results suggest that five polymorphisms in GSTP1, GSTT1, GSS and SEPP1 may influence urine and hair mercury levels, though further investigation is warranted. Future research on genetic factors influencing mercury toxicokinetics should assess both major mercury exposure sources (amalgam, fish consumption) in larger cohorts using all three biomarkers (urine, blood, hair) and more polymorphisms in glutathione related enzymes, selenoproteins, and proteins involved in mercury transport to help ascertain sources of biomarker variability and to narrow the gap between the perceived and true health risks accompanying mercury exposure.
Supplementary Material
Highlights.
-
➢
We explore the influence of 15 polymorphisms on urine and hair Hg levels.
-
➢
Urine and hair Hg levels in dental professionals were similar to the US population.
-
➢
GSTT1 and SEPP1 polymorphisms associated with urine Hg levels.
-
➢
Accumulation of Hg in hair following exposure from fish was modified by genotype.
-
➢
GSTP1, GSS, and SEPP1 polymorphisms influenced Hg accumulation in hair.
Acknowledgments
We acknowledge the support of Dr. Kevin Sloan and Ms. Andrea Sunderman (Michigan Dental Association). This research was funded by grants from the UM Center for Occupational Health & Safety Engineering’s NIOSH Training Grant No. T42 OH 008455-04, Michigan Institute for Clinical and Health Research (MICHR) UL1RR024986, and the UM School of Public Health. JMG was funded through the NIEHS Environmental Toxicology and Epidemiology Training Grant No. T32 007062.
Footnotes
Abbreviations: CRM (certified reference material); GST (glutathione s-transferase); Hg (mercury); MAF (minor allele frequency); MDA (Michigan Dental Association); NHANES (National Health and Nutrition Examination Survey); ln (natural log); SNP (single nucleotide polymorphism); UTR (untranslated region)
CONFLICT OF INTEREST STATEMENT
The authors declare that there are no conflicts of interest.
Publisher's Disclaimer: This is a PDF file of an unedited manuscript that has been accepted for publication. As a service to our customers we are providing this early version of the manuscript. The manuscript will undergo copyediting, typesetting, and review of the resulting proof before it is published in its final citable form. Please note that during the production process errors may be discovered which could affect the content, and all legal disclaimers that apply to the journal pertain.
References
- Ali-Osman F, Akande O, Antoun G, Mao J-X, Buolamwini J. Molecular cloning, characterization, and expression in Escherichia coli of full-length cDNAs of three human glutathione S-transferase pi gene variants. J Biol Chem. 1997;272:10004–10012. doi: 10.1074/jbc.272.15.10004. [DOI] [PubMed] [Google Scholar]
- ATSDR. Toxicological Profile for Mercury. U.S. Department of Health and Human Services; Atlanta, GA: 1999. [Google Scholar]
- Ballatori N, Clarkson TW. Biliary secretion of glutathione and glutathione-metal complexes. Fundam Appl Toxicol. 1985;5:816–831. doi: 10.1016/0272-0590(85)90165-4. [DOI] [PubMed] [Google Scholar]
- Bahnick D, Sauer C, Butterworth B, Kuehl D. A national study of mercury contamination of fish. Chemosphere. 1994;29:537–546. [Google Scholar]
- Basu N, Abare M, Buchanan S, Cryderman D, Nam D-H, Sirkin S, Schmidtt S, Hu H. A combined ecological and epidemiologic investigation of exposure to metals amongst Indigenous Peoples near the Marlin Mine in Western Guatemala. Sci Total Environ. 2010;409:70–77. doi: 10.1016/j.scitotenv.2010.09.041. [DOI] [PMC free article] [PubMed] [Google Scholar]
- Berglund M, Lind B, Bjornberg KA, Palm B, Einarsson O, Vahter M. Inter-individual variations of human mercury exposure biomarkers: a cross-sectional assessment. Environ Health. 2005;4 doi: 10.1186/1476-06X-4-20. [DOI] [PMC free article] [PubMed] [Google Scholar]
- Birke G, Johnels AG, Plantin LO, Sjöstrand B, Skerfving S, Westermark T. Studies on human exposed to methylmercury through fish consumption. Arch Environ Health. 1972;25:71–91. doi: 10.1080/00039896.1972.10666141. [DOI] [PubMed] [Google Scholar]
- Centers for Disease Control and Prevention (CDC) [1 November 2010];Fourth National Report on Human Exposure to Environmental Chemicals. 2009 http://www.cdc.gov/exposurereport/pdf/FourthReport.pdf.
- Chen C, Yu H, Zhao J, Li B, Qu L, Liu S, Zhang P, Chai Z. The roles of serum selenium and selenoproteins on mercury toxicity in environmental and occupational exposure. Environ Health Perspect. 2006;114:297–301. doi: 10.1289/ehp.7861. [DOI] [PMC free article] [PubMed] [Google Scholar]
- Clarkson TW, Magos L. The toxicology of mercury and its chemical compounds. Crit Rev Toxicol. 2006;36:609–662. doi: 10.1080/10408440600845619. [DOI] [PubMed] [Google Scholar]
- Clarkson TW, Vyas JB, Ballatori N. Mechanisms of mercury disposition in the body. Am J Ind Med. 2007;50:757–764. doi: 10.1002/ajim.20476. [DOI] [PubMed] [Google Scholar]
- Custodio HM, Broberg K, Wennberg M, Jansson JH, Vessby B, Hallmans G, Stegmayr B, Skerfving S. Polymorphisms in glutathione-related genes affect methylmercury retention. Arch Environ Health. 2004;59:588–595. doi: 10.1080/00039890409603438. [DOI] [PubMed] [Google Scholar]
- Custodio HM, Harari R, Gerhardsoon L, Skerfving S, Broberg K. Genetic influences on the retention of inorganic mercury. Arch Environ Occup Health. 2005;60:17–23. doi: 10.3200/AEOH.60.1.17-23. [DOI] [PubMed] [Google Scholar]
- Eklund SA. Trends in dental treatment, 1992 to 2007. J Am Dent Assoc. 2010;141:391–399. doi: 10.14219/jada.archive.2010.0191. [DOI] [PubMed] [Google Scholar]
- Engström KS, Stromberg U, Lundh T, Johannsson I, Vessby B, Hallmans G, Skerfving S, Broberg K. Genetic variation in glutathione-related genes and body burden of methylmercury. Environ Health Perspect. 2008;116:734–739. doi: 10.1289/ehp.10804. [DOI] [PMC free article] [PubMed] [Google Scholar]
- Gundacker C, Komarnicki G, Jagiello P, Gencikova A, Dahmen N, Wittmann KJ, Gencik M. Glutathione s-transferase polymorphism, metallothioneins expression, and mercury levels among students in Austria. Sci Total Environ. 2007;385:37–47. doi: 10.1016/j.scitotenv.2007.07.033. [DOI] [PubMed] [Google Scholar]
- Gundacker C, Wittmann KJ, Kukuckova M, Komarnicki G, Hikkel I, Gencik M. Genetic background of lead and mercury metabolism in a group of medical students in Austria. Environ Res. 2009;109:786–796. doi: 10.1016/j.envres.2009.05.003. [DOI] [PubMed] [Google Scholar]
- Hursh JB, Clarkson TW, Cherian MG, Vostal JJ, Vander Mallie R. Clearance of mercury (Hg-197, Hg-203) vapor inhaled by human subjects. Arch Environ Health. 1976;31:302–309. doi: 10.1080/00039896.1976.10667240. [DOI] [PubMed] [Google Scholar]
- Lee B, Hong Y, Park H, Ha M, Koo BS, Chang N, Roh Y, Kim B, Kim Y, Kim B, Jo S, Ha E. Interaction between GSTM1/GSTT1 polymorphism and blood mercury on birth weight. Environ Health Perspect. 2009 doi: 10.1289/ehp.0900731. [DOI] [PMC free article] [PubMed] [Google Scholar]
- Levine L, Fahy JP. Evaluation of lead determinations I: the significance of specific gravity. J Ind Hyg Toxicol. 1945;27:217. [Google Scholar]
- Livak KJ, Flood SJ, Marmaro J, Giusti W, Deetz K. Oligonucleotides with fluorescent dyes at opposite ends provide a quenched probe system useful for detecting PCR product and nucleic acid hybridization. PCR Methods Appl. 1995;4:357–362. doi: 10.1101/gr.4.6.357. [DOI] [PubMed] [Google Scholar]
- Mason HJ, Calder IM. The correction of urinary mercury concentrations in untimed random samples. Occup Environ Med. 1994;51:287. doi: 10.1136/oem.51.4.287-a. [DOI] [PMC free article] [PubMed] [Google Scholar]
- McDowell MA, Dillon CF, Osterloh J, Bolger PM, Pellizzari E, Fernando R, et al. Mercury levels in U.S. children and women of childbearing age: reference range data from NHANES 1999-2000. Environ Health Perspect. 2004;112:1165–1171. doi: 10.1289/ehp.7046. [DOI] [PMC free article] [PubMed] [Google Scholar]
- Méplan C, Crosley LK, Nicol F, Beckett GJ, Howie AF, Hill KE, et al. Genetic polymorphisms in the human selenoproteins P gene determine the response of selenoproteins markers to selenium supplementation in a gender-specific manner (the SELGEN study) FASEB. 2007;21:3063–3074. doi: 10.1096/fj.07-8166com. [DOI] [PubMed] [Google Scholar]
- Méplan C, Nicol F, Burtle BT, Crosley LK, Arthur JR, Mathers JC, et al. Relative abundance of selenoprotein P isoforms in human plasma depends on genotype, Se intake, and cancer status. Antioxid Redox Signal. 2009;11:2631–2640. doi: 10.1089/ARS.2009.2533. [DOI] [PubMed] [Google Scholar]
- Mierzykowski SE, Carr KC. USFWS Special Proejct Report FY98-MEFO-2-EC. Main Field Office; Old Town, ME: 2001. Total mercury and methylmercury in freshwater mussels Elliptio complanata from the Sudbury River watershed, Massachusetts. [Google Scholar]
- Min JL, Lakenberg N, Bakker-Verweij M, Suchiman E, Boomsma DI, Slagboom PE, Meulenbelt I. High microsatellite and SNP genotyping success rates established in a large number of genomic DNA samples extracted from mouth swabs and genotypes. Twin Res Hum Genet. 2006;9:501–506. doi: 10.1375/183242706778024973. [DOI] [PubMed] [Google Scholar]
- Morahan JM, Yu B, Trent RJ, Pamphlett R. Genetic susceptibility to environmental toxicants in ALS. Am J Med Genet B. 2007;114B:885–890. doi: 10.1002/ajmg.b.30543. [DOI] [PubMed] [Google Scholar]
- Mordukhovich I, Wilker E, Suh H, Wright R, Sparrow D, Vokonas PS, Schwartz J. Black carbon exposure, oxidative stress genes, and blood pressure in a repeated-measures study. Environ Health Perspect. 2009;117:1767–1772. doi: 10.1289/ehp.0900591. [DOI] [PMC free article] [PubMed] [Google Scholar]
- Ohno T, Sakamoto M, Kurosawa T, Dakeishi M, Iwata T, Murata K. Total mercury levels in hair, toenail, and urine among women free from occupational exposure and their relations to renal tubular function. Environ Res. 2007;103:191–197. doi: 10.1016/j.envres.2006.06.009. [DOI] [PubMed] [Google Scholar]
- Paruchuri Y, Siuniak A, Johnson N, Levin E, Mitchell K, Goodrich JM, et al. Occupation and environmental mercury exposure among small-scale gold miners in the Talensi-Nabdam District of Ghana’s Upper East region. Sci Total Environ. 2010;408:6079–6085. doi: 10.1016/j.scitotenv.2010.08.022. [DOI] [PMC free article] [PubMed] [Google Scholar]
- Rooney JPK. The role of thiols, dithiols, nutritional factors and interacting ligands in the toxicology of mercury. Toxicology. 2007;234:145–156. doi: 10.1016/j.tox.2007.02.016. [DOI] [PubMed] [Google Scholar]
- U.S. Food and Drug Adminstration (FDA) Mercury concentrations in fish: FDA Monitoring Program (1990-2004) [Aug. 3, 2010];US Department of Health and Human Services. 2010 http://www.fda.gov/food/foodsafety/productspecificinformation/seafood/foodbornepathogenscontaminants/methylmercury/ucm115644.htm.
- Wranová K, Čejchanová M, Spěváčková V, Korunová V, Vobecký M, Spěváček V. Mercury and methylmercury in hair of selected groups of Czech population. Cent Eur J Public Health. 2008;17:36–40. doi: 10.21101/cejph.a3513. [DOI] [PubMed] [Google Scholar]
Associated Data
This section collects any data citations, data availability statements, or supplementary materials included in this article.