

Abstract
Objective
Assess whether pediatric risk factors predict cardiovascular disease (CVD), impaired fasting glucose (IFG) + type 2 diabetes (T2DM), and high blood pressure (HBP) in young adulthood.
Materials/Methods
Prospective follow-up of 909 public-parochial suburban schoolchildren first studied at ages 6–18 and 26 years later at mean age 38. Pediatric triglycerides (TG), blood pressure, LDL cholesterol (LDLC), BMI, and glucose above and HDL cholesterol (HDLC) below established pediatric cutoffs, along with race, cigarette smoking, family history of CVD, T2DM, and HBP were assessed as determinants of young adult CVD, a composite variable including IFG + T2DM, and HBP.
Results
By stepwise logistic regression, adult CVD (19 yes, 862 no) was associated with pediatric high TG, odds ratio (OR) 5.85, 95% confidence intervals (CI) 2.3–14.7. High TG in pediatric probands with young adult CVD was familial, and was associated with early CVD in their high TG parents. Adult IFG + T2DM (114 yes, 535 no) was associated with parental T2DM (OR 2.2, 95% CI 1.38–3.6), high childhood glucose (OR 4.43, 95% CI 2–9.7), and childhood cigarette smoking (OR 1.64, 95% CI 1.03–2.61). Adult HBP (133 yes, 475 no) was associated with pediatric high BMI (OR 2.7, 95% CI 1.7–4.3) and HBP (OR=2.5, 95% CI 1.5–4.3).
Conclusions
Pediatric risk factors are significantly, independently related to young adult CVD, IFG+T2DM, and HBP. Identification of pediatric risk factors for CVD, IFG+T2DM, and HBP facilitates initiation of primary prevention programs to reduce development of adult CVD, IFG+T2DM, and HBP.
Keywords: triglyceride, cardiovascular disease, type 2 diabetes mellitus, impaired fasting glucose, high blood pressure
INTRODUCTION
Pediatric risk factors for atherosclerosis are associated with young adult atherosclerotic lesions, carotid intimal-medical thickening, and cardiovascular disease (CVD) events. Berenson et al reported that increased atherosclerotic lesions in young adults were positively correlated with the number of pediatric risk factors, hyperlipidemia, high blood pressure, and obesity. The Muscatine Iowa Study reported that increased carotid intimal medial thickness (CIMT) was associated with high total cholesterol and hypertension in childhood. The Cardiovascular Risk in Young Finns study showed that CVD risk factor status in adolescence predicted increased CIMT in adulthood, independent of adult risk factors. In four longitudinal studies in Young Finns, Juonala et al reported that the number of risk factors in the highest quintile of total cholesterol, triglycerides, blood pressure, and body mass index at ages 9, 12, 15 and 18 predicted top decile CIMT in young adulthood, but risk factors at ages 3 and 6 years did not. Assessing pooled data from the Young Finns and Bogalusa studies, Magnussen et al reported that children with metabolic syndrome (MetS) were 2 to 3 times more likely than children without MetS to have high CIMT and type 2 diabetes mellitus (T2DM) as adults. We have previously reported that pediatric TG were consistently and independently associated with CVD in the 4th–5th decade of life.
The findings from these studies promoted extensive screening of children for high risk levels of CVD risk factors to permit early intervention, especially after the success of the Lipid Research Clinics Coronary Primary Prevention Trial and the Hypertension Detection and Follow-up Studies. Based on the totality of the longitudinal findings from the Bogalusa, Muscatine, and the Young Finns Study, Berenson has advocated widespread, universal screening of children for CVD risk, but the Expert Panel on Blood Cholesterol in Children and Adolescents recommended only targeted screening of children with a family history positive for premature CVD or parental hypercholesterolemia (≥ 6.2 mmol/l [240 mg/dl]). The American Academy of Pediatrics endorsed using the NCEP guidelines. Yet, the effectiveness of the NCEP-Pediatrics guidelines depends on several factors: 1) the parents’ own pattern of health care utilization, their knowledge of their lipid levels, and their awareness of the importance of informing their children’s physician or clinic about their family history; 2) consequently the provider’s knowledge of the family history; and 3) thus, the “Balkanization” of the family’s health care providers.
Within the framework of these health care coverage issues, our specific aim was to evaluate the use of risk factor screening results of 5 to 19 year old schoolchildren to predict CVD, a composite variable including impaired fasting glucose and type 2 diabetes mellitus (IFG + T2DM), and high blood pressure (HBP) 26 years later in young adulthood.
METHODS
In the current report, we used longitudinal data from the National Heart-Lung-Blood Institute (NHLBI) Princeton Follow-up Study (PFS) (1999–2003), a 22–30 year follow-up of black and white former schoolchildren first studied in the NHLBI Lipid Research Clinics (LRC, 1973–1978). PFS collected data following a protocol approved by the Cincinnati Children’s Hospital Institutional Review Board, with signed informed consent.
Princeton LRC and PFS Studies
The Princeton LRC and PFS have both been described previously. Briefly, the Princeton LRC was a multistage survey of lipids and other CVD risk factors in students in grades 1–12 and a 50% random sample of their parents by household. The student population in LRC was 72% white and 28% black, with a mean age of 12.3 ± 3.4 years. Eighty-two percent of eligible students participated at Visit 1 and 91% of eligible students participated at subsequent visits; participation rates did not differ significantly between races. At Visit 1, total cholesterol and TG were measured. At Visit 2, complete fasting lipid profiles, blood pressure, glucose, and body mass index (kg/m2) were measured on random and hyperlipidemic subsets of all Visit 1 participants. At Visit 3, the first-degree relatives of random and hyperlipidemic participants at Visit 2 had complete fasting lipid profiles, glucose, and body mass index (kg/m2) measured.
The PFS was conducted to assess changes in risk factors from childhood to adulthood and changes in familial CVD risk factor correlations from the period of shared households to separate households. Hence, PFS eligibility was restricted to former students that participated at LRC Visit 2 with a sibling or parent also at Visit 2 plus all former students and parents participating at Visit 3. There was no contact with the former schoolchildren during intervals in these studies.
Diagnosis of CVD, Impaired Fasting Glucose, Type 2 Diabetes, and High Blood Pressure
At PFS, information about the participants’ and their parents’ health history for CVD, T2DM, and HBP was obtained by direct interview of the former students, now adults, and their participating (adult) siblings and parents, a protocol shown previously to provide accurate data. CVD was defined as myocardial infarction, coronary artery bypass graft, angioplasty, ischemic stroke, and carotid or peripheral artery bypass surgery. Diagnosis of diabetes was based on World Organization of Health criteria, fasting glucose ≥ 126 mg/dl, (7 mmol/l) and/or self-report of diabetes with treatment by a physician. We excluded from these analyses 10 subjects who had reported diabetes mellitus as children at LRC. However, in PFS we did not have a measurement of C-peptides or diabetes autoantibody levels, the gold standard methods of distinguishing type 1 from type 2 diabetes. Diagnosis of impaired fasting glucose (IFG) was made when fasting blood glucose was ≥ 100 mg/dl (5.6 mmol/l). HBP at the PFS visit was defined as a systolic and/or diastolic blood pressure ≥140/90 mmHg or taking blood pressure medication prescribed by a physician. At the PFS visit, information was obtained by interview from former schoolchildren regarding medication use, including the question “are you currently taking medicine to lower cholesterol?”
Pediatric and Young Adult Risk Factor Cutoffs
Pediatric risk factor cutoffs included high LDLC (≥110 mg/dl [2.82 mmol/l]), and cutoffs published for pediatric metabolic syndrome: high TG (≥110 mg/dl [1.24 mmol/l]), low HDLC (≤50 mg/dl [1.28 mmol/l] in girls, ≤40 [1.03 mmol/l] in boys), and high glucose (≥100 mg/dl [5.6 mmol/l]); high BMI (≥85th CDC 2000 age-gender specific percentile), and high BP (≥90th age-height specific percentile). The blood pressure cutoffs agree with guidelines from Fourth Report on the Diagnosis, Evaluation, and Treatment of HBP in Children and Adolescents.
Risk factor cutoffs at the PFS were those of the NCEP/AHA Metabolic syndrome (waist ≥ 102 cm men, ≥ 88 cm women, triglyceride ≥ 150 mg/dl [1.69 mmol/l], HDLC <40 mg/dl [1.03 mmol/l] men, <50 mg/dl [1.28 mmol/l] women, SBP/DBP ≥ 130/85 mmHg, glucose ≥ 100 mg/dl [5.6 mmol/l]). BMI and LDLC cutpoints at the PFS respectively were ≥ 30 kg/m2 (CDC, US Obesity Trends, Trends by State 1985–2009), and the current cohort’s gender-race-specific 90th percentile levels.
Statistical Methods
CVD risk factor measures in the cohort in childhood and adulthood were calculated. Spearman correlations between LRC and PFS values were calculated; LDLC and LDLC/HDLC correlations were calculated with and without the 31 subjects who reported taking cholesterol-lowering medicine during adulthood.
Subjects were categorized as abnormal or normal for each pediatric risk factor, using established pediatric cutoffs, childhood cigarette smoking, and family history of CVD, T2DM, and HBP. The prevalence of young adult CVD, IFG+T2DM and HBP at PFS by risk factor category was determined. Odds ratios (OR) were calculated by pediatric risk factor category for each outcome. Sensitivity, specificity, positive and negative predictive values of the childhood risk factors as predictors of early adult CVD, IFG+T2DM and HBP were calculated, and the associations of CVD, IFG+T2DM and HBP with each risk factor were assessed by Chi-square test or Fisher’s exact test when the expected cell size was <5. To deal with multiple tests, we used the Hochberg-Benjamini method controlling for false discovery rate.
Next, stepwise logistic regression analysis was used to identify significant independent pediatric risk factors for young adult CVD, IFG +T2DM, and HBP at PFS in multivariate analyses. Explanatory variables included categorical variables: race, pediatric risk factors (high vs. not high) TG, LDLC, blood pressure, BMI and glucose; HDLC (low vs. not low), cigarette smoking (yes vs. no), and parental history (yes vs. no) of CVD, T2DM or HBP. After explanatory variables were selected by stepwise selection, then the regression model was re-evaluated using SURVEY-LOGISTIC to address sibling clusters.
CVD-free time was determined using age at first event for subjects with an event and age at PFS as censored CVD-free time for subjects without CVD. Kaplan-Meier survival curves were plotted with strata by childhood TG (high, not high). The ratio of expected CVD-free time in TG high group vs. not high group was estimated using SAS LIFEREG procedure, adjusted for race.
Finally, to examine whether and to what degree familial hypertriglyceridemia underlay the observed TG levels in the 19 subjects who had CVD events, we examined TG levels in the CVD subjects, their siblings, and their parents at the LRC and later at the PFS.
RESULTS
In the LRC-PFS study, after excluding 10 subjects with type 1 diabetes mellitus, there were 909 student subjects, 651 white, 258 black, Table 1.
Table 1.
Risk factors for cardiovascular disease, impaired fasting glucose and type 2 diabetes mellitus, and hypertension measured during childhood (Lipid Research Clinics [LRC]) and 26 years later in young adulthood in the Princeton Follow-up Study (PFS).
| Mean ± SD at LRC | Mean ± SD at PFS | Spearman correlation LRC with PFS | |
|---|---|---|---|
| Race | W 651 (72%), B 258 (28%) | ||
| Gender | M 422 (46%), F 487 (54%) | ||
| Age (yr) | 12.3 ±3.4 | 38.5 ±3.7 | |
| TG (mg/dl) | 77 ±37 | 134 ±128 | r =0.36, p<.0001 |
| HDLC (mg/dl) | 55 ±12 | 46 ±15 | r =0.47, p<.0001 |
| LDLC (mg/dl) | 107 ±30 106 ±29* |
120 ±35 121 ±36* |
r =0.48, p<.0001 r=0.49, p<.0001* |
| LDL/HDL | 2.04 ±0.76 2.02 ±0.76* |
2.95 ±1.36 2.94 ±1.34* |
r =0.47, p<.0001 r=0.47, p<.0001* |
| SBP (mmHg) | 104 ±13 | 120 ±15 | r =0.28, p<.0001 |
| DBP (mmHg) | 62 ±12 | 79 ±11 | r =0.21, p<.0001 |
| BMI (kg/m2) | 20.0 ±4.3 | 28.7 ±6.9 | r =0.40, p<.0001 |
| Glucose (mg/dl) | 85 ±8 | 90 ±23 | r =0.17, p<.0001 |
| LDLC at LRC | LDLC at PFS | change | Paired Wilcoxon For change | |||
|---|---|---|---|---|---|---|
| n | Mean ± SD | n | Mean ± SD | Mean ± SD | ||
| Took cholesterol lowering medications | 31 | 132 ±39 | 30 | 114 ±38 | −17 ±39 | p =.015 |
| Not taking cholesterol-lowering medications | 822 | 106 ±29 | 805 | 121 ±36 | +15 ±32 | p <.0001 |
| Wilcoxon (Took medication vs Not) | p<.0001 | p=.15 | ||||
After removal of 31 subjects taking cholesterol lowering medications.
Risk factor summary data during childhood and at follow-up are presented in Table 1. The LRC and PFS risk factor correlations were all highly significant (p<0.0001), and the correlations for BMI, HDLC, LDLC and the LDL/HDL ratio were all stronger than r= 0.40, Table 1. The LDLC and the LDL/HDL correlations were calculated with and without the 31 subjects taking cholesterol-lowering drugs when studied in the PFS, and were comparable with these 31 subjects included or not included, Table 1. The correlation coefficients for TG, glucose, systolic and diastolic blood pressure between LRC and PFS were highly significant, r= 0.36, 0.17, 0.28, and 0.21 respectively, Table 1.
At follow-up at mean age 38 years, 31 of 853 subjects (3.6%) were taking cholesterol-lowering medications, Table 1. The mean pediatric LDLC at the LRC in subjects later taking cholesterol lowering medications as adults was higher than in other students, (132 vs 106 mg/dl [3.38 vs. 2.72 mmol/l], p <0.0001), but the mean LDLC in these participants decreased from childhood to adulthood (from 132 to 114 mg/dl [3.38 vs. 2.92 mmol/l], p = 0.015) while, as expected, mean LDLC increased in subjects not taking lipid lowering drugs (106 to 121 mg/dl [2.72 vs 3.10 mmol/l], p < 0.0001), Table 1. Thus, subjects taking lipid drugs at PFS had slightly, but not significantly lower LDLC at PFS than subjects not taking lipid drugs (114 vs 121 mg/dl [2.92 vs 3.10 mmol/l], p = 0.15), Table 1.
At PFS, 19 (2.2% of 881) former schoolchildren had sustained CVD events (Table 2A), 135 (18% of 753) had IFG + T2DM (Table 2B), and 206 (23% of 893) had HBP (Table 2C). In univariate analyses, young adult CVD associated with high childhood TG, and high childhood BMI (Table 2A). At LRC, 9 of the 19 subjects (47%) with early CVD had high TG (≥ 110 mg/dl [1.24 mmol/l) vs 13% of schoolchildren without CVD by PFS, p=.0004, Figure 2. At PFS (mean age 41 ± 3 years), 13 of 18 (72%) former schoolchildren with CVD had TG ≥ 150 mg/dl (1.69 mmol/l), compared to 28% of subjects free of CVD at PFS, p =.0001, Figure 2. Moreover, 50% of 19 former students with CVD by PFS had high BMI at LRC, vs 25% of those without CVD by PFS, p = .025. At the PFS, 68% of former students who had CVD had high BMI vs 33% of those without CVD, p =.0025, Figure 3.
Table 2A.
Pediatric Risk Factors and cardiovascular disease (CVD) 26 years later
| Pediatric Risk Factor (mean age 12) | # of subjects | Using pediatric risk factor as screening test for CVD at mean age 39 | ||||||
|---|---|---|---|---|---|---|---|---|
| # subjects with CVD | Odds Ratio 95% CI | Sensitivity | specificity | Positive predicted value | Negative predicted value | p | ||
| BMI (≥85th CDC 2000 age-gender specific percentile as high) | ||||||||
| High | 200 (25%) | 9 (5%) | 3.03 1.18–7.73 |
50% | 75% | 5% | 98% | Fisher’s p=.025 |
| Not High | 587 (75%) | 9 (2%) | ||||||
| TG (≥110 mg/dl as high) | ||||||||
| High | 124 (14%) | 9 (7%) | 5.85 2.33–14.7 |
47% | 87% | 7% | 99% | Fisher’s p=.0004* |
| Not high | 757 (86%) | 10 (1%) | ||||||
| HDLC (≤50 F, ≤40 M as low) | ||||||||
| Low | 213 (26%) | 5 (2%) | 1.03 0.37–2.88 |
26% | 74% | 2% | 98% | Fisher’s p=1.0 |
| Not Low | 612 (74%) | 14 (2%) | ||||||
| LDLC (≥110 mg/dl as high) | ||||||||
| High | 335 (40%) | 5 (1%) | 0.52 0.19–1.46 |
26% | 59% | 1% | 97% | X2=1.60, p=.21 |
| Not high | 494 (60%) | 14 (3%) | ||||||
| BP (≥90th age-height specific percentile as high) | ||||||||
| High | 72 (12%) | 4 (6%) | 3.02 0.92–9.89 |
29% | 88% | 6% | 98% | Fisher’s p=.077 |
| Not high | 523 (88%) | 10 (2%) | ||||||
| Glucose (≥100 mg/dl as high) | ||||||||
| High | 31 (4%) | 2 (6%) | 3.09 0.68–14.0 |
11% | 96% | 6% | 98% | Fisher’s p=.16 |
| Not High | 778 (96%) | 17 (2%) | ||||||
| Cigarette smoking | ||||||||
| Yes | 237 (29%) | 9 (4%) | 2.84 1.08–7.45 |
53% | 72% | 4% | 99% | Fisher’s p=.053 |
| No | 584 (71%) | 8 (1%) | ||||||
| Family CVD history | ||||||||
| Positive | 399 (46%) | 11 (3%) | 1.66 0.66–4.17 |
58% | 55% | 3% | 98% | X2=1.19, p=.27 |
| Negative | 477 (54%) | 8 (2%) | ||||||
Significant using Hochberg-Benjamini controlling for false discovery rate (p=.05) for 8 tests.
FIGURE 2.
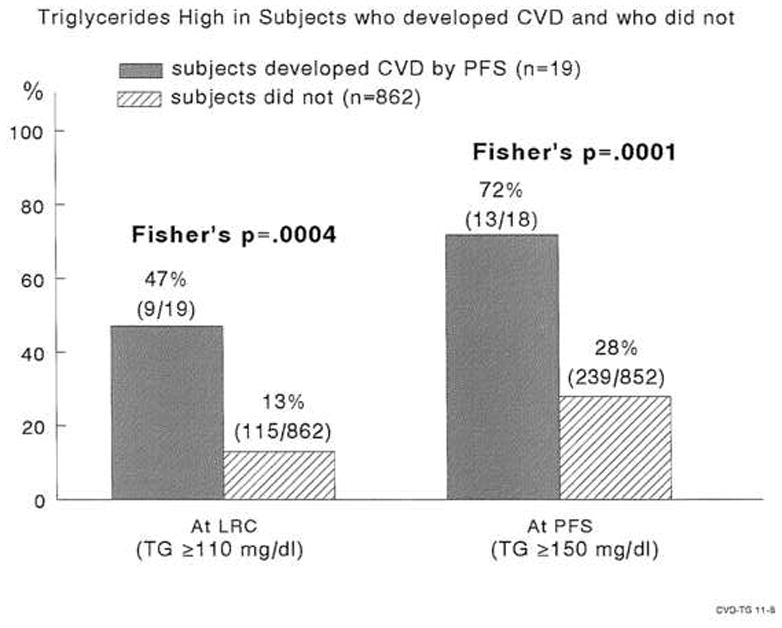
High triglycerides in childhood and young adulthood in subjects who developed cardiovascular disease in young adulthood and those who did not.
FIGURE 3.
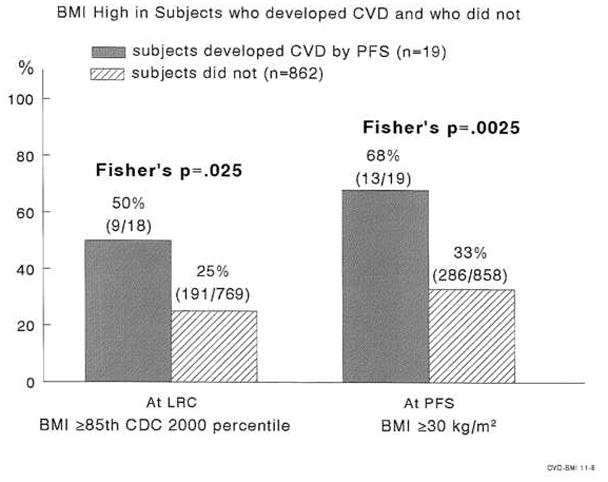
High BMI in childhood and young adulthood in subjects who developed cardiovascular disease in young adulthood and those who did not.
IFG+T2DM associated with high childhood BMI, TG, and glucose and with low HDLC and family history of T2DM (Table 2B). HBP associated with high childhood BMI, BP, and family history of HBP (Table 2C). For each outcome, excepting family history of HBP, specificity was much higher than sensitivity and negative predictive value much higher than positive predictive value (Tables 2A, 2B, 2C). Thus, young adults who did not have high childhood TG had only a 1% chance of CVD by PFS, and those who did not have high childhood BMI had only a 2% chance of CVD by PFS (Table 2A).
In univariate analyses, high childhood LDLC was not significantly associated with CVD 26 years later, X2 = 1.6, p = 0.21, Table 2A.
In multivariate analyses, by stepwise logistic regression, high pediatric TG was the only significant independent explanatory variable for young adult CVD, Table 3. The AUC was 0.670. After adjusting for race, subjects with high TG in childhood had shorter expected CVD-free time than those without high childhood TG, the ratio of expected CVD-free time =0.84, 95% CI 0.74–0.96, p=.009, Figure 1.
Table 2B.
Pediatric Risk Factors and IFG+T2DM 26 years later
| Pediatric Risk Factor (mean age 12) | # of subjects | Using pediatric risk factor as screening test for IFG or T2DM at mean age 39 | ||||||
|---|---|---|---|---|---|---|---|---|
| # subjects with IFG or T2DM | Odds Ratio 95% CI | Sensitivity | specificity | Positive predicted value | Negative predicted value | p | ||
| BMI (≥85th CDC 2000 age-gender specific percentile as high) | ||||||||
| High | 176 (25%) | 41 (23%) | 1.71 1.12–2.61 |
34% | 76% | 23% | 85% | X2=6.17, p=.013* |
| Not High | 516 (75%) | 78 (15%) | ||||||
| TG (≥110 mg/dl as high) | ||||||||
| High | 106 (14%) | 29 (27%) | 1.92 1.20–3.09 |
21% | 88% | 27% | 84% | X2=7.46, p=.0063* |
| Not high | 647 (86%) | 106 (16%) | ||||||
| HDLC (≤50 F, ≤40 M as low) | ||||||||
| Low | 182 (25%) | 43 (24%) | 1.63 1.08–2.46 |
33% | 77% | 24% | 84% | X2=5.51, p=.019* |
| Not Low | 546 (75%) | 87 (16%) | ||||||
| LDLC (≥110 mg/dl as high) | ||||||||
| High | 295 (40%) | 51 (17%) | 0.95 0.64–1.40 |
39% | 59% | 17% | 82% | X2=0.075 p=.78 |
| Not high | 437 (60%) | 79 (18%) | ||||||
| BP (≥90th age-height specific percentile as high) | ||||||||
| High | 57 (11%) | 16 (28%) | 1.82 0.98–3.41 |
17% | 90% | 28% | 82% | X2=3.62 p=.057 |
| Not high | 454 (89%) | 80 (18%) | ||||||
| Glucose (≥100 mg/dl as high) | ||||||||
| High | 28 (4%) | 12 (43%) | 3.72 1.71–8.07 |
9% | 97% | 43% | 83% | X2=12.51 p=.0004* |
| Not High | 697 (96%) | 117 (17%) | ||||||
| Cigarette smoking | ||||||||
| Yes | 198 (29%) | 42(21%) | 1.45 0.96–2.21 |
35% | 73% | 21% | 84% | X2=3.10 p=.078 |
| No | 493 (71%) | 77 (16%) | ||||||
| Family T2DM history | ||||||||
| Positive | 284 (39%) | 72 (25%) | 2.16 1.48–3.16 |
54% | 65% | 25% | 86% | X2=16.2, p<.0001* |
| Negative | 449 (61%) | 61 (14%) | ||||||
Significant using Hochberg-Benjamini controlling for false discovery rate (p=.05) for 8 tests.
FIGURE 1.
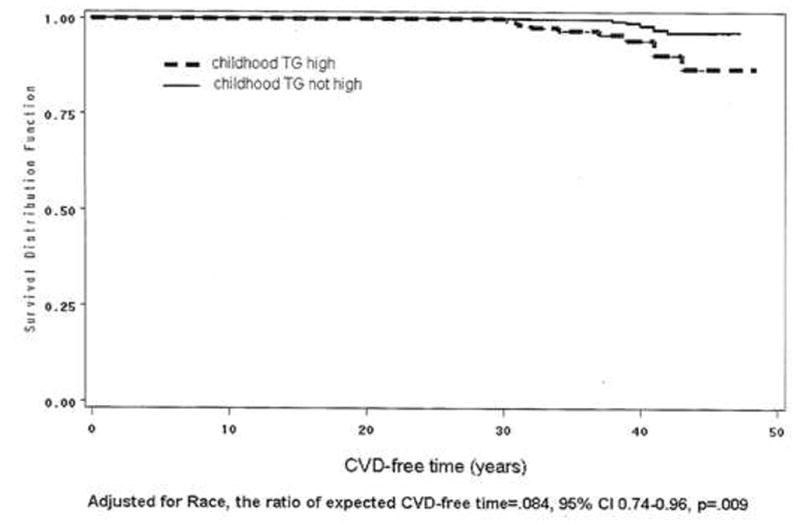
Kaplan-Meier survival curve. In group of subjects with high pediatric triglyceride versus group with normal childhood triglyceride. The ratio of expected CVD-free time was estimated using SAS LIFEREG procedure.
Significant independent predictors for IFG + T2DM at PFS in multivariate analysis included parental T2DM, high childhood glucose, and childhood cigarette smoking, Table 3.
Significant independent explanatory variables for HBP at PFS included high pediatric BMI and BP, AUC = 0.657, Table 3.
High childhood LDLC was not independent predictors for young adult CVD by stepwise logistic regression (Table 3).
Of the 9 students with CVD by PFS and high TG at LRC, 88% had high BMI at LRC, and 67% had high BMI at PFS (Table 4, online supplement).
Table 2C.
Pediatric Risk Factors and high blood pressure (HBP) 26 years later
| Pediatric Risk Factor (mean age 12) | # of subjects | Using pediatric risk factor as screening test for HBP at mean age 39 | ||||||
|---|---|---|---|---|---|---|---|---|
| # subjects with HBP | Odds Ratio 95% CI | Sensitivity | specificity | Positive predicted value | Negative predicted value | p | ||
| BMI (≥85th CDC 2000 age-gender specific percentile as high) | ||||||||
| High | 204 (26%) | 71 (35%) | 2.40 1.69–3.44 |
40% | 79% | 35% | 82% | X2=24.2, p<.0001 * |
| Not High | 595 (74%) | 108 (18%) | ||||||
| TG (≥110 mg/dl as high) | ||||||||
| High | 123 (14%) | 31 (25%) | 1.15 0.74–1.78 |
15% | 87% | 25% | 77% | X2=0.37, p=.55 |
| Not high | 770 (86%) | 175 (23%) | ||||||
| HDLC (≤50 F, ≤ 40 M as low) | ||||||||
| Low | 214 (26%) | 42 (20%) | 0.77 0.52–1.13 |
22% | 73% | 20% | 76% | X2=1.79, p=.18 |
| Not Low | 623 (74%) | 150 (24%) | ||||||
| LDLC (≥110 mg/dl as high) | ||||||||
| High | 339 (40%) | 79 (23%) | 1.06 0.76–1.47 |
41% | 60% | 23% | 78% | X2=0.11, p=.74 |
| Not high | 502 (60%) | 112 (22%) | ||||||
| BP (≥90th age-height specific percentile as high) | ||||||||
| High | 72 (12%) | 31 (43%) | 3.22 1.92–5.38 |
23% | 91% | 43% | 81% | X2=21.4, p<.0001 * |
| Not high | 536 (88%) | 102 (19%) | ||||||
| Glucose (≥100 mg/dl as high) | ||||||||
| High | 31 (4%) | 5 (16%) | 0.63 0.24–1.67 |
3% | 96% | 16% | 77% | X2=0.87, p=.35 |
| Not High | 789 (96%) | 184 (23%) | ||||||
| Cigarette smoking | ||||||||
| Yes | 237 (29%) | 61 (26%) | 1.21 0.85–1.72 |
32% | 72% | 26% | 78% | X2=1.15, p=.28 |
| No | 580 (71%) | 129 (22%) | ||||||
| Family HBP history | ||||||||
| Positive | 599 (70%) | 163 (27%) | 2.26 1.53–3.35 |
82% | 34% | 27% | 86% | X2=17.3, p<.0001 * |
| Negative | 261 (30%) | 37 (14%) | ||||||
Significant using Hochberg-Benjamini controlling for false discovery rate (p=.05) for 8 tests.
Familial hypertriglyceridemia in the 19 cases with CVD events
Child-proband, sibling, and parental data at both the LRC and PFS revealed evidence of familial hypertriglyceridemia in the families of the 19 early CVD cases, Figure 4. Of the 9 subjects having high TG at the LRC, 8 (89%) had high TG in PFS, Figure 4.
FIGURE 4.
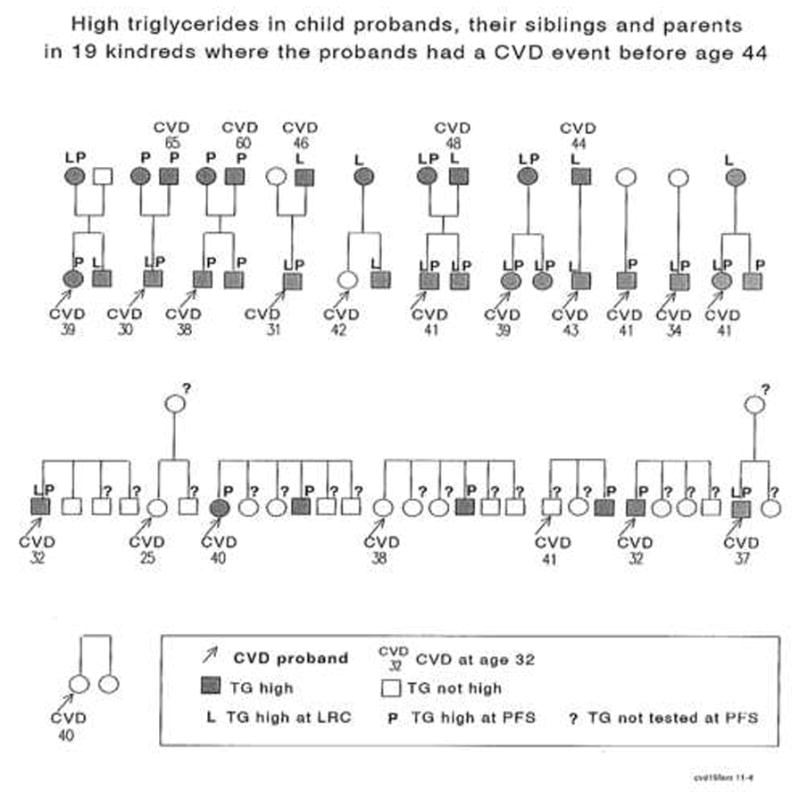
Familial high triglycerides in child probands, their siblings and parents in 19 kindred where the probands had a CVD event before age 44.
Of the 19 families of child probands who later had CVD events, ≥ 1 parent was assessed in 13 families (18 parents) in the LRC at mean ± SD age 41±6 when their offspring were schoolchildren, and ≥ 1 parent was assessed in 11 families (16 parents) at PFS at age 69 ± 5 when their offspring were young adults, Figure 4. Altogether, in 14 families of the probands who had sustained CVD and had high TG either at LRC or at PFS, there was a hypertriglyceridemic parent and/or sibling in 9/14 (64%) families, Figure 4. Early CVD (ages 44, 46, 48, 60, and 65 years) also occurred in hypertriglyceridemic parents of hypertriglyceridemic students.
Low HDLC was associated with high TG. Of the 19 subjects with CVD, 21% had low HDLC as children and 61% had low HDLC as young adults (Table 4, online supplement).
DISCUSSION
In the current study, high childhood TG was the sole significant independent predictor of CVD at PFS. Of the 19 CVD cases, high childhood TG persisted into young adulthood, and high TG was common in parents and in siblings, found in ≥1 parent and/or sibling in 64% of families of high TG probands, manifesting familial hypertriglyceridemia. Further, the association of pediatric TG with young adult CVD may reflect the underlying association of high TG with low HDLC, an association which was amplified with age in the current study. Thus of the 19 cases who had CVD, 21% had low HDLC as children and 61% had low HDLC as young adults, with 40% more subjects with CVD manifesting atherogenic low HDLC as young adults. Although the childhood lipid levels in this study were quantitated 26 years ago, likely with different assays and standards than are used today, this would, if anything, bias the results to the null outcome.
Congruent with the report by de Ferranti et al, 88% of children with high triglyceride levels and CVD by young adulthood were obese, as were 67% of these subjects as young adults.
In the current study, pediatric risk factors in 5–19 year old children predicted CVD, IFG + T2DM, and HBP 26 years later. Given the significant tracking of risk factors for CVD, IFG+T2DM, and HBP as observed in the current study, and in previous longitudinal studies of children into young adulthood, failure to act on such salient childhood risk factors as TG, obesity, hyperglycemia, and hypertension means the underlying pathology continues into young adulthood. Thus, the relationship between childhood risk factors, and young adult atherosclerosis should support lifestyle and, perhaps, pharmacologic intervention in childhood-adolescence to prevent development of initial atherosclerotic lesions, progression to advanced lesions, and CVD.
In the Muscatine Iowa study, childhood weight, body mass index, and triglyceride levels in men were significantly related to coronary artery calcification 15 to 20 years later in young adults. In the Bogalusa Louisiana study, post-mortem identification of coronary artery streaks in 6 to 30 year olds was significantly correlated with antecedent serum triglyceride, very low-density lipoprotein cholesterol, blood pressure, and obesity. In the PDAY post-mortem study of 15 to 34 year old men, the percentage of the right coronary arterial intima involved with atherosclerosis was correlated with age, smoking, combination of LDL and VLDL cholesterol levels, and negatively associated with HDL cholesterol. The association of childhood TG with young adult CVD in our current report is consistent with adult studies where non-fasting TG and fasting TG are independent risk factors for CVD and for ischemic stroke.
In the current study, LDLC in childhood was not significantly associated with young adult CVD, in either univariate or multivariate analyses. The predictive capability of childhood LDLC for adult CVD may have been muted by treatment of high LDLC in 31 young adult subjects, 3.6% of the adult cohort. Thus, the failure of childhood LDLC to predict adult CVD might reflect an underpowered aim, with young adult treatment to lower LDLC contributing to loss of predictive power of LDLC. Our observation that a “weaker” childhood risk factor (TG) was more likely to predict CVD than the more strongly associated LDLC may, speculatively reflect the presence of pediatric metabolic syndrome, a known predictor of adult CVD.
In the current study, independent pediatric explanatory variables for IFG + T2DM at mean age 38.5 included high childhood glucose, parental T2DM, and childhood cigarette smoking. These findings parallel those in adults. Our findings are congruent with those of Magnussen et al, Nguyen et al and Ouyang et al, and should facilitate primary prevention of IFG + T2DM, starting in childhood.
In the current study, childhood independent explanatory variables for young adult HBP included childhood BMI and blood pressure. Rademacher et al has reported that childhood BMI and blood pressure predicted young adult blood pressure, similar to our findings, and concluded that combined HBP and high BMI in childhood are additive in predicting young adult cardiovascular risk. In the Bogalusa Louisiana study, Srinivasan et al reported that adiposity and high blood pressure beginning in childhood, along with accelerated adverse longitudinal changes in risk variables of metabolic syndrome through young adulthood, characterize the early natural history of hypertension.
Conventionally, parental history of CVD serves as an indication for screening for lipid abnormalities in children. However, the 40 year old ostensibly healthy parent is unlikely to have systematic or practically successful screening for CVD risk factors. Identification of CVD risk factors in the child can directly facilitate primary prevention in the child through young adulthood, and also focus diagnostic attention on the potentially high risk parent.
Recently, the American Academy of Pediatrics issued a policy statement on lipid screening and cardiovascular health in childhood. A targeted approach, reliant to a large degree on family history, was suggested. Overweight children were identified as a special risk category in need of screening irrespective of family history or other risk factors. In adults, the NCEP has adopted the Framingham risk score to determine which patients are at the highest 10-year risk for CVD and would benefit from aggressive treatment. In childhood, however, there is no comparable risk score, and controversy exists whether screening on a basis of family history should be done in childhood. Our current study suggests that pediatric screening for risk factors for CVD, IFG+T2DM, and HBP in unselected schoolchildren has important diagnostic value for themselves 26 years later in young adulthood.
Table 3.
Childhood Predictors for cardiovascular disease (CVD), type 2 diabetes (T2DM), and high blood pressure (HBP) 26 years later.
| Young adult outcome | Childhood Predictors | p | OR,95% CI | |
|---|---|---|---|---|
|
CVD (19 Yes, 862 no)a 881 observations used AUC=0.670 |
TG (high vs not high) | .0002 | 5.85, 2.32–14.74 | |
|
IFG/T2DM (114 Yes, 535 no)b 649 observations used AUC=0.645 |
Parents had T2DM (Yes vs No) | .0011 | 2.22, 1.38–3.60 | |
| Glucose (high vs not high) | .0002 | 4.43, 2.03–9.66 | ||
| Cigarette smoking (yes/no), | .036 | 1.64, 1.03–2.61 | ||
|
Hypertension (133 Yes, 475 no)c 608 observations used AUC=0.657 |
BMI (high vs not high) | <.0001 | 2.70, 1.71–4.27 | |
| BP (high vs not high) | .0009 | 2.52, 1.46–4.34 | ||
stepwise logistic regression (SLE=.15, SLS=.05) from categorical explanatory variables: race, childhood risk factors TG, HDLC, LDLC, BMI, glucose; cigarette smoking (yes/no), parents had CVD (yes/no), parents had CVD before age 50 (yes/no) and parents had CVD before age 60 (yes/no).
stepwise logistic regression (SLE=.15, SLS=.05) from categorical explanatory variables: race, childhood risk factors TG, HDLC, LDLC, BMI, BP, glucose; cigarette smoking (yes/no), parents had T2DM (yes/no).
stepwise logistic regression (SLE=.15, SLS=.05) from categorical explanatory variables: race, childhood risk factors TG, HDLC, LDLC, BMI, BP, glucose; cigarette smoking (yes/no), parents had HBP (yes/no).
Explanatory variables selected by stepwise selection, then model re-run using SURVEYLOGISTIC to address sibling clusters
Table 4.
Nineteen cases having cardiovascular events before age 42 years.
Risk factors* for cardiovascular disease during childhood-adolescence at the LRC and during young adulthood at the PFS.
| Gender | Race | Age | CVD age | BMI | TG | HDL | LDL | BP | Glucose | Waist | ||||||||
|---|---|---|---|---|---|---|---|---|---|---|---|---|---|---|---|---|---|---|
| LRC | PFS | LRC | PFS | LRC | PFS | LRC | PFS | LRC | PFS | LRC | PFS | LRC | PFS | PFS | ||||
| (year) | (year) | (kg/m2) | (mg/dl) | (mg/dl) | (mg/dl) | (mmHg) | (mg/dl) | (cm) | ||||||||||
| 1 | Male | White | 11.2 | 36.9 | 32 | 22.3 | 32.9 | 163 | 279 | 38 | 24 | 155 | 132 | 114/70 | 142/101 | 91 | 94 | 118 |
| 2 | Male | White | 12.4 | 38.7 | 37 | 24.2 | 28.8 | 120 | 237 | 32 | 37 | 102 | 111 | 128/54 | 137/72 | 109 | 179 | 90 |
| 3 | Male | White | 12.8 | 40.5 | 38 | 18.7 | 30.9 | 90 | 242 | 49 | 24 | 109 | 150 | --- | 117/78 | 88 | 75 | 114 |
| 4 | Male | White | 13.4 | 38.7 | 32 | 16.2 | 29.3 | 55 | 175 | 67 | 43 | 102 | 129 | 96/56 | 109/72 | 99 | --- | 103 |
| 5 | Male | White | 13.8 | 39.8 | 34 | --- | 36.9 | 113 | 231 | 44 | 42 | 103 | 157 | --- | 136/96 | 74 | 107 | 121 |
| 6 | Male | White | 16.5 | 44.4 | 41 | 29.7 | 43.6 | 251 | 379 | 45 | 29 | 105 | 101 | 108/70 | 169/108 | 92 | 100 | 134 |
| 7 | Male | White | 17.2 | 42.2 | 41 | 26.2 | 43.9 | 92 | 350 | 49 | 25 | 108 | 95 | 108/80 | 128/91 | 81 | 122 | 125 |
| 8 | Male | White | 17.1 | 44.4 | 43 | 26.6 | 27.1 | 285 | 147 | 46 | 40 | 104 | 82 | 130/86 | 122/80 | 85 | 88 | --- |
| 9 | Male | Black | 17.8 | 43.2 | 41 | 19.2 | 31.8 | 46 | --- | 59 | --- | 135 | --- | 112/68 | 122/82 | 73 | --- | 101 |
| 10 | Male | White | 18.1 | 45.4 | 30 | 35.1 | 31.3 | 265 | 290 | 37 | 28 | 184 | 107 | 128/90 | 109/78 | 93 | 224 | 107 |
| 11 | Male | White | 18.6 | 47.1 | 31 | 20.8 | 23.2 | 172 | 198 | 47 | 36 | 109 | 116 | 108/62 | 109/76 | 86 | 71 | 87 |
| 12 | Male | White | 20.5 | 44.2 | 42 | 20.7 | 29.7 | 76 | 91 | 45 | 30 | 95 | 137 | --- | 116/73 | 81 | 109 | 97 |
| 13 | Female | Black | 11.3 | 35.6 | 25 | 16.6 | 30.6 | 41 | 38 | 107 | 72 | 83 | 73 | 88/58 | 109/74 | 81 | 81 | 99 |
| 14 | Female | Black | 12.5 | 39.5 | 38 | 21.5 | 23.7 | 70 | 43 | 62 | 64 | 107 | 98 | 108/62 | 124/86 | 84 | 80 | 80 |
| 15 | Female | White | 14.1 | 40.6 | 39 | 21.9 | 30.1 | 62 | 217 | 69 | 46 | 98 | 130 | --- | 133/78 | 86 | 97 | 102 |
| 16 | Female | White | 16.2 | 41.8 | 41 | 34.9 | 38.4 | 168 | 632 | 41 | 18 | 122 | 67 | 132/62 | 142/91 | 90 | 233 | 127 |
| 17 | Female | White | 16.8 | 40.7 | 39 | 27.4 | 37.6 | 168 | 739 | 59 | 58 | 74 | 40 | --- | 149/97 | 91 | 107 | 134 |
| 18 | Female | Black | 17.6 | 43.2 | 40 | 25.0 | 39.6 | 92 | 73 | 63 | 50 | 102 | 128 | 112/70 | 138/92 | 77 | 188 | 128 |
| 19 | Female | Black | 15.2 | 41.3 | 40 | 31.2 | 41.4 | 75 | 165 | 50 | 46 | 125 | 132 | 118/68 | 123/93 | 101 | --- | 121 |
|
| ||||||||||||||||||
| # of Abnormal (%) | 9/18 (50%) | 13/19 (68%) | 9/19 (47%) | 13/18 (72%) | 5/19 (26%) | 11/18 (61%) | 5/19 (26%) | 0/18 (0%) | 4/14 (29%) | 11/19 (58%) | 2/19 (11%) | 9/16 (56%) | 13/18 (72%) | |||||
Bold italic numbers denote abnormal according to risk factor cutoffs used
Acknowledgments
Supported by American Heart Association (National) 9750129N and NIH-HL62394 (Dr Morrison), and by the Lipoprotein Research Fund of the Jewish Hospital of Cincinnati (Dr Glueck).
Dr Silpa Masenini, Dr Amanpeet Bahr assisted with data verification.
Funding: Supported by American Heart Association (National) 9750129N and NIH-HL62394 (Dr Morrison), and by the Lipoprotein Research Fund of the Jewish Hospital of Cincinnati (Dr Glueck).
Abbreviations
- CVD
cardiovascular disease
- IFG + T2DM
a composite variable including impaired fasting glucose and type 2 diabetes mellitus
- T2DM
type 2 diabetes mellitus
- IFG
impaired fasting glucose
- HBP
high blood pressure
- SBP
systolic blood pressure
- DBP
diastolic blood pressure
- TG
triglyceride
- LDLC
low density lipoprotein cholesterol
- HDLC
high density lipoprotein cholesterol
- LRC
Lipid Research Clinics
- PFS
Princeton Follow-up Study
Footnotes
Disclosure statement: The authors have no conflict of interest
Author Contribution: Drs Morrison and Glueck participated in all aspects of the study. Dr Wang participated in data analysis, data interpretation, and manuscript writing.
Publisher's Disclaimer: This is a PDF file of an unedited manuscript that has been accepted for publication. As a service to our customers we are providing this early version of the manuscript. The manuscript will undergo copyediting, typesetting, and review of the resulting proof before it is published in its final citable form. Please note that during the production process errors may be discovered which could affect the content, and all legal disclaimers that apply to the journal pertain.
References
- 1.Juonala M, Magnussen CG, Venn A, et al. Influence of age on associations between childhood risk factors and carotid intima-media thickness in adulthood: the Cardiovascular Risk in Young Finns Study, the Childhood Determinants of Adult Health Study, the Bogalusa Heart Study, and the Muscatine Study for the International Childhood Cardiovascular Cohort (i3C) Consortium. Circulation. 2010;122:2514–20. doi: 10.1161/CIRCULATIONAHA.110.966465. [DOI] [PubMed] [Google Scholar]
- 2.Juonala M, Viikari JS, Kahonen M, et al. Life-time risk factors and progression of carotid atherosclerosis in young adults: the Cardiovascular Risk in Young Finns study. Eur Heart J. 2010;31:1745–51. doi: 10.1093/eurheartj/ehq141. [DOI] [PubMed] [Google Scholar]
- 3.Magnussen CG, Venn A, Thomson R, et al. The association of pediatric low- and high-density lipoprotein cholesterol dyslipidemia classifications and change in dyslipidemia status with carotid intima-media thickness in adulthood evidence from the cardiovascular risk in Young Finns study, the Bogalusa Heart study, and the CDAH (Childhood Determinants of Adult Health) study. J Am Coll Cardiol. 2009;53:860–9. doi: 10.1016/j.jacc.2008.09.061. [DOI] [PMC free article] [PubMed] [Google Scholar]
- 4.Freedman DS, Dietz WH, Tang R, et al. The relation of obesity throughout life to carotid intima-media thickness in adulthood: the Bogalusa Heart Study. Int J Obes Relat Metab Disord. 2004;28:159–66. doi: 10.1038/sj.ijo.0802515. [DOI] [PubMed] [Google Scholar]
- 5.Morrison JA, Glueck CJ, Horn PS, et al. Pediatric triglycerides predict cardiovascular disease events in the fourth to fifth decade of life. Metabolism. 2009;58:1277–84. doi: 10.1016/j.metabol.2009.04.009. [DOI] [PMC free article] [PubMed] [Google Scholar]
- 6.Berenson GS, Srinivasan SR, Bao W, et al. Association between multiple cardiovascular risk factors and atherosclerosis in children and young adults. The Bogalusa Heart Study. N Engl J Med. 1998;338:1650–6. doi: 10.1056/NEJM199806043382302. [DOI] [PubMed] [Google Scholar]
- 7.Davis PH, Dawson JD, Riley WA, et al. Carotid intimal-medial thickness is related to cardiovascular risk factors measured from childhood through middle age: The Muscatine Study. Circulation. 2001;104:2815–9. doi: 10.1161/hc4601.099486. [DOI] [PubMed] [Google Scholar]
- 8.Raitakari OT, Juonala M, Kahonen M, et al. Cardiovascular risk factors in childhood and carotid artery intima-media thickness in adulthood: the Cardiovascular Risk in Young Finns Study. JAMA. 2003;290:2277–83. doi: 10.1001/jama.290.17.2277. [DOI] [PubMed] [Google Scholar]
- 9.Magnussen CG, Koskinen J, Chen W, et al. Pediatric metabolic syndrome predicts adulthood metabolic syndrome, subclinical atherosclerosis, and type 2 diabetes mellitus but is no better than body mass index alone: the Bogalusa Heart Study and the Cardiovascular Risk in Young Finns Study. Circulation. 2010;122:1604–11. doi: 10.1161/CIRCULATIONAHA.110.940809. [DOI] [PMC free article] [PubMed] [Google Scholar]
- 10.McMahan CA, Gidding SS, Malcom GT, et al. Pathobiological determinants of atherosclerosis in youth risk scores are associated with early and advanced atherosclerosis. Pediatrics. 2006;118:1447–55. doi: 10.1542/peds.2006-0970. [DOI] [PubMed] [Google Scholar]
- 11.The Lipid Research Clinics Coronary Primary Prevention Trial results. II. The relationship of reduction in incidence of coronary heart disease to cholesterol lowering. JAMA. 1984;251:365–74. [PubMed] [Google Scholar]
- 12.Five-year findings of the hypertension detection and follow-up program. II. Mortality by race-sex and age. Hypertension Detection and Follow-up Program Cooperative Group. JAMA. 1979;242:2572–7. doi: 10.1001/jama.1979.03300230028022. [DOI] [PubMed] [Google Scholar]
- 13.Berenson GS, Pickoff AS. Preventive cardiology and its potential influence on the early natural history of adult heart diseases: the Bogalusa Heart Study and the Heart Smart Program. Am J Med Sci. 1995;310 (Suppl 1):S133–8. doi: 10.1097/00000441-199512000-00024. [DOI] [PubMed] [Google Scholar]
- 14.National Cholesterol Education Program (NCEP): highlights of the report of the Expert Panel on Blood Cholesterol Levels in Children and Adolescents. Pediatrics. 1992;89:495–501. [PubMed] [Google Scholar]
- 15.Daniels SR, Greer FR. Lipid screening and cardiovascular health in childhood. Pediatrics. 2008;122:198–208. doi: 10.1542/peds.2008-1349. [DOI] [PubMed] [Google Scholar]
- 16.Morrison JA, Friedman LA, Wang P, et al. Metabolic syndrome in childhood predicts adult metabolic syndrome and type 2 diabetes mellitus 25 to 30 years later. J Pediatr. 2008;152:201–6. doi: 10.1016/j.jpeds.2007.09.010. [DOI] [PubMed] [Google Scholar]
- 17.Morrison JAGC, Horn PS, Wang P. Childhood predictors of adults type 2 diabetes 9 and 26 years later. AMA Archives of Pediatrics and Adolescent Medicine. 2009 doi: 10.1001/archpediatrics.2009.228. In Press. [DOI] [PubMed] [Google Scholar]
- 18.Murabito JM, Nam BH, D’Agostino RB, Sr, et al. Accuracy of offspring reports of parental cardiovascular disease history: the Framingham Offspring Study. Ann Intern Med. 2004;140:434–40. doi: 10.7326/0003-4819-140-6-200403160-00010. [DOI] [PubMed] [Google Scholar]
- 19.Dabelea D, Bell RA, D’Agostino RB, Jr, et al. Incidence of diabetes in youth in the United States. Jama. 2007;297:2716–24. doi: 10.1001/jama.297.24.2716. [DOI] [PubMed] [Google Scholar]
- 20.Magnussen CG, Raitakari OT, Thomson R, et al. Utility of currently recommended pediatric dyslipidemia classifications in predicting dyslipidemia in adulthood: evidence from the Childhood Determinants of Adult Health (CDAH) study, Cardiovascular Risk in Young Finns Study, and Bogalusa Heart Study. Circulation. 2008;117:32–42. doi: 10.1161/CIRCULATIONAHA.107.718981. [DOI] [PubMed] [Google Scholar]
- 21.Cook S, Weitzman M, Auinger P, et al. Prevalence of a metabolic syndrome phenotype in adolescents: findings from the third National Health and Nutrition Examination Survey, 1988–1994. Arch Pediatr Adolesc Med. 2003;157:821–7. doi: 10.1001/archpedi.157.8.821. [DOI] [PubMed] [Google Scholar]
- 22.The fourth report on the diagnosis, evaluation, and treatment of high blood pressure in children and adolescents. Pediatrics. 2004;114:555–76. [PubMed] [Google Scholar]
- 23.Grundy SM, Cleeman JI, Daniels SR, et al. Diagnosis and management of the metabolic syndrome: an American Heart Association/National Heart, Lung, and Blood Institute scientific statement. Curr Opin Cardiol. 2006;21:1–6. doi: 10.1097/01.hco.0000200416.65370.a0. [DOI] [PubMed] [Google Scholar]
- 24.Rahalkar AR, Hegele RA. Monogenic pediatric dyslipidemias: classification, genetics and clinical spectrum. Mol Genet Metab. 2008;93:282–94. doi: 10.1016/j.ymgme.2007.10.007. [DOI] [PubMed] [Google Scholar]
- 25.Pearson TA, Bulkley BH, Achuff SC, et al. The association of low levels of HDL cholesterol and arteriographically defined coronary artery disease. Am J Epidemiol. 1979;109:285–95. doi: 10.1093/oxfordjournals.aje.a112682. [DOI] [PubMed] [Google Scholar]
- 26.de Ferranti SD, Crean S, Cotter J, et al. Hypertriglyceridemia in a pediatric referral practice: experience with 300 patients. Clin Pediatr (Phila) 2011;50:297–307. doi: 10.1177/0009922810379498. [DOI] [PubMed] [Google Scholar]
- 27.Nicklas TA, von Duvillard SP, Berenson GS. Tracking of serum lipids and lipoproteins from childhood to dyslipidemia in adults: the Bogalusa Heart Study. Int J Sports Med. 2002;23 (Suppl 1):S39–43. doi: 10.1055/s-2002-28460. [DOI] [PubMed] [Google Scholar]
- 28.Eisenmann JC, Welk GJ, Wickel EE, et al. Stability of variables associated with the metabolic syndrome from adolescence to adulthood: the Aerobics Center Longitudinal Study. Am J Hum Biol. 2004;16:690–6. doi: 10.1002/ajhb.20079. [DOI] [PubMed] [Google Scholar]
- 29.Webber LS, Srinivasan SR, Wattigney WA, et al. Tracking of serum lipids and lipoproteins from childhood to adulthood. The Bogalusa Heart Study. Am J Epidemiol. 1991;133:884–99. doi: 10.1093/oxfordjournals.aje.a115968. [DOI] [PubMed] [Google Scholar]
- 30.Nguyen QM, Srinivasan SR, Xu JH, et al. Utility of childhood glucose homeostasis variables in predicting adult diabetes and related cardiometabolic risk factors: the Bogalusa Heart Study. Diabetes Care. 2010;33:670–5. doi: 10.2337/dc09-1635. [DOI] [PMC free article] [PubMed] [Google Scholar]
- 31.Manlhiot C, Larsson P, Gurofsky RC, et al. Spectrum and management of hypertriglyceridemia among children in clinical practice. Pediatrics. 2009;123:458–65. doi: 10.1542/peds.2008-0367. [DOI] [PubMed] [Google Scholar]
- 32.McCrindle BW, Urbina EM, Dennison BA, et al. Drug therapy of high-risk lipid abnormalities in children and adolescents: a scientific statement from the American Heart Association Atherosclerosis, Hypertension, and Obesity in Youth Committee, Council of Cardiovascular Disease in the Young, with the Council on Cardiovascular Nursing. Circulation. 2007;115:1948–67. doi: 10.1161/CIRCULATIONAHA.107.181946. [DOI] [PubMed] [Google Scholar]
- 33.Mahoney LT, Burns TL, Stanford W, et al. Coronary risk factors measured in childhood and young adult life are associated with coronary artery calcification in young adults: the Muscatine Study. J Am Coll Cardiol. 1996;27:277–84. doi: 10.1016/0735-1097(95)00461-0. [DOI] [PubMed] [Google Scholar]
- 34.Berenson GS, Wattigney WA, Tracy RE, et al. Atherosclerosis of the aorta and coronary arteries and cardiovascular risk factors in persons aged 6 to 30 years and studied at necropsy (The Bogalusa Heart Study) Am J Cardiol. 1992;70:851–8. doi: 10.1016/0002-9149(92)90726-f. [DOI] [PubMed] [Google Scholar]
- 35.Newman WP, 3rd, Freedman DS, Voors AW, et al. Relation of serum lipoprotein levels and systolic blood pressure to early atherosclerosis. The Bogalusa Heart Study. N Engl J Med. 1986;314:138–44. doi: 10.1056/NEJM198601163140302. [DOI] [PubMed] [Google Scholar]
- 36.Relationship of atherosclerosis in young men to serum lipoprotein cholesterol concentrations and smoking. A preliminary report from the Pathobiological Determinants of Atherosclerosis in Youth (PDAY) Research Group. JAMA. 1990;264:3018–24. doi: 10.1001/jama.1990.03450230054029. [DOI] [PubMed] [Google Scholar]
- 37.Bansal S, Buring JE, Rifai N, et al. Fasting compared with nonfasting triglycerides and risk of cardiovascular events in women. Jama. 2007;298:309–16. doi: 10.1001/jama.298.3.309. [DOI] [PubMed] [Google Scholar]
- 38.McBride PE. Triglycerides and risk for coronary heart disease. Jama. 2007;298:336–8. doi: 10.1001/jama.298.3.336. [DOI] [PubMed] [Google Scholar]
- 39.Nordestgaard BG, Benn M, Schnohr P, et al. Nonfasting triglycerides and risk of myocardial infarction, ischemic heart disease, and death in men and women. Jama. 2007;298:299–308. doi: 10.1001/jama.298.3.299. [DOI] [PubMed] [Google Scholar]
- 40.Sarwar N, Danesh J, Eiriksdottir G, et al. Triglycerides and the risk of coronary heart disease: 10,158 incident cases among 262,525 participants in 29 Western prospective studies. Circulation. 2007;115:450–8. doi: 10.1161/CIRCULATIONAHA.106.637793. [DOI] [PubMed] [Google Scholar]
- 41.Austin MA, McKnight B, Edwards KL, et al. Cardiovascular disease mortality in familial forms of hypertriglyceridemia: A 20-year prospective study. Circulation. 2000;101:2777–82. doi: 10.1161/01.cir.101.24.2777. [DOI] [PubMed] [Google Scholar]
- 42.Kannel WB, Vasan RS. Triglycerides as vascular risk factors: new epidemiologic insights. Curr Opin Cardiol. 2009;24:345–50. doi: 10.1097/HCO.0b013e32832c1284. [DOI] [PMC free article] [PubMed] [Google Scholar]
- 43.Onat A, Sari I, Yazici M, et al. Plasma triglycerides, an independent predictor of cardiovascular disease in men: a prospective study based on a population with prevalent metabolic syndrome. Int J Cardiol. 2006;108:89–95. doi: 10.1016/j.ijcard.2005.06.056. [DOI] [PubMed] [Google Scholar]
- 44.Varbo A, Nordestgaard BG, Tybjaerg-Hansen A, et al. Nonfasting triglycerides, cholesterol, and ischemic stroke in the general population. Ann Neurol. 2011 doi: 10.1002/ana.22384. [DOI] [PubMed] [Google Scholar]
- 45.Morrison JA, Friedman LA, Gray-McGuire C. Metabolic syndrome in childhood predicts adult cardiovascular disease 25 years later: the Princeton Lipid Research Clinics Follow-up Study. Pediatrics. 2007;120:340–5. doi: 10.1542/peds.2006-1699. [DOI] [PubMed] [Google Scholar]
- 46.Rafalson L, Donahue RP, Dmochowski J, et al. Cigarette smoking is associated with conversion from normoglycemia to impaired fasting glucose: the Western New York Health Study. Ann Epidemiol. 2009;19:365–71. doi: 10.1016/j.annepidem.2009.01.013. [DOI] [PMC free article] [PubMed] [Google Scholar]
- 47.Ozdemir L, Topcu S, Nadir I, et al. The prevalence of diabetes and impaired glucose tolerance in Sivas, Central Anatolia, Turkey. Diabetes Care. 2005;28:795–8. doi: 10.2337/diacare.28.4.795. [DOI] [PubMed] [Google Scholar]
- 48.Nguyen QM, Srinivasan SR, Xu JH, et al. Fasting plasma glucose levels within the normoglycemic range in childhood as a predictor of prediabetes and type 2 diabetes in adulthood: the Bogalusa Heart Study. Arch Pediatr Adolesc Med. 2010;164:124–8. doi: 10.1001/archpediatrics.2009.268. [DOI] [PubMed] [Google Scholar]
- 49.Ouyang F, Wang W, Shen F, et al. Genetic epidemiological study on non-insulin dependent diabetes mellitus. Zhonghua Yu Fang Yi Xue Za Zhi. 2000;34:81–2. [PubMed] [Google Scholar]
- 50.Rademacher ER, Jacobs DR, Jr, Moran A, et al. Relation of blood pressure and body mass index during childhood to cardiovascular risk factor levels in young adults. J Hypertens. 2009;27:1766–74. doi: 10.1097/HJH.0b013e32832e8cfa. [DOI] [PMC free article] [PubMed] [Google Scholar]
- 51.Srinivasan SR, Myers L, Berenson GS. Changes in metabolic syndrome variables since childhood in prehypertensive and hypertensive subjects: the Bogalusa Heart Study. Hypertension. 2006;48:33–9. doi: 10.1161/01.HYP.0000226410.11198.f4. [DOI] [PubMed] [Google Scholar]
- 52.Schwandt P, Haas GM, Liepold E. Lifestyle and cardiovascular risk factors in 2001 child-parent pairs: the PEP Family Heart Study. Atherosclerosis. 2010;213:642–8. doi: 10.1016/j.atherosclerosis.2010.09.032. [DOI] [PubMed] [Google Scholar]
- 53.Dennison BA, Kikuchi DA, Srinivasan SR, et al. Parental history of cardiovascular disease as an indication for screening for lipoprotein abnormalities in children. J Pediatr. 1989;115:186–94. doi: 10.1016/s0022-3476(89)80063-0. [DOI] [PubMed] [Google Scholar]
- 54.Greenland P, Smith SC, Jr, Grundy SM. Improving coronary heart disease risk assessment in asymptomatic people: role of traditional risk factors and noninvasive cardiovascular tests. Circulation. 2001;104:1863–7. doi: 10.1161/hc4201.097189. [DOI] [PubMed] [Google Scholar]
- 55.Boulware LE, Marinopoulos S, Phillips KA, et al. Systematic review: the value of the periodic health evaluation. Ann Intern Med. 2007;146:289–300. doi: 10.7326/0003-4819-146-4-200702200-00008. [DOI] [PubMed] [Google Scholar]
- 56.Executive Summary of The Third Report of The National Cholesterol Education Program (NCEP) Expert Panel on Detection, Evaluation And Treatment of High Blood Cholesterol In Adults (Adult Treatment Panel III) Jama. 2001;285:2486–97. doi: 10.1001/jama.285.19.2486. [DOI] [PubMed] [Google Scholar]
- 57.Screening for lipid disorders in children: US Preventive Services Task Force recommendation statement. Pediatrics. 2007;120:e215–9. doi: 10.1542/peds.2006-1812. [DOI] [PubMed] [Google Scholar]