Abstract
Inhibitors of brain glial water channel aquaporin-4 (AQP4) are of potential clinical utility, as they are predicted to modulate brain edema, neuroexcitation and glial scarring. Recently, Huber et al. (Bioorgan. Med. Chem. 2007, 17:1270-3; 2008, in press) reported that a series of arylsulfomamides, antiepileptics, and related small molecules strongly inhibited AQP4 water transport with IC50s down to 1 μM. We retested the compounds with greatest reported potencies, including acetylsulfanilamide, acetazolamide, 6-ethoxy-benzothiazole-2-sulfonamide, topiramate, zonisamide, phenytoin, lamotrigine and sumatriptan, in AQP4-transfected mammalian cells and primary cultures of brain glial cells, using several sensitive assays of osmotic water permeability. Contrary to the findings of Huber et al., in our studies we found no significant inhibition of AQP4 water permeability by any of the compounds at concentrations up to 100 μM.
Keywords: water transport, aquaporin, AQP4, antiepileptics, carbonic anhydrase
1. Introduction
Aquaporin-4 (AQP4) is a plasma membrane protein that functions as a water-selective transporter in glial cells throughout the central nervous system, as well as in selected cell types in lung, kidney, stomach and other tissues. Phenotype analysis of AQP4 knockout mice has revealed the involvement of AQP4 in water movement into and out of the brain, in neuroexcitation phenomena such as seizure activity and cortical spreading depression, and in glial cell migration1. AQP4 knockout mice showed improved survival compared to control wildtype mice in models of cytotoxic brain edema, including water intoxication, ischemic stroke and bacterial meningitis2,3. Recently, greatly improved neurological outcome was found in AQP4 knockout mice following spinal cord injury, which was associated with reduced spinal cord swelling and nerve cell protection4. AQP4 knockout mice also manifest prolonged seizure activity5 and delayed potassium reuptake from the extracellular space during cortical spreading depression6. Inhibitors of AQP4 are thus of potential clinical utility in reducing brain water accumulation in cytotoxic brain edema, in improving outcome in spinal cord injury, and in reducing glial scar formation to promote neuronal regeneration after injury. AQP4 inhibition, despite its association with elevated seizure threshold following chemical convulsants7, is predicted to worsen seizure activity, as the duration and severity of chemically and electrically induced seizures were remarkably greater in AQP4 knockout vs. control mice5.
Recently, three papers from one laboratory reported AQP4 inhibition by a series of arylsulfonamides, antiepileptic drugs, and related molecules, with strong inhibition at low micromolar concentrations8-10. The rationale for their investigation of arylsulfonamides, such as acetazolamide, was reports suggesting acetazolamide inhibition of a different water channel, AQP111-13. However, subsequent measurements in multiple systems in our laboratory14 and others15 showed that arylsulfonamides do not inhibit AQP1 water transport. The rationale for their investigation of antiepileptics was structural similarity of some antiepileptics to the arylsulfonamides and the speculation that antiepileptics may exert their effect, in part, by AQP4 water transport inhibition10. However, as mentioned above, AQP4 inhibition would likely worsen rather than prevent seizures. It was surprising that a high percentage of tested molecules, of different chemical classes, were found to function as potent AQP4 inhibitors. Despite considerable effort, other than heavy metal ions such as mercury16,17, no verified small-molecule inhibitors of any aquaporin have been identified. Indeed, screening of tens of thousands of small diverse compounds as aquaporin inhibitors yielded few active compounds of relatively low potency (unpublished results).
Because of the considerable utility of potent, non-toxic AQP4 inhibitors as research tools and potential drugs, we re-evaluated the compounds reported by Huber et al. to be potent AQP4 water transport inhibitors. However, utilizing several sensitive assays of osmotic water transport in AQP4 transfected and natively expressing cells, including primary cultures of brain glial cells, we did not find water transport inhibition by the compounds of Huber et al.
2. Results
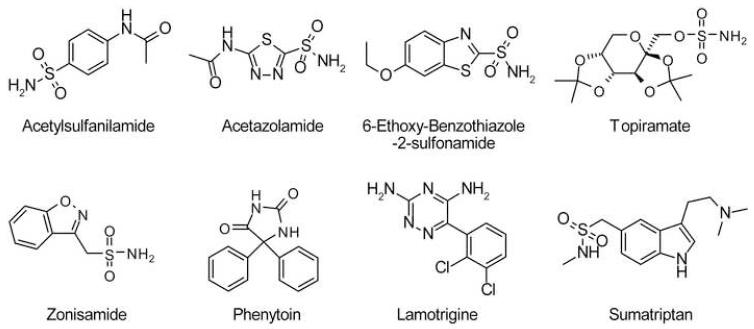
Fig. 1 shows chemical structures of the putative AQP4 water transport inhibitors studied here. They represent the most potent compounds reported by Huber et al.8-10 of the arylsulfomaide class [acetylsulfanilamide (ASA), acetazolamide (AZA), 6-ethoxy-benzothiazole-2-sulfonamide (EZA), topiramate (TPM) and zonisamide (ZNS)], antiepileptics [phenytoin (PHT) and lamotrigine (LTG)], and a small-molecule deduced from docking analysis [sumatriptan (SMT)]. Several sensitive and complementary water permeability assays were conducted.
Figure 1. Structures of putative AQP4 inhibitors tested in this study.
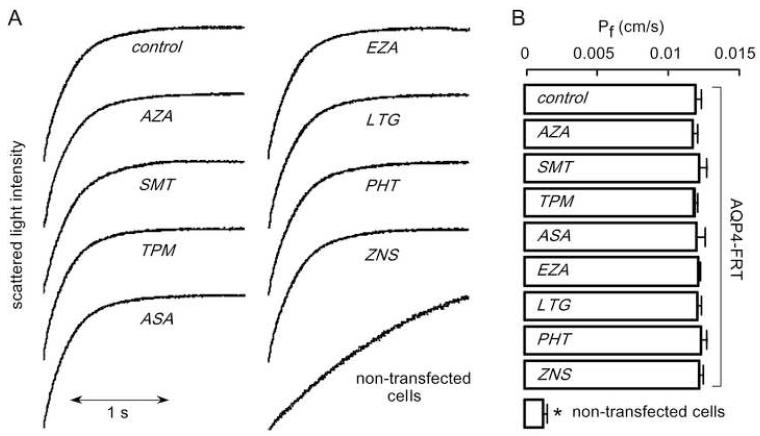
Plasma membrane osmotic water permeability was measured in FRT cells stably expressing AQP4, with non-transfected FRT cells as control. For these experiments plasma membrane vesicles were isolated by a cell fractionation procedure and osmotic water permeability measured by a stopped-flow light scattering method in which exposure of vesicles to a hyperosmolar solution causes vesicles shrinking and increased scattered light intensity. This is a highly reproducible and sensitive assay capable of detecting < 5-10% differences in water permeability. Measurements were done at low temperature (10 °C), where the strongly temperature-dependent lipid-mediated water permeability is minimized. Fig. 2A shows representative light scattering data. Vesicle shrinking was much faster in plasma membrane vesicles from AQP4-expressing than non-transfected cells. The computed osmotic water permeability coefficient (Pf) for the AQP4-containing vesicles was 0.0129 ± 0.0004 cm/s, much greater than that in control vesicles (0.0012 ± 0.0003 cm/s). Fig. 2B summarizes averaged Pf values, showing standard errors from 5 sets of studies. Pf was not changed significantly by any of the test compounds, which were incubated with vesicles at 100 μM concentration for 15 min prior to measurements. Additional studies showed no inhibition of the compounds at a lower concentration (10 μM) or after 60 min incubation at 100 μM (data not shown).
Figure 2. Osmotic water permeability in FRT cell plasma membrane vesicles measured by stopped-flow light scattering.
Osmotic water permeability was measured from the time course of scattered light intensity in response to a 250 mM inwardly directed sucrose gradient. (A) Measurements in vesicles from AQP4-expressing and non-transfected FRT cells done at 10 °C under control conditions (top curves) and in the presence of indicated compounds (each 100 μM). Vesicles were incubated with test compounds for 15 min before measurements. (B) Averaged osmotic water permeability coefficients (Pf) for experiments as in (A) (mean ± S.E., 5 measurements per sample). *P < 0.01 compared to control.
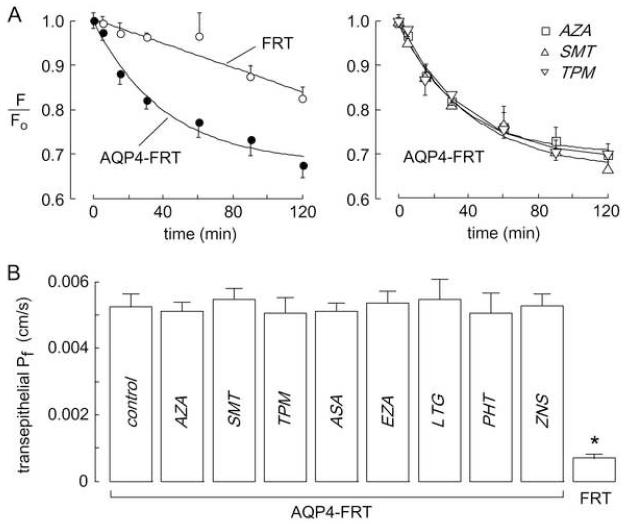
The FRT cell system was also used to measure transepithelial osmotic water permeability by a dye dilution method. The fluorescence of an apical solution volume marker provided a quantitative readout of osmotically driven water transport across the cell layer. Transepithelial Pf was deduced from the kinetics of dye dilution in response to a 300 mM gradient of mannitol to induce basolateral-to-apical osmotic water flux. Dye dilution was much faster in AQP4-expressing than non-transfected FRT cells. Representative original dye dilution data are shown in Fig. 3A and transepithelial Pf values are summarized in Fig. 3B. There was no significant difference in Pf in AQP4-expressing cells that were pretreated for 15 min with test compounds at 100 μM concentration.
Figure 3. Transepithelial osmotic water permeability in AQP4-expressing FRT cell monolayers.
Water permeability measured at 23 °C by a dye dilution as described in the Experimental section. (A) Left, Kinetics of dye dilution in non-transfected FRT cells (open circles) and AQP4-expressing FRT cells (closed circles). Right, Dye dilution curves in AQP4-expressing FRT cells treated with test compounds at 100 μM. (B) Summary of water transport rates, expressed as reciprocal exponential time constants) (mean ± S.E., n=3). *P < 0.01 compared to control.
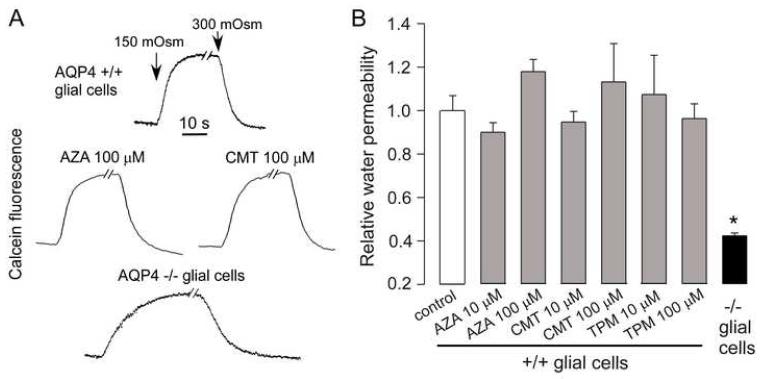
Several of the compounds were also tested for their effect on AQP4 water permeability in primary cultures of brain glial cells that natively express AQP4. Osmotic water permeability was measured by a calcein quenching assay in which reduced extracellular osmolality causes cell swelling and instantaneous dilution of cytoplasmic calcein fluorescence. Cells grown on glass coverslips were superfused with buffers using a perfusion chamber designed for rapid fluid exchange18. Compounds were added 15 min before experiments and were present during the measurements. Representative calcein fluorescence data in Fig. 4A shows rapid cell volume equilibration following perfusate exchanges in cells from wildtype mice, significantly faster than in cells from AQP4 knockout mice. Test compounds added at 10 and 100 μM concentration did not affect the rate of osmotic volume equilibration as seen from the calcein quenching data (Fig. 4A) and relative osmotic water permeabilities (Fig. 4B), deduced from osmotic equilibration rates.
Figure 4. Osmotic water permeability in brain glial cells.
Osmotic water permeability measured at 23 °C in glial cell monolayers by a cytoplasmic calcein quenching method as described in the Experimental section. (A) Kinetics of calcein fluorescence in response to perfusate exchange between isosmolar and hypoosmolar (150 mOsm) buffers. Data shown for cultures from brains of wildtype mice in the absence of test compounds and after 15 min incubation with 100 μM compounds. Data for cultures from AQP4-null mice shown for comparison (bottom curve). (B) Summary of relative water permeabilities determined from reciprocal exponential time constants (S.E., n=3). *P < 0.01 compared to control).
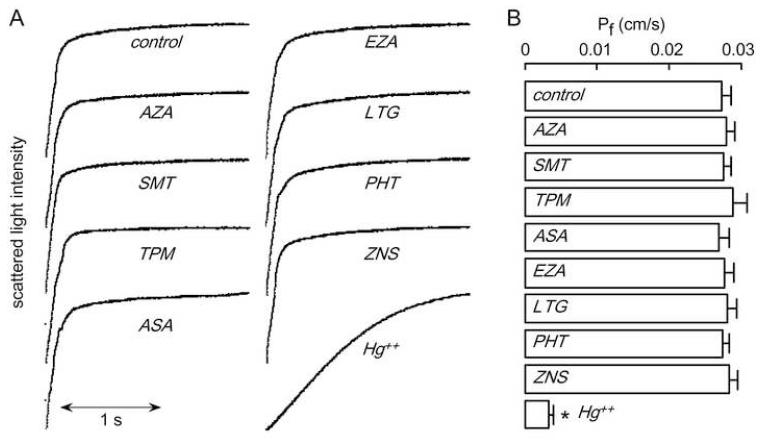
Last, we tested each of these compounds for their inhibition activity on a related water channel, AQP1. For these studies osmotic water permeability was measured on erythrocytes that natively express AQP1using the stopped-flow light scattering method. Fig. 5A shows original light scattering curves, with Pf values summarized in Fig. 5B. None of the compounds at 100 μM concentration produced significant inhibition of AQP1 water permeability, with the known AQP1 inhibitor HgCl2 producing strong inhibition.
Figure 5. Osmotic water permeability in mouse erythrocytes.
Osmotic water permeability was measured from the time course of scattered light intensity in response to a 250 mM inwardly directed sucrose gradient. (A) Measurements done at 10 °C under control conditions (top curve) and in the presence of test compounds (each 100 μM). Erythrocytes were incubated with test compounds for 15 min before measurements. (B) Averaged Pf values for experiments as in (A) (mean ± S.E., n=5). *P < 0.01 compared to control.
3. Discussion
Our measurements indicate that acetazolamide and various antiepileptics and related small molecules do not reduce the water permeability of AQP4 (or of AQP1). Measurements were done over a wide range of concentrations and using several different assays of osmotic water permeability capable of detecting < 5-10 % differences in water permeability. As mentioned in the Introduction, the reports that multiple, chemically unrelated antiepileptics functioned as potent AQP4 inhibitors was surprising, both because the rationale for testing these molecules (their structural similarity to arylsulfonamides) was flawed, and because AQP4 inhibition is predicted to worsen seizure activity. Our results thus do not support the conclusions of Huber et al.
We cannot account for strong AQP4 inhibition reported by Huber et al. Their experiments were performed using AQP4-expressing Xenopus oocytes using an osmotic swelling assay, in which oocyte volume was recorded once per minute following immersion of oocytes in a hyperosmolar solution. Their two recent papers9,10 report only percentage inhibition data rather than original oocyte swelling curves. It has been pointed out by Zeuthen and colleagues15, and is standard in the field, to conduct oocyte swelling studies using time resolution of 1 second or better in order to determine the initial oocyte swelling rate, as done in our original study reporting development of the oocyte swelling assay19. The problem with sampling oocyte volume once per minute is that oocyte volume after hypoosmolar challenge depends on multiple factors, including the activities of volume regulatory mechanisms and ion/solute transporters, and oocyte viability and physical properties. The AQP4 water permeability assays done here utilize established methods, and give reproducible, quantitative data on osmotic water permeability that are not confounded by volume regulation, unstirred layer or other effects.
Huber et al.9,10 also report a correlation between compound inhibition potency and computed AQP4-compound association energies, as deduced using BioMedCAChe molecular modeling software. It is difficult to assess the merit of the reported binding computations because of the use of a non-standard algorithm and because computational details (such as search space and energy minimization criteria) were not provided. Although not stated explicitly, the AQP4 structure data were likely those of the electron crystallography data set of Hiroaki et al.20, with reported in-plane resolution of ~3.2 Angstroms and out-of-plane resolution of ~3.6 Angstroms. Generally, meaningful docking computations require x-ray data with resolution of ~2.5 Angstroms or better21,22. Further, the utility of docking computations is questionable for a hydrophobic membrane protein, like AQP4, where significant lipid interactions, which are not considered in the computations, may dominate the interaction energetics.
We conclude that the arylsulfonamides, antiepileptics and related small molecules reported by Huber et al. do not inhibit AQP4 water permeability. The identification of potent inhibitors of AQP4 and other aquaporins, which are predicted to have multiple applications in brain and other diseases, remains a high priority.
4. Experimental
4.1. Chemicals
Acetylsulfanilamide (ASA), acetazolamide (AZA), 6-ethoxy-benzothiazole-2-sulfonamide (EZA), topiramate (TPM), zonisamide (ZNS), phenytoin (PHT) and lamotrigine (LTG) were purchased from Sigma-Aldrich (St. Louis, MO). Sumatriptan (SMT) was purchased from AK Scientific (Mountain View, CA). Stock solutions in DMSO were freshly prepared just before experiments.
4.2. Cell culture
Fisher rat thyroid epithelial (FRT) cells stably expressing AQP4 (and control, non-trasnfected cells) were grown in F12-Coombs medium (Sigma-Aldrich, St. Louis, MO) supplemented with 10% fetal bovine serum (Hyclone), penicillin G (100 U/ml), streptomycin (100 μg/ml) and geneticin (500 μg/ml) (antibiotic selection marker). For dye-dilution experiments, FRT cells were plated onto Transwell inserts (Corning Inc., Corning, NY) and used for flux measurements at resistances of 2-5 kΩ/cm2.
4.3. Stopped-flow water permeability assay
For measurement of water permeability in plasma membrane vesicles, the plasma membrane fractions were isolated from AQP4-expressing and non-transfected FRT cells by sucrose gradient centrifugation as reported previously23. Cells were homogenized in homogenizing buffer (250 mM sucrose, 10 mM Tris-Cl, pH 7.4, containing 20 μg/ml PMSF) by 20 strokes of a glass Dounce homogenizer. The homogenate was centrifuged at 500g for 10 min to remove nuclei and mitochondria. The supernatant was adjusted to 1.4 M sucrose. A discontinuous sucrose gradient [2M sucrose (3 ml), 1.6 M (6 ml), 1.4 M (12 ml, containing homogenate), 1.2 M (12 ml), 0.8 M (3 ml) was centrifuged for 2.5 h at 25,000 rpm in an SW 28 rotor, and top fraction (6 ml) was collected. After centrifugation, the pellet was suspended using a 30-gauge needle in 10 mM Tris-Cl buffer (pH 7.4) containing 20 μg/ml PMSF. Stopped-flow measurements were done on a Hi-Tech Sf-51 instrument. Suspensions of vesicles in Tris-Cl buffer were subjected to a 250 mM inwardly directed gradient of sucrose. The kinetics of decreasing cell volume was measured from the time course of 90° scattered light intensity at 530 nm wavelength. Osmotic water permeability coefficients (Pf) were computed from the light scattering time course, as described24. Test compounds were added to the vesicle suspension and the hyperosmolar sucrose solution (500 mM sucrose in Tris-Cl buffer) for 15 min before stopped-flow experiments.
4.4. Transepithelial water transport assay
Osmotic water transport across FRT epitihelial cell layers was determined using a dye dilution method, as described14,25. The dilution of a cell-impermeant, inert dye (Texas Red-dextran, 10 kDa, Molecular Probes, Eugene, OR) was used as a measure of transcellular osmotic water flux. The basal surface of cells on a porous filter was bathed in 1 ml of isosmolar PBS. The apical surface was bathed in 200 μl of hyperosmolar PBS (PBS + 300 mM D-mannitol) containing 0.25 mg/ml Texas Red-dextran. Test compounds (dissolved freshly from powder) were added to both the apical and basal-bathing buffers. Five μl samples of dye-containing apical fluid were collected at specified times. Samples were diluted in 2 ml of PBS and fluorescence was measured by cuvette fluorimetry (Fluoro Max-3, Horiba, Tokyo, Japan). Transepithelial osmotic water permeability coefficients (Pf in cm/s) were computed from indicator dilution data, as described25.
4.5. Glial cell water permeability assay
Primary cultures of glial cells from mouse brain neocortex were generated as described previously26. For some experiments cells were cultured from brains of AQP4 knockout mice27. Glial cell plasma membrane osmotic water permeability was measured using a calcein quenching method as described previously18,26. Cell cytoplasm was stained with calcein by incubation for 30 min in PBS containing 5 μM calcein-AM (Invitrogen). The time course of cytoplasmic calcein fluorescence was measured in response to cell swelling produced by 2-fold dilution of the extracellular bathing solution with water.
4.6. Erythrocyte water permeability
Mouse blood was collected from 8 to 12 week-old (25-35 g) wildtype mice by tail bleeding following subcutaneous injection with sodium heparin (150 USP units). Freshly obtained erythrocytes were washed three times in PBS to remove plasma and the cellular buffy coat. Suspensions of erythrocytes (0.5% hematocrit) in PBS were used for stopped-flow experiments, as described28. Animal protocols were approved by the University of California, San Francisco Committee on Animal Research.
Acknowledgments
This work was supported by grants DK35124, EY13574, HL59198, EB00415, DK72517 and HL73856 from the National Institutes of Health, and Research Development Program and Drug Discovery grants from the Cystic Fibrosis Foundation.
Footnotes
Publisher's Disclaimer: This is a PDF file of an unedited manuscript that has been accepted for publication. As a service to our customers we are providing this early version of the manuscript. The manuscript will undergo copyediting, typesetting, and review of the resulting proof before it is published in its final citable form. Please note that during the production process errors may be discovered which could affect the content, and all legal disclaimers that apply to the journal pertain.
References and notes
- 1.Verkman AS, Binder DK, Bloch O, Auguste KI, Papadopoulos MC. Biochem. Biophys. Acta. 2006;1758:1085. doi: 10.1016/j.bbamem.2006.02.018. [DOI] [PubMed] [Google Scholar]
- 2.Manley GT, Fujimura M, Ma T, Noshita N, Filiz F, Bollen AW, Chan P, Verkman AS. Nat. Med. 2000;6:159. doi: 10.1038/72256. [DOI] [PubMed] [Google Scholar]
- 3.Papadopoulos MC, Verkman AS. J. Biol. Chem. 2005;280:13906. doi: 10.1074/jbc.M413627200. [DOI] [PubMed] [Google Scholar]
- 4.Saadoun S, Bell BA, Verkman AS, Papadopoulos MC. Brain. 2008;131:1087. doi: 10.1093/brain/awn014. [DOI] [PubMed] [Google Scholar]
- 5.Binder DK, Yao X, Zador Z, Sick TJ, Verkman AS, Manley GT. Glia. 2006;53:631. doi: 10.1002/glia.20318. [DOI] [PubMed] [Google Scholar]
- 6.Padmawar P, Yao X, Bloch O, Manley GT, Verkman AS. Nat. Meth. 2005;2:825. doi: 10.1038/nmeth801. [DOI] [PubMed] [Google Scholar]
- 7.Binder DK, Oshio K, Ma T, Verkman AS, Manley GT. Neuroreport. 2004;15:259. doi: 10.1097/00001756-200402090-00009. [DOI] [PubMed] [Google Scholar]
- 8.Huber VJ, Tsujita M, Yamazaki M, Sakimura K, Nakada T. Bioorg. Med. Chem. Lett. 2007;17:1270. doi: 10.1016/j.bmcl.2006.12.010. [DOI] [PubMed] [Google Scholar]
- 9.Huber VJ, Tsujita M, Nakada T. Bioorg. Med. Chem. Lett. 2008 doi: 10.1016/j.bmc.2007.12.040. doi:10.1016/j.bmc.2007.12.040. [DOI] [PubMed] [Google Scholar]
- 10.Huber VJ, Tsujita M, Kwee IL, Nakada T. Bioorg. Med. Chem. Lett. 2008 doi: 10.1016/j.bmc.2007.12.038. doi:10.1016/j.bmc.2007.12.038. [DOI] [PubMed] [Google Scholar]
- 11.Xiang Y, Ma B, Li T, Gao JW, Yu HM, Li XJ. Acta Pharmacol. Sin. 2004;25:812. [PubMed] [Google Scholar]
- 12.Ma B, Xiang Y, Mu SM, Li T, Yu HM, Li XJ. Acta Pharmacol. Sin. 2004;25:90. [PubMed] [Google Scholar]
- 13.Gao J, Wang X, Chang Y, Zhang J, Song Q, Yu H, Li X. Anal. Biochem. 2006;350:165. doi: 10.1016/j.ab.2006.01.003. [DOI] [PubMed] [Google Scholar]
- 14.Yang B, Kim JK, Verkman AS. FEBS Lett. 2006;580:6679. doi: 10.1016/j.febslet.2006.11.025. [DOI] [PMC free article] [PubMed] [Google Scholar]
- 15.Søgaard R, Zeuthen T. Pflugers. Arch. 2008;456:285. doi: 10.1007/s00424-007-0392-2. [DOI] [PubMed] [Google Scholar]
- 16.Zhang R, van Hoek AN, Biwersi J, Verkman AS. Biochemistry. 1993;32:2938. doi: 10.1021/bi00063a002. [DOI] [PubMed] [Google Scholar]
- 17.Preston GM, Jung JS, Guggino WB, Agre P. J. Biol. Chem. 1993;268:17. [PubMed] [Google Scholar]
- 18.Solenov E, Watanabe H, Manley GT, Verkman AS. Am. J. Physiol. 2004;286:C426. doi: 10.1152/ajpcell.00298.2003. [DOI] [PubMed] [Google Scholar]
- 19.Zhang RB, Logee KA, Verkman AS. J. Biol. Chem. 1990;265:15375. [PubMed] [Google Scholar]
- 20.Hiroaki Y, Tani K, Kamegawa A, Gyobu N, Nishikawa K, Suzuki H, Walz T, Sasaki S, Mitsuoka K, Kimura K, Mizoguchi A, Fujiyoshi Y. J. Mol. Biol. 2006;355:628. doi: 10.1016/j.jmb.2005.10.081. [DOI] [PubMed] [Google Scholar]
- 21.Cavasotto CN, Orry A. J. Curr. Top. Med. Chem. 2007;7:1006. doi: 10.2174/156802607780906753. [DOI] [PubMed] [Google Scholar]
- 22.Sousa SF, Fernandes PA, Ramos MJ. Proteins. 2006;65:15. doi: 10.1002/prot.21082. [DOI] [PubMed] [Google Scholar]
- 23.Yang B, Brown D, Verkman AS. J. Biol. Chem. 1996;271:4577. [PubMed] [Google Scholar]
- 24.Ma T, Frigeri A, Tsai ST, Verbavatz JM, Verkman AS. J. Biol. Chem. 1993;268:22756. [PubMed] [Google Scholar]
- 25.Levin MH, Sullivan S, Nielson D, Yang B, Finkbeiner WE, Verkman AS. J. Biol. Chem. 2006;281:25803. doi: 10.1074/jbc.M604332200. [DOI] [PubMed] [Google Scholar]
- 26.Saadoun S, Papadopoulos MC, Watanabe H, Yan D, Manley GT, Verkman AS. J. Cell Sci. 2005;118:5691. doi: 10.1242/jcs.02680. [DOI] [PubMed] [Google Scholar]
- 27.Ma T, Yang B, Gillespie A, Carlson EJ, Epstein CJ, Verkman AS. J. Clin. Invest. 1997;100:957. doi: 10.1172/JCI231. [DOI] [PMC free article] [PubMed] [Google Scholar]
- 28.Yang B, Ma T, Verkman AS. J. Biol. Chem. 2001;276:624. doi: 10.1074/jbc.M008664200. [DOI] [PubMed] [Google Scholar]


