

Summary
High-fidelity DNA polymerases copy DNA rapidly and accurately by adding correct deoxynucleotide triphosphates to a growing primer strand of DNA. Following nucleotide incorporation, a series of conformational changes translocate the DNA substrate by one base pair step, readying the polymerase for the next round of incorporation. Molecular dynamics simulations indicate that the translocation consists globally of a polymerase fingers-opening transition, followed by the DNA displacement and the insertion of the template base into the preinsertion site. They also show that the pyrophosphate release facilitates the opening transition and that the universally conserved Y714 plays a key role in coupling polymerase opening to DNA translocation. The transition involves several metastable intermediates in one of which the O-helix is bent in the vicinity of G711. Completion of the translocation appears to require a gating motion of the O1-helix, perhaps facilitated by the presence of G715. These roles are consistent with the high level of conservation of Y714 and the two glycine residues at these positions. It is likely that a corresponding mechanism is applicable to other polymerases.
Introduction
DNA polymerases are spectacular molecular machines that can accurately copy genetic material with error rates on the order of 1 in 105 bases incorporated, not including the contributions of proofreading exonucleases (Bloom et al., 1997). These enzymes can be clustered into seven families. Within a given family structure and mechanisms are often well conserved, but between families significant differences are observed (Delarue et al., 1990; Joyce and Steitz, 1994; Rothwell and Waksman, 2005; Steitz, 1999). In this work we focus on the DNA polymerase I (pol I) large fragment from a thermostable strain of Bacillus stearothermophilus (BF). The enzyme is a Family A polymerase that is homologous to other well-characterized high fidelity enzymes such as E. coli DNA Pol I, T7 DNA polymerase, and T. aquaticus DNA Pol I (Kiefer et al, 1997). High resolution structures of BF are available that are catalytically active in processive DNA synthesis (Johnson et al., 2003; Kiefer et al., 1998). The structure of BF, like other DNA polymerases, can be described in terms of a human right hand, with three subdomains referred to as the thumb, fingers, and palm (Figure 1A) (Kiefer et al., 1997; Ollis et al., 1985). Six base pairs of DNA make direct contacts with the palm subdomain of BF, binding to defined sites in helical “tracks” on the polymerase surface (Figure 1B).
Figure 1.
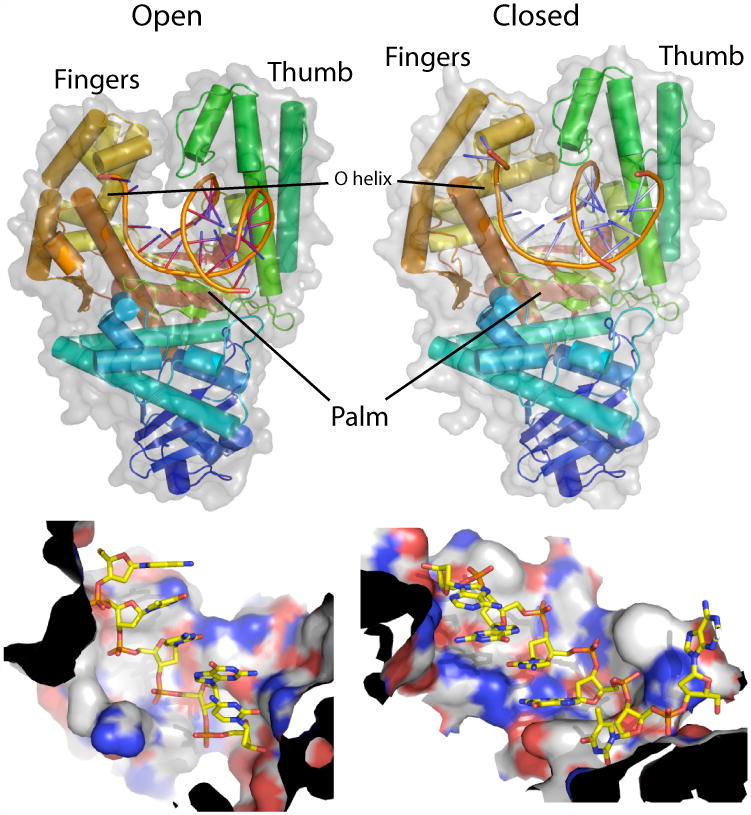
Top- Overview of the polymerase in the open (left) and closed (right) conformations. Protein is shown colored dark blue to red from N to C-terminus. DNA phosphate backbone is shown as orange tubes and bases are shown in blue. Van der Waal's outline is shown in semitransparent outline. Bottom- The primer (left) and template (right) strands bind in tracks on the protein surface (shown colored by atom type, i.e. N is in blue, O is in red, P is in orange, the rest are C atoms). Black ends indicate that this is a cut in the surface of pol I. All images of molecules in this paper were prepared using PYMOL (DeLano Scientific, pymol.sourceforge.net).
Kinetic studies reviewed in (Johnson, 1993; Joyce and Benkovic, 2004; Rothwell and Waksman, 2005) and structural data of Pol I family polymerases (Doublié et al., 1998; Johnson et al., 2003; Li et al., 1998) have revealed key steps in the process of DNA polymerization (Figure 2). After the polymerase binds DNA primer-template, there is a first noncovalent step, in which an incoming nucleotide triphosphate (NTP) is bound and the fingers close (Figure 2A). This is followed by the chemical step: the new phosphodiester bond is formed with concomitant pyrophosphate cleavage from the nucleotide. Relaxation of this intermediate produces the “pre-translocation” state (Figure 2B). There then occur a series of steps leading to formation of the “post-translocation” complex, during which the pyrophosphate is released, the fingers subdomain opens, the polymerase translocates to the next 3′-OH primer terminus, and a template base enters into the preinsertion site (Figure 2C). The system is now ready to repeat the nucleotide incorporation cycle. A key question we investigate is the order in which these events take place.
Figure 2.
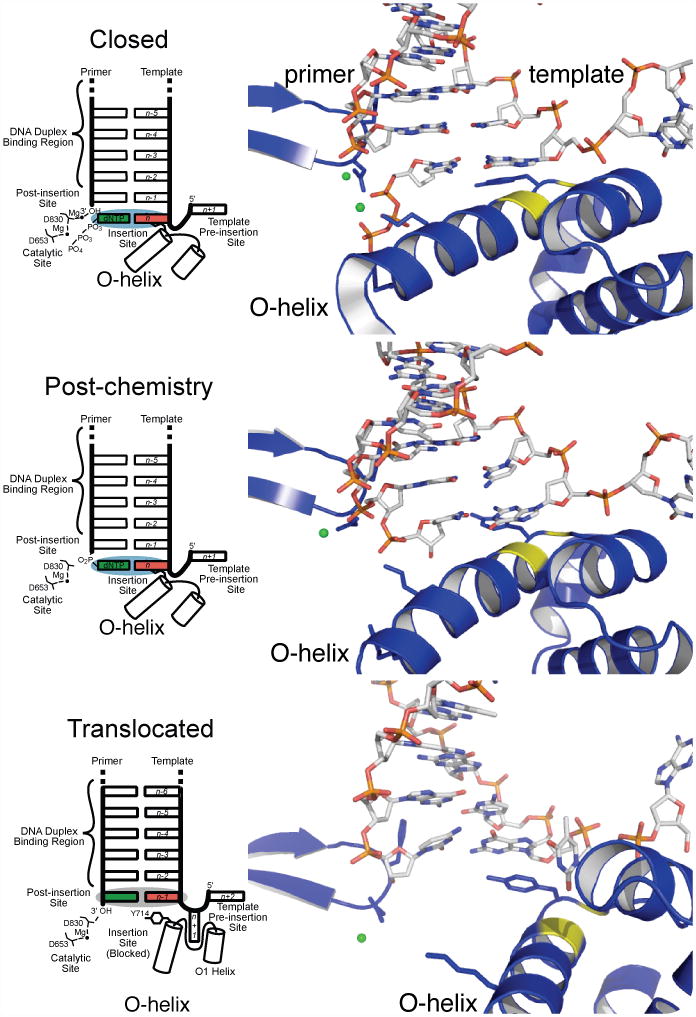
Schematics (left) and Close up views (right) of the active site of the polymerase in the closed pre-chemistry conformation (top), closed equilibrated post-chemistry pre-translocation configuration (center), and open translocated conformation (bottom). Top and bottom panels show one monomer from X-ray crystal structures. The center panel shows the equilibrated, post-chemistry pre-translocation starting structure used for these studies. Protons were omitted from the post-chemistry model to facilitate comparison with the open and closed crystal structures. Close up views focus mostly on conformational change of O-helix shown as blue helix with yellow G711. G715 is also shown in yellow. The rest of the protein is colored as blue ribbons. DNA is colored by atom. Mg2+ ions are shown as green spheres.
Translocation in polymerase I has been difficult to study experimentally by standard techniques, since it is not the rate-limiting step in the polymerization process (Patel et al., 1991), at least when the wild type polymerase incorporates the correct base. Single-molecule techniques have been used recently to study the translocation step of the E. coli RNA polymerase (RNAP) and a Brownian rachet model was proposed to codify the results (Abbondanzieri et al., 2005). However, since E. coli RNAP is very different from pol I, in particular there is no evidence for an opening transition, this analysis cannot be applied to pol I translocation; comparable single-molecule experiments for pol I are required. These apparently are difficult at present because the rate of incorporation by pol I is much faster (190 bp/s) (Kiefer et al., 1997; Warren et al., 2006) than that of the E. coli RNA polymerase (1 bp/s) (Abbondanzieri et al., 2005).
Given the experimental limitations on the study of translocation step of pol I, a computational analysis can aid in increasing our understanding. To date, the studies of DNA polymerases have focused on polymerase opening and closing transitions and the presumed connection between this motion and polymerase fidelity. Schlick and co-workers (Yang et al., 2002; Radhakrishnan and Schlick, 2004) have investigated the dynamics of the fingers-closing transition in the polymerization reaction of pol β. By using transition path sampling (Bolhuis et al., 2002), they were able to suggest that the fingers-closing motion process is made up of a series of steps involving certain residues (Radhakrishnan and Schlick, 2004). Andricioaei et al. (Andricioaei et al., 2004) simulated the effect of external forces on the fingers-closing conformational change to analyze the results of single-molecule experiments. Warshel et al. (Florian et al., 2003; Florian et al., 2002) have performed free energy calculations to determine the contribution of the chemical reaction step to the polymerase fidelity in T7 and pol β DNA polymerases.
The translocation step that follows incorporation of a new base into the primer strand has not previously been studied by computational technique. Key questions concern the mechanism by which translocation occurs and the relation between the opening transition and the DNA displacement. Restricting translocation so that it only occurs following base incorporation and so that the polymerase is only translocated by one base is critical for preventing frameshift errors during DNA replication. Further, extension is greatly slowed following misincorporation, and processes involved in translocation may help shift the balance towards the “editing” mode, in which mismatched bases are excised by exonucleases (Joyce and Benkovic, 2004; Johnson, 1993; Johnson and Beese, 2004). Here we use computational methods to determine the sequence of events and key structural rearrangements along the translocation pathways of the BF high fidelity polymerase, as a first step in a complete description of the translocation process and its role in function. Specifically, molecular dynamics results indicate that the translocation consists globally of a polymerase fingers-opening transition, followed by the DNA displacement and the insertion of the template base into the preinsertion site. They also show that pyrophosphate release precedes translocation and facilitates the opening transition. The translocation process apparently passes through a set of intermediates, with completion of the translocation requiring a gating motion of the O1-helix.
Results and Discussion
Modeling the Pre- and Post-translocation States
Suitable all-atom models for studying the dynamics of translocation in BF were generated by immersing high resolution crystal structures of the closed and open form in a box of explicitly modeled waters, adding protons and ions, and slightly modifying the starting structures to obtain the pre- and post-translocation states (see Experimental Procedures). For the post-translocation state, the open crystal structure could be used with only minor changes, such as adding unresolved DNA bases (see Experimental Procedures). More significant modifications were required to build the pre-translocation state from the closed structure. The pre-translocation structure corresponds to the configuration of the polymerase complex after the incorporation reaction has taken place, but prior to the translocation step; i.e., it is the structure with the pyrophosphate cleaved and a new phosphodiester bond between the primer and the nucleotide added. Such a configuration has not been captured in a crystal for DNA pol I. However, an X-ray structure of the corresponding pre-translocation state for the DNA-dependent RNA polymerase from phage T7 (T7 RNAP) is available (Yin and Steitz, 2004), in addition to the closed and open structures. Based on a comparison with the T7 RNAP crystal structures, there is very little change in the polymerase between the closed conformation and the pre-translocation state (see Figure 3 in (Yin and Steitz, 2004)). T7 RNAP is homologous in sequence and structure to pol I and the active sites of the two polymerases are very similar, in that both include two ASP residues that bind Mg2+ ions, as well as the O-helix that binds the incoming nucleotide, although there are important differences in the rest of the fingers domain (Figure S1). Consequently, the pre-translocation configuration for the pol I-DNA complex was constructed by analogy with T7 from the closed crystal structure by linking the NTP to the primer strand and cleaving off the pyrophosphate. For both the T7 RNAP structure and the DNA pol I model, the electrostatic interactions of the O-helix with the pyrophosphate stabilize the closed structure. Release of the pyrophosphate is expected to destabilize the closed state and facilitate the opening transition to the post-translocation state (see also below). This led Yin and Steitz (Yin and Steitz, 2004) to suggest that the release of the pyrophosphate triggers the translocation step. To investigate the importance of the pyrophosphate release and its effect on the opening transition, we built two models of the pre-translocation state. One is with pyrophosphate and the other one with pyrophosphate and nucleotide binding Mg2+ deleted; the catalytic Mg2+ was still present.
The stability of both the initial (pre-translocation) and final (post-translocation) systems was tested by molecular dynamics simulations of 9 ns at 300K (Experimental Procedures). The initial closed and open configurations were essentially preserved. The all-atom mass weighted root mean square deviation (RMSD) of the equilibrated final state was 2.3 Å from the crystal structure, while that for initial state was 2.5 Å from the pre-translocation model (2.3 Å with pyrophosphate present). In the equilibrated pre-translocation state without pyrophosphate, K706 and R702, which originally interacted with the pyrophosphate (Figure 2A), form hydrogen bonds with the newly added DNA base of the primer strand and the carboxyl group of D680, respectively. The O-helix rotates by approximately 10° towards the open conformation (Figure 2B)(the overall rotation of the O-helix from the closed to the open structure is 50°). During the equilibration run we observed substantial movements of the distal end of the O-helix (N700-G711), while the end of the O-helix proximal to the active site remained stable. The O1-helix and the loop connecting the O and O1 helices also show noticeable fluctuations. All of this suggests that the fingers-closed state of the O-helix in the pre-translocation structure is marginally stable once the pyrophosphate and its bound Mg2+ have been released. There were fewer systematic fluctuations in the post-translocation configuration; the O-helix rotates slightly but without significant deformation and the preinsertion site DNA base noticeably fluctuates.
The translocation pathway
Pol I translocation occurs on a millisecond time scale (Patel et al., 1991). Multiple molecular dynamics simulations on this time scale are still very difficult for a system of this size; e.g. each ns of simulation required ∼3 hours of CPU time with 256 processors on the Cray XT3 supercomputer. To overcome this problem we used the recently developed restricted perturbation targeted molecular dynamics (RP-TMD)(van der Vaart and Karplus, 2005) method (see Experimental Procedures and Supplemental Data). Briefly, target molecular dynamics (TMD) methods drive simulations along transition pathways between two states by adding an energy term that directs the system toward the desired final state and thereby introduces a force that speeds up the transition. The RP-TMD method avoids certain problems of the original TMD method (Schlitter et al., 1993) by restricting a maximum perturbation, which reduces the crossing of high barriers. As a basis for the analysis, we calculated a set of RP-TMD trajectories from the pre-translocation to the post-translocation state (forward); see supplemental movies M1 and M2. The perturbation parameter (the sum of all changes of atomic positions in a single dynamics step induced by the RP-TMD) varied from a high value of 0.015 Å to a low value of 0.0025 Å.
Translocation involves a complicated set of structural changes, including pyrophosphate release, the opening transition of the polymerase, and the translation/rotation of the DNA. This suggests, as is confirmed by the analysis, that to obtain a meaningful description of the transition several appropriately chosen order parameters are required. This contrasts with simpler cases (e.g., ion pair dissociation or a DNA base flip (Bolhuis et al., 2002; Hagan et al., 2003)) for which a single order parameter was found to be sufficient. We determined a possible set by the structural comparison of the initial and the final states and we confirmed the utility of this set from the consistent interpretation it provided of the RP-TMD trajectory results (see below). The three order parameters used to describe the major features of the transition are: θ, β, and δ, which measure the O-helix rotation angle, the proximity of a DNA base to the preinsertion site, and the progress of DNA translocation, respectively; the specific definition of the order parameters is given in Experimental Procedures, Figure 3, and Table S1. Figure S2 shows that the three order parameters have distinct and relatively stable values in the equilibrium simulations of the pre- and post-translocation states (for the case with pyrophosphate present see next section).
Figure 3.
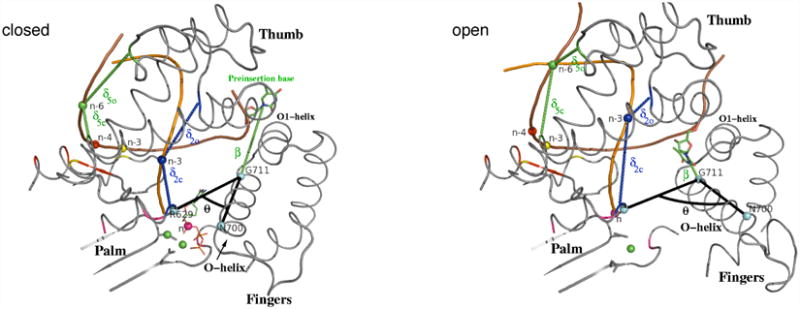
θ, δ, and β order parameters (see text and Supplemental Data for the definition), which describe the overall O-helix rotation, the DNA displacement, and the insertion of the preinsertion base into the preinsertion site, respectively, are shown in the closed and open conformations. The angle θ is defined as the angle (colored black) between Cα atoms of residues R629, G711, and N700 shown as cyan spheres. β (colored green) is the distance between Cα atom of G711 and the center of mass (C.O.M.) of the preinsertion base shown as green sticks. δic and δio measure the difference in the distance of a single phosphate atom from appropriate residues in the pol-I closed and open conformations, respectively. The residues contributing to δi of a given phosphate atom (n, n-3; n-3, n-4, n-6; shown as spheres) have the same color as that atom (see Table S1 for the list of residues). Brown and orange tubes represent template and primer strands, respectively. Preinsertion base and incoming nucleotide are shown as sticks and lines, respectively. Mg2+ ions and atoms defining the θ angle are shown as green and cyan spheres, respectively.
Role of pyrophosphate in the transition
To investigate the importance of the pyrophosphate release, we performed several simulations. Both equilibrium and RP-TMD simulations were performed in the presence of the pyrophosphate (PPi) to compare with these in its absence (see Experimental Procedures). It can be seen in Figure 4 that the equilibrium fluctuations leading to opening of the closed conformation are much larger without PPi than those with PPi. Furthermore, lower perturbations are needed to facilitate the opening transition in the absence of PPi (Figure 4). These results confirm the destabilization effect of pyrophosphate release and, together with the translocation pathway analysis (see next section), support the hypothesis (Yin and Steitz, 2004) that the release of pyrophosphate triggers the translocation by facilitating the opening transition: i.e., the release is the first step in the translocation process. Based on this result, further study focuses on the translocation transition in the pre-translocation state without pyrophosphate (referred to as pre-translocation state from now on).
Figure 4.
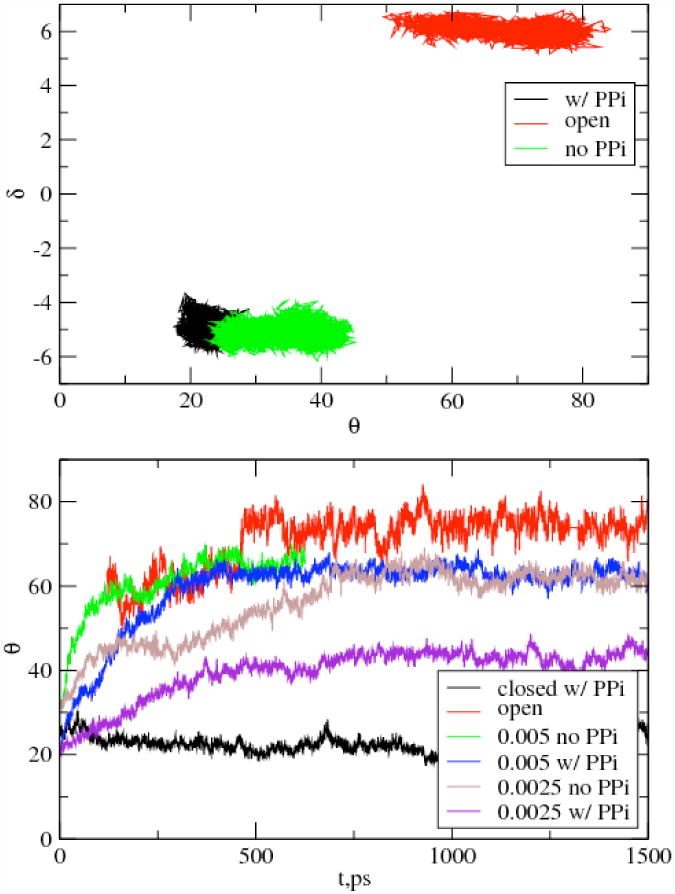
Effect of PPi. Top- Fluctuations obtained from equilibrium/equilibration trajectories for the closed conformation of pol-I-DNA complex with and without PPi in the parameter space of θ (degrees) vs. δ (Å). θ fluctuations are suppressed in the presence of the pyrophosphate indicating that the closed conformation is more stable in the presence of the pyrophosphate. Fluctuations for the open conformation are also given for comparison. Bottom- The time evolution of the order parameter θ during RP-TMD simulations of pol-I-DNA complex with and without PPi using the same perturbation. Fluctuations obtained from equilibration trajectories for the closed and open conformations are shown for reference (with time scaled to fit the range of the plot).
The structural changes along the translocation pathway
To determine the order of events during the translocation process after pyrophosphate release, a series of simulations with different perturbation values were performed and analyzed in terms of the θ, δ, and β order parameters. Figure 5 shows the resulting pathways. With the highest perturbation (0.015 Å), the movement of DNA begins once the O-helix has rotated about 45°; i.e. d changes from −5 Å to −1.7 Å, while θ goes from 45° to 60°. For all lower perturbations, significant DNA motion occurs only after the fingers-opening is essentially complete, and for the lowest perturbation values (0.005 and 0.0025 Å) no appreciable DNA motion occurs. This indicates that there is a barrier for the DNA displacement that is substantially larger than that for the fingers-opening motion in the absence of pyrophosphate. Intriguingly, the initial rotation of the O-helix involves only the distal end of the helix (N700-G711); the remainder of the O-helix moves in concert with DNA translocation (see next subsection). This deformation of the O-helix is similar to that seen during the 9 ns simulation of the pre-translocation state (above). To overcome the barrier present along the 0.0025 Å pathway, we extended this RP-TMD trajectory by applying higher perturbations equal to 0.015 and 0.01 Å. The two resulting trajectories are similar (Figure 5). The movies of RP-TMD trajectories will be available in Supplemental Data. Soon after the higher perturbation is applied, the O-helix straightens as residues 711-714 move towards the n-base of the template strand and DNA displacement begins. In the extended trajectory (0.015 Å perturbation) both the fingers-opening and DNA translocation are essentially complete at the end of the simulation; however, the insertion of the preinsertion base (Figure 5) has only proceeded part way even after 670 ps. This contrasts with the result of the RP-TMD trajectory in which the entire trajectory was performed with the 0.015 Å perturbation; it resulted in essentially complete insertion after 250 ps (see also Table S2). This indicates that the two pathways differ in detail (i.e., additional order parameters are required to capture this small difference), though they are very similar in their global characteristics. In both trajectories, the insertion of the base into the preinsertion site is the final step in translocation.
Figure 5.
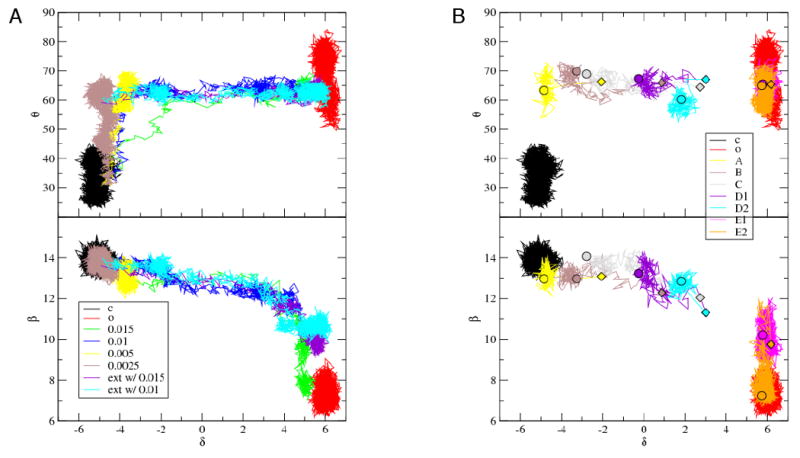
A- Comparison of RP-TMD pathways with varying strength of perturbation parameter. Shows θ vs. β is shown above and θ vs. δ is shown below. The equilibration/equilibrium trajectories in closed (c) and open (o) configurations are also shown. The pathway with perturbation strength of 0.0025 Å has been extended (ext w/) by increasing the perturbation to 0.01 Å and 0.015 Å. θ is in degrees, while β and δ are in Å.
B- Relaxation trajectories revealing several intermediates along the reaction pathways (A, B, C, D1, D2, E1, E2). Diamonds and circles indicate the start and the end of a given trajectory. The clusters from individual trajectories at the end indicate the presence of intermediates. Circles represent such intermediates. Only one trajectory is shown per intermediate. D1 and D2, E1 and E2 had the same starting coordinates, but different momenta. Initial momenta for all relaxation trajectories have been drawn from Maxwell distribution at 300K. θ is in degrees, while β and δ are in Å.
Metastable states involved in the translocation
The RP-TMD simulations with small perturbation values end at several intermediate points with different θ, β, and δ values (Figure 5), suggesting there are metastable states along the pathway. To characterize these metastable states we started 10 unperturbed equilibrium trajectories at each of 5 different points along the translocation pathway (see Experimental Procedures and Supplemental Data). Since the smallest RP-TMD perturbation (0.0025 Å) showed that there is only a very low energetic barrier to the opening of the distal end of the fingers in the absence of pyrophosphate (see below for the effect of pyrophosphate), we initiated these additional trajectories with the fingers subdomain in the open conformation (θ = 60°). The five starting structures were mostly approximately equally spaced along the reaction pathway (see Table S3). The first three starting points produced final structures with similar attributes, which we term A, B, and C, respectively. By contrast, each of the two trajectory sets initiated later along the translocation process in the reaction produced two distinct classes of structures, which we term D1 and D2, and E1 and E2, respectively.
All the trajectories except E2 reach neither the pre- nor the post-translocation configurations (Figure 5). They cluster at intermediate points, suggesting that they correspond to metastable states; the final values of the order parameters are listed in Table S3. The exception is trajectory E2, which reaches a structure very close to the post-translocation configuration. Since the existence of the metastable states indicates the free energy surface is rugged with barriers along the translocation pathway, it is of interest to examine the structures involved. These can provide information about the important interactions that change as the trajectory progresses.
Representative structures of the metastable states, each one taken from one of the clusters at the end of the five sets of trajectories, are shown in Figure 6. In the A state, the O-helix is still slightly bent at G711, but the C-terminal end of the helix has straightened somewhat, with a concomitant movement of Y714 towards the template base in the active site. This base has moved approximately halfway towards its post-translocation configuration, the n-1 template base has moved part of the way as well, while the displacement of the rest of the DNA is negligible. In the B state, the O-helix has straightened and the n-1-base of the template is shifted further toward its final configuration. The ribose and phosphate backbone of the n-base of the template is further displaced. Also the bases in the duplex binding region have begun to move. Progressing through the C and D states, the DNA duplex continues to move. Completion of the displacement of the duplex region into the post-translocation state appears to be hindered while the preinsertion base remains outside the preinsertion site. In the D2 state we observe particularly large distortions of the single strand part of the DNA template, and its further displacement is apparently obstructed by O1-helix.
Figure 6.
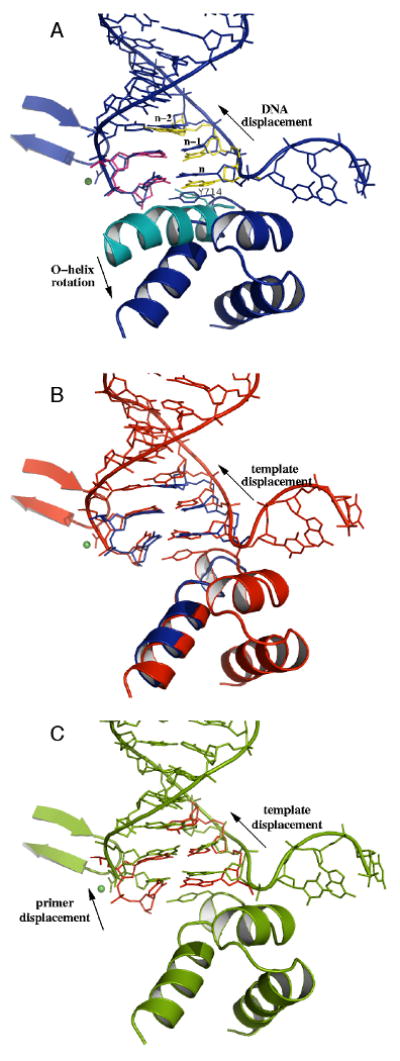
Comparison of metastable states A, B, C (corresponding to labeled circles in Figure 5); each panel compares two structures. A: Metastable state A (dark blue) compared with starting configuration (protein in teal blue, primer bases in yellow, template bases in purple) rotation of the O-helix and the displacement of n-template and n-1 template bases. B: Metastable states B (red) vs. A (dark blue), displacement of n-1 template and further downstream bases. C: C (green) vs. B (red), displacement of the n-primer base. (θ, δ, β)A = (63, −4.6, 13); (θ, δ, β)B = (70, −3.3, 13); (θ, δ, β)C = (68, −1.9, 14). Notice the distortion of the DNA template strand between the n-template and the preinsertion bases. Phosphate backbone is represented by tubes. Protein is shown as ribbons. Mg2+ ion is shown as green sphere. The DNA positions of the open configuration can be inferred from the closed configuration and are not shown here.
In the E1 state the barrier just described is apparently relieved by a gating motion of the O1-helix. It moves away from the template strand so as to allow the preinsertion base to pass by and approach the preinsertion site (Figure 7). It is likely that G711 and G715, which are located at the base of the O-helix and in the loop connecting O and O1 helices, respectively, play a role in this motion. Interestingly, the O1-helix position essentially coincides in the closed and open crystal structures, so the motion observed in these simulations could not be inferred from the structures, per se. In the E1 state, essentially all the DNA duplex bases, except for the n-base of the template strand, have moved into their post-translocation positions. In the E2 state, translocation reaches completion: the O1-helix has moved back, the preinsertion base is located in the preinsertion site, and the n-template base is in its final position.
Figure 7.
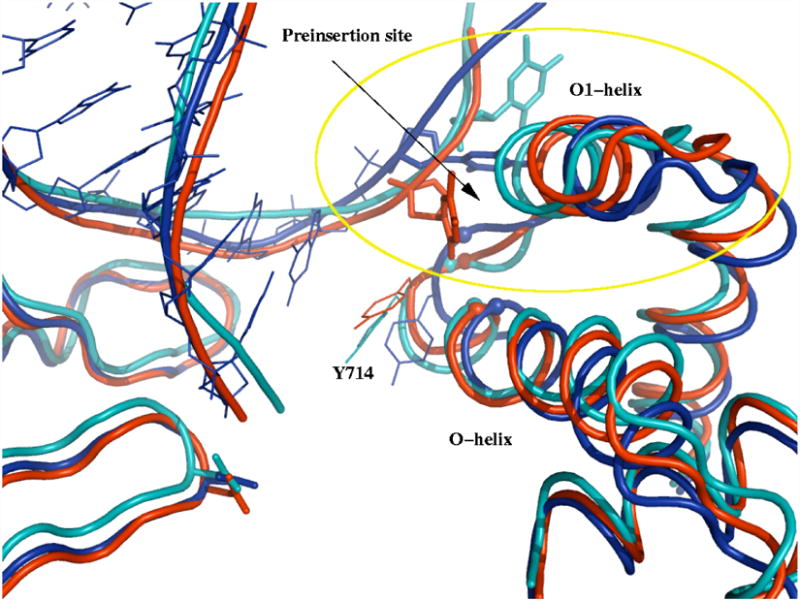
D2(teal blue), E1 (dark blue), and E2(red) metastable states showing the gating of O1-helix and preinsertion base insertion into the preinsertion site (circled area). The additional part of pol-I-DNA complex is shown to demonstrate a fair alignment of the rest of the protein. Notice the fluctuation of the loop connecting O-helix with O1-helix. The positions of Cα atoms of G715 (in the loop area) and G711 (at the base of the O-helix) are also shown as spheres. (θ, δ, β)D2 = (61, 1.9, 13); (θ, δ, β)E1 = (65, 5.9, 10); (θ, δ, β)E2 = (65, 5.6, 7.1). Preinsertion base is shown as sticks; the rest of DNA is shown as lines for E1, as well as tubes for D2, E1, and E2. Y714 is shown as lines.
Role of certain residues in the transition
To investigate the role of certain residues (i.e. Y714, G711, and G715), we performed additional simulations. Our analysis of the translocation pathway and its intermediates suggest that Y714, which is located at the end of O-helix proximal to the active site, couples the rotation of the O-helix to the displacement of the DNA. Analysis of the trajectories (see movies in Supplemental Data) shows that the displacement of the Y714 is coupled with the displacement of the n-template base. There is experimental evidence that Y714A mutation hinders the extension of the DNA (Minnick et al., 1999). To investigate the effect of this mutation, we initiated twenty 1 ns trajectories from state A for both wild type and Y714A mutant. The trajectories are given in Figure S3 in terms of coordinates π and ν (see Experimental Procedures for their definition), describing displacements of the proximal end of the O-helix (Y714 Cα) and the n-template base of the DNA, respectively. As can be seen, the correlation between π and ν in the wild type is compromised in Y714A.
Gly residues due to their enhanced ability to explore Ramachandran space are often involved in conformational changes. The presence of conserved G711 and G715 residues surrounding Y714 suggests that these residues could be involved in the O1-helix gating and fingers-opening transitions. To investigate this, we compared Ramachandran scatter plots along trajectories of these transitions with those of equilibrium fluctuations in the pre- and post-translocation states (Figures S4 and S5). As can be seen, the fraction of G711 outside of α-helical region is larger compared to either closed or open conformations during O1-helix gating motion (state E1). Ramachandran scatter plots for G715 also show that it explores “prohibited” region much more than in the closed/open conformations. Similar patterns are observed for the fingers-opening transition (Figure S5). These results support the hypothesis that G711 and G715 play a role in the translocation process.
Concluding Discussion
A molecular dynamics simulation analysis has been presented for the translocation step in the DNA replication cycle of DNA polymerase I from a thermostable strain of Bacillus stearothermophilus. The calculations are based on the crystal structures for closed and open conformations; a working model for the pre-translocation state was built by analogy to that of T7 RNA polymerase for which a crystal structure is available. Restricted perturbation targeted molecular dynamics (RP-TMD) simulations supplemented by transition progress biased molecular dynamics (TP-BMD) (see Experimental Procedures) and equilibrium molecular dynamics simulations have been used to determine the global features of the translocation process: pyrophosphate release precedes translocation and facilitates the opening transition; the opening transition is followed by the DNA displacement and the insertion of the template base into the preinsertion site. The translocation process passes through a set of intermediates and completion of the translocation appears to require a gating motion of the O1-helix. Y714, G711 and G715 are shown to play a role in the translocation process. In particular, the simulations have shown that Y714 couples the rotation of the O-helix to the DNA extension, pushing against the template base in the postinsertion site, while the G711 and G715 appear to be involved in the fingers-opening and O1-helix gating motion. The importance of these residues is in accord with their conservation. Y714 is universally conserved (see PSI-BLAST spreadsheet in Supplemental Data) and the importance of this residue is indicated by previous mutagenesis studies (Minnick et al., 1999; Carroll et al., 1991), which showed that mutation of the equivalent tyrosine (Y766) in E. coli Pol I to serine or alanine yielded a strong mutator phenotype. In vitro studies of the Ser mutant also showed that this mutator polymerase was less efficient at extending past mispairs once they had been incorporated. Our work suggests an explanation for these observations: not only is Y714 be important for fidelity, but it also plays a key role in translocation, and thus in extension past mispairs. Glycines at 711 and 715 are ∼91% and 95% conserved in Pol I family members (see PSI-BLAST spreadsheet in Supplemental Data), and all Pol I polymerases have at least one glycine within 2 amino acids of their conserved Y714. Other polymerase families may also share flexible alpha helices that span the growing ends of their substrates. The C terminus of the P-helix from family B polymerase from RB69, homologous to the primary replicative polymerases in eukaryotes occupies a similar position to the BF O-helix in DNA-dNTP protein ternary complexes, just below the double-stranded/single-stranded junction DNA substrate (Wang et al., 1997; Franklin et al., 2001). This helix contains conserved glycines at its C-terminal end, positions 568 and 571. The “bridge helix” from yeast RNA polymerase II contains several glycine residues (pdb entry 1l6h) (Gnatt et al., 2001). A bend in this helix has been inferred to occur from comparison with T. aquaticus RNA polymerase (Zhang et al., 1999) and has been hypothesized to play a role in translocation (Gnatt et al., 2001). The O-helix, although not structurally homologous to the “bridge helix”, may have a functionally analogous role in facilitating translocation.
The O1-helix gating could be involved in preventing frameshift mutations, thereby reinforcing the role of the preinsertion site in this process (Johnson et al., 2003). Analysis of the fingers-opening transition shows that the O1-helix is the only obstacle for the preinsertion base to enter the preinsertion site. We suggest that once the O1-helix “gate” “unlocks”, the preinsertion base can enter the preinsertion site. Once this has happened, the O1-helix returns to its “locked” position. That position is stabilized by interactions with the preinsertion base and prevents another base from entering the preinsertion site.
The details of the translocation step proposed here for BF pol-I need to be verified by additional experiments. With the recent advances in single molecule spectroscopy (Rigler, 1995), it is to be hoped that methods used for the slower E. coli RNA polymerase will be extended to BF pol-I.
Experimental Procedures
Crystal Structures
Initial and final structures for simulations were derived from high-resolution crystal structures of BF•DNA complexes. The pre-translocation structure was built from one monomer (chain A) of a previously described closed structure (Warren et al., 2006) (pdb code 2HVI). The structure of an open complex with the same bound DNA sequence (primer- 5′-CCTGACTCGC-3′, template 5′-CATGCGAGTCAGGA-3′) was solved for this study (pdb code 3EYZ, see Table S4). This sequence differs only in the inclusion of a 3′ overhang A on the template strand, to prevent backwards binding of the DNA in complex structures. BF protein crystallized in the closed complex had two point mutations, D598A and F710Y, which eliminate a crystal contact stabilizing the open form and reduce discrimination against dideoxy nucleotide substrates, respectively, as previously described (Hsu et al., 2004). To facilitate direct comparison, the open conformation structure was solved using BF with the F710Y point mutant as well.
Building Pre- and Post-Insertion States
Two unresolved and/or absent single-stranded DNA bases outside of the polymerase in the closed and open conformations, respectively, were built with the CHARMM program (Brooks et al., 1983), using as a template the crystal structure of the open conformation in which these bases are visible (pdb code: 1L3S; see also caption to Table S5). Point mutations at 329 and 710 were restored to wildtype amino acids. Additional modifications for building the post-chemistry pre-translocation state from our pre-chemistry closed structure has already been described early in the paper. Hydrogen atoms missing in the pre- and post-insertion structures were added with HBUILD module of CHARMM (Brooks et al., 1983). Protonation states at pH 7 for histidines were determined with pKa calculations by continuum electrostatics evaluations with the PBEQ module of CHARMM. They are given in Table S6 along with the protonation states for other titratable residues. In addition, waters 3133 and 3262 in the closed conformation structure were changed to Mg2+ ions as was water 1001 from the open complex. The assignment of metal binding sites in the closed conformation was confirmed by detecting Zn anomalous signal in the W3133/W3262 positions after soaking crystals in 10 mM ZnSO4 solution overnight (Figure S6). The assignment of a single Mg2+ ion in the open conformation was based on the 1L3S structure (Johnson et al., 2003); see comments in the 1L3S pdb file. After all necessary modifications the total charge of the resulting DNA-polymerase complex is −29: −7 for the protein, −24 for the DNA, +2 for the Mg2+ ion (if pyrophosphate is present, there is additional −1 charge: −3 for pyrophosphate and +2 the additional Mg2+ ion).
RP-TMD Simulations
We performed fully atomistic simulations of the DNA polymerase I-DNA complex in explicit water with counterions in a system with periodic boundary conditions. The system was prepared by immersing the polymerase-DNA complex with its crystal waters (270 and 300 in the closed and open conformations, respectively) and the Mg2+ ion(s) in a preequilibrated (for 1 ns) 130 Å × 108 Å × 108 Å water box; the long axis corresponds to the axis with the lowest moment of inertia of the pol I DNA-protein complex. A water box of this size has at least a 15 Å water layer (three hydration shells around the polymerase complex). Water molecules that were within 2.8 Å of any protein or solvent atoms in the crystal structures were removed. The waters with the lowest (or highest) electrostatic potentials were replaced by 152 Na+ (or 123 Cl− ions (122, if pyrophosphate is present)) to achieve electroneutrality and an ionic strength of 0.15 M. Ions were placed at least 8 Å apart from each other and from any protein atom to avoid “pseudo-crystallization” of the salt (data not shown). The solvated polymerase complexes consist of approximately 138,000 atoms. There are 9371 protein atoms and 765 DNA atoms; the rest are water molecules and ions.
The well-parallelized molecular dynamics program, NAMD (version 2.6b1 (Kale et al., 1999)), was utilized for molecular dynamics propagation during equilibration and relaxation stages. Trajectories obtained with the NAMD program were analyzed with the CHARMM (Brooks et al., 1983) program. CHARMM22 (MacKerrel et al., 1998) (protein atoms), CHARMM27 (MacKerrel and Banavali, 2000; Foloppe and MacKerrel, 2000; Pavelites et al., 1997) (DNA), and TIP3P (MacKerrel et al., 1998) (protein atoms), CHARMM27 (MacKerrel and Banavali, 2000; Foloppe and MacKerrel, 2000; Pavelites et al., 1997) (DNA), and TIP3P (Jorgensen, 1983) (water) force fields were used. Nonbonded interactions were calculated with a 13.5 Å list, which was updated every 10 steps of dynamics. Van der Waals interactions were truncated at 12 Å with a smooth switching function applied starting from 10 Å. All electrostatic interactions beyond 12 Å were computed with the particle-mesh Ewald summation (PME) (Essmann et al., 1995). Covalent bonds to hydrogens were constrained using SHAKE (Ryckaert et al., 1977), which allowed a 2 fs step for propagation. Calculations were performed at Oak Ridge National Laboratory Supercomputer Center; 1 ns required 3.3 hours on 256 cpus of the CRAY-XT3.
Equilibration runs for the system began after a 300 step conjugate gradient energy minimization. During equilibration, constant pressure was maintained using a Langevin piston Nosé-Hoover method for pressure control (Feller et al., 1995) with 1 atm target pressure, a 100 femtosecond (fs) barostat oscillation time period and a 50 fs decay time scale. The temperature was maintained at 300 K by coupling all non-hydrogen atoms to a Langevin bath with 5 picosecond−1 friction. During the first 1.5 ns, the solute and its crystal structure water molecules were held fixed to avoid distortions in the structure because of partial solvation and/or sudden pressure changes (due to filling voids resulting from deletion of waters during the immersion of the protein in the water box), as well as to permit the sodium and chloride ions to equilibrate around pol I. This was followed by 90 ps of slow release of harmonic restraints applied to the backbone and the rest of the heavy atoms of the DNA-polymerase complex, the initial restraints had force constants equal to 30 and 15 kcal mol−1 Å−2, respectively (further details are given in Table S7). This allowed further equilibration of ions and water molecules without substantial distortion of the structure of the complex. After this, the entire system was equilibrated for 2-3 ns without restraints and reached a box size with dimensions of 125 Å × 104 Å × 104 Å, slightly smaller than the original box. Pathway calculations were initiated from configurations at the end of the equilibration runs. These systems remained stable, even when equilibration was extended to 9 ns.
RP-TMD (van der Vaart and Karplus, 2005) trajectories were obtained using the CHARMM program (Brooks et al., 1983). In the RP-TMD method, Newtonian dynamics is performed subject to the standard molecular mechanics potential and a time-dependent constraint of the form:
where RMSD(t) is the desired mass-weighted root-mean-square deviation to the target state at time t; Xi and Xi,target are mass-weighted coordinates of atom i of the current and target states superimposed to yield the minimal RMSD between these structures. The desired RMSD to the final structure is slowly and smoothly decreased over the course of the simulation. The coordinate displacement at any time step can be split into Δxi(t), the displacement due to the unperturbed dynamics, and Δpi(t), the “perturbation”, i.e. change in the coordinates due to the constraint force (van der Vaart and Karplus, 2005)
If the magnitude of the perturbation is large, physically implausible moves can result (i.e. the system visits high free energy regions) from use of the standard TMD method. Also, by forcing the RMSD to decrease smoothly, this method can cause the simulation to linger in energetically unfavorable regions or even to move away from the final structure. The RP-TMD method alleviates this problem by restricting the value of the perturbation allowed at each time step, and explicitly solving for an RMSD value consistent with that maximum perturbation. This has several desirable results. First, simulation trajectories do not cross unreasonable barriers. Second, metastable states can be identified when trajectories linger in a given configuration. Another important difference from the regular TMD method is that in the limit of zero perturbation, the RP-TMD method restores unperturbed dynamics (van der Vaart and Karplus, 2005). Thus, by gradually decreasing the perturbation value used in the RP-TMD trajectories, the unperturbed behavior can be extracted.
A complementary analysis with a method termed Transition Progress Biased Molecular Dynamics (TP-BMD) was also performed in this study. In TP-BMD multiple equilibrium simulations are launched from the same starting structure using the NAMD program. After a given time period (the relaxation time) the trajectory that has moved farthest towards the target final structure is selected, and a new set of starting trajectories are initiated from this starting structure, and this cycle is repeated for the desired time of the simulation. TP-BMD therefore provides an efficient means of promoting trajectories that lead towards the final structure, without altering the energy landscape of the MD simulation. The results of these simulations confirm our RP-TMD results (see Supplemental Data for movies of TP-BMD trajectories and Figure S7) and so are not described in detail.
In TMD-based methods, the constraint forces lead to generation of a torque and, if the constraint is applied to only some of the atoms, translation of the molecule as the whole can result; if the force is applied to all atoms, the center of mass does not move. To alleviate this problem, translation and rotation of the system as a whole were removed every 10 steps by superimposing the current structure with the initial configuration. The RMSD constraint was applied to all heavy atoms of the polymerase-DNA complex and Mg2+ ion, except for F710 and the DNA base of the duplex most distant from the catalytic site and the two first bases of DNA template strand lying outside of the enzyme, all of which were not present in the crystal structures (see Sec II A).
Relaxation simulations
The duration of each trajectory was 200 ps, with the exception of the E trajectories, which were 1.2 ns in length; the extra time was needed for them to reach the nearest metastable state.
Definition of Order Parameters
The chosen order parameters, which describe the major features of the transition (Figure 3), are θ, β, and δ, for the overall O-helix rotation, the insertion of the preinsertion base into the preinsertion site, and the DNA spiral sliding motion, respectively. The angle θ is defined as the angle between Cα atoms of residues R629, G711, and N700. The first residue is in the palm subdomain and the latter two are in the O-helix: the R629 and N700 are in contact in the closed conformation and far apart from each other in the open configuration, while G711 is close to pivot point of O-helix rotation between the closed and the open structures (RMSD 0.8 Å); the Cα of R629 also moves very little during the translocation step (RMSD 0.8 Å) so that it is a good “fixed” point to measure the O-helix rotation. The quantity, β, is the distance between Cα atom of G711 and the center of mass (C.O.M.) of the preinsertion base. G711 was chosen because it is close to the pivot point of O-helix rotation (see above), so that the value of β is nearly independent of θ. The quantity, δ, is a more complex coordinate that was introduced to represent the DNA motion. It is the average over several distances, δi, to take into account the fact (see Sec. III E) that the DNA does not move as a rigid body in the simulation. We use five δi (i=1,2,…,5), where each one measures the difference in the distance of a single phosphate atom from appropriate residues in the polymerase. To separate the fingers-opening motion from the DNA displacement, we excluded distances involving the fingers subdomain in the δi definitions. Specifically, δ1 is concerned with the portion of the “n-base” of the primer strand, i.e. the newly incorporated base (Figure 3), which is in contact with the palm/thumb residues I657 and I628+R367 in the closed (pre-translocated) and open (post-translocated) conformations, respectively. Its value is defined as δ1 = δ1c − δ1o, where “c”/“o” stand for closed/open, δ1c and δ1o are the distances between the phosphate atom of the n-base of the primer strand and the center of mass of residue I657 (contact in the closed conformation) and I628+R367 (contact in the open conformation), respectively. For the definition of δ2 through δ5, see the caption of Figure 3 and Table S1. The resulting coordinates for phosphate atoms distributed along the DNA duplex describe the movement of the beginning (δ1), middle (δ2, δ3, δ4), and the end of the DNA duplex (δ5), as measured from 3′ to the 5′-end of the template. Thus, δ, the average of these parameters, describes the overall displacement of the DNA with respect to the palm and thumb subdomains.
Order parameters π and ν describe displacements of the proximal end of the O-helix and the n-template base of the DNA, respectively. They are determined as following. First, pre-translocation and post-translocation and given conformation are aligned with respect to backbone heavy atoms of residues 613, 615, and 771 of palm region, which are in contact with n-template base. Then, ν(or π) is defined as difference of mass weighted RMSD between n-template base without ribose and phosphate backbone (or Y714 Cα) atoms in the current and the closed vs. open configurations.
Supplementary Material
Acknowledgments
We thank Arjan van der Vaart for providing RP-TMD computer code through the CHARMM developmental project, Jingzi Pu for porting CHARMM to Cray-XT3, and James Phillips for assistance adapting NAMD for Cray-XT3. We also thank Arjan van der Vaart, Wei Yang, Paul Maragakis, Martin Spichty, Jingzi Pu, and Ivana Adamovic for stimulating discussions. We would like to thank Victor Ovchinnikov, Eugene Wu and Weina Wang for critical reading of the manuscript and Eugene Wu for preparation of the Figure S6 and Table S4. This research was supported by an INCITE award of resources at the National Center for Computational Sciences at Oak Ridge National Laboratory, which is supported by the Office of Science of the Department of Energy (DOE) under Contract DE-AC05-00OR22725. Additional computations were performed on the Crimson grid, Bauer Computer Center, and NERSC. This work was supported in part by an National Institutes of Health (NIH) grant (5 R01 GM 030804) to MK, grant 2PO1-CA092584-06 to LSB, and a NIH National Research Service Award fellowship F32 GM073324 to AAG, and by an Agouron Institute Fellowship from the Jane Coffin-Childs Memorial Fund for Cancer Research to JJW. Data were collected at the SER-CAT 22-BM beamline at the Advanced Photon Source (APS), Argonne National Laboratory. Supporting institutions may be found at www.ser-cat.org/members.html. Use of the APS was supported by the Department of Energy, Office of Science, Office of Basic Energy Sciences, under Contract No. W-31-109-Eng-38.
Abbreviations
- BF
Bacillus stearothermophilus DNA polymerase I large fragment
- RP-TMD
restricted perturbation targeted molecular dynamics
- TP-BMD
transition progress biased molecular dynamics
- TMD
targeted molecular dynamics
Footnotes
Publisher's Disclaimer: This is a PDF file of an unedited manuscript that has been accepted for publication. As a service to our customers we are providing this early version of the manuscript. The manuscript will undergo copyediting, typesetting, and review of the resulting proof before it is published in its final citable form. Please note that during the production process errors may be discovered which could affect the content, and all legal disclaimers that apply to the journal pertain.
References
- Abbondanzieri EA, Greenleaf WJ, Shaevitz JW, Block R, Landick A, Block SM. Direct observation of base-pair stepping by RNA polymerase. Nature. 2005;438:460–465. doi: 10.1038/nature04268. [DOI] [PMC free article] [PubMed] [Google Scholar]
- Andricioaei I, Goel A, Herschbach D, Karplus M. Dependence of DNA polymerase replication rate on external forces: a model based on molecular dynamics simulations. Biophys J. 2004;87:1478–1497. doi: 10.1529/biophysj.103.039313. [DOI] [PMC free article] [PubMed] [Google Scholar]
- Bloom LB, Chen X, Fygenson DK, Turner J, O'Donnell M, Goodman MF. Fidelity of Escherichia coli DNA Polymerase III Holoenzyme. The effects of beta, gamma complex processivity proteins and epsilon proofreading exonuclease on nucleotide misincorporation efficiencies. J Biol Chem. 1997;272:27919–27930. doi: 10.1074/jbc.272.44.27919. [DOI] [PubMed] [Google Scholar]
- Bolhuis PG, Chandler D, Dellago C, Geissler PL. Transition path sampling: Throwing ropes over rough mountain passes, in the dark. Annu Rev Phys Chem. 2002;53:291–318. doi: 10.1146/annurev.physchem.53.082301.113146. [DOI] [PubMed] [Google Scholar]
- Brooks BR, Bruccoleri RE, Olafson BD, States DJ, Swaminathan S, Karplus M. CHARMM - A program for macromolecular energy, minimization, and dynamics calculations. J Comp Chem. 1983;4:187–217. [Google Scholar]
- Carroll SS, Cowart M, Benkovic SJ. A mutant of DNA polymerase I (Klenow fragment) with reduced fidelity. Biochemistry. 1991;30:804–813. doi: 10.1021/bi00217a034. [DOI] [PubMed] [Google Scholar]
- Delarue M, Poch O, Tordo N, Moras D, Argos P. An attempt to unify the structure of polymerases. Protein Eng. 1990;3:461–467. doi: 10.1093/protein/3.6.461. [DOI] [PubMed] [Google Scholar]
- Doublié S, Tabor S, Long AM, Richardson CC, Ellenberger T. Crystal structure of a bacteriophage T7 DNA replication complex at 2.2 Å resolution. Nature. 1998;391:251– 258. doi: 10.1038/34593. [DOI] [PubMed] [Google Scholar]
- Essmann U, Perera L, Berkowitz ML, Darden T, Lee H, Pedersen LG. A smooth particle mesh Ewald method. J Chem Phys. 1995;103:8577–8593. [Google Scholar]
- Feller SE, Zhang YH, Pastor RW, Brooks BR. Constant pressure molecular dynamics simulation: The Langevin piston method. J Chem Phys. 1995;103:4613–4621. [Google Scholar]
- Florian J, Goodman MF, Warshel A. Theoretical investigation of the binding free energies and key substrate-recognition components of the replication fidelity of human DNA polymerase beta. J Phys Chem B. 2002;106:5739–5753. [Google Scholar]
- Florian J, Goodman MF, Warshel A. Computer simulation studies of the fidelity of DNA polymerases. Biopolymers. 2003;68:286–299. doi: 10.1002/bip.10244. [DOI] [PubMed] [Google Scholar]
- Foloppe N, MacKerell AD. All-atom empirical force field for nucleic acids: I. Parameter optimization based on small molecule and condensed phase macromolecular target data. J Comp Chem. 2000;21:86–104. [Google Scholar]
- Franklin MC, Wang J, Steitz TA. Structure of the replicating complex of a pol alpha family DNA polymerase. Cell. 2001;105:657–667. doi: 10.1016/s0092-8674(01)00367-1. [DOI] [PubMed] [Google Scholar]
- Gnatt AL, Cramer P, Fu J, Bushnell DA, Kornberg RD. Structural basis of transcription: an RNA polymerase II elongation complex at 3.3 Å resolution. Science. 2001;292:1876–1882. doi: 10.1126/science.1059495. [DOI] [PubMed] [Google Scholar]
- Hagan MF, Dinner AR, Chandler D, Chakraborty AK. Atomistic understanding of kinetic pathways for single base-pair binding and unbinding in DNA. Proc Natl Acad Sci USA. 2003;100:13922–13927. doi: 10.1073/pnas.2036378100. [DOI] [PMC free article] [PubMed] [Google Scholar]
- Hsu GW, Ober M, Carell T, Beese LS. Error-prone replication of oxidatively damaged DNA by a high-fidelity DNA polymerase. Nature. 2004;431:217–221. doi: 10.1038/nature02908. [DOI] [PubMed] [Google Scholar]
- Johnson KA. Conformational coupling in DNA polymerase fidelity. Annu Rev Biochem. 1993;62:685–713. doi: 10.1146/annurev.bi.62.070193.003345. [DOI] [PubMed] [Google Scholar]
- Johnson SJ, Taylor JS, Beese LS. Processive DNA synthesis observed in a polymerase crystal suggests a mechanism for the prevention of frameshift mutations. Proc Natl Acad Sci U S A. 2003;100:3895–3900. doi: 10.1073/pnas.0630532100. [DOI] [PMC free article] [PubMed] [Google Scholar]
- Johnson SJ, Beese LS. Structures of mismatch replication errors observed in a DNA polymerase. Cell. 2004;116:803–816. doi: 10.1016/s0092-8674(04)00252-1. [DOI] [PubMed] [Google Scholar]
- Jorgensen WL, Chandrasekhar J, Madura JD, Impey RW, Klein ML. Comparison of Simple Potential Functions for Simulating Liquid Water. J Chem Phys. 1983;79:926–935. [Google Scholar]
- Joyce CM, Benkovic SJ. DNA polymerase fidelity: kinetics, structure, and check-points. Biochemistry. 2004;43:14317–14324. doi: 10.1021/bi048422z. [DOI] [PubMed] [Google Scholar]
- Joyce CM, Steitz TA. Function and structure relationships in DNA polymerases. Annu Rev Biochem. 1994;63:777–822. doi: 10.1146/annurev.bi.63.070194.004021. [DOI] [PubMed] [Google Scholar]
- Kale L, Skeel R, Bhandarkar M, Brunner R, Gursoy A, Krawetz N, Phillips J, Shinozaki A, Varadarajan K, Schulten K. NAMD2: Greater scalability for parallel molecular dynamics. J Comp Phys. 1999;151:283–312. [Google Scholar]
- Kiefer JR, Mao C, Braman JC, Beese LS. Visualizing DNA replication in a catalytically active Bacillus DNA polymerase crystal. Nature. 1998;391:304–307. doi: 10.1038/34693. [DOI] [PubMed] [Google Scholar]
- Kiefer JR, Mao C, Hansen CJ, Basehore SL, Hogrefe HH, Braman JC, Beese LS. Crystal structure of a thermostable Bacillus DNA polymerase I large fragment at 2.1 Å resolution. Structure. 1997;15:95–108. doi: 10.1016/s0969-2126(97)00169-x. [DOI] [PubMed] [Google Scholar]
- Li Y, Korolev S, Waksman G. Crystal structures of open and closed forms of binary and ternary complexes of the large fragment of Thermus aquaticus DNA polymerase I: structural basis for nucleotide incorporation. EMBO J. 1998;17:7514–7525. doi: 10.1093/emboj/17.24.7514. [DOI] [PMC free article] [PubMed] [Google Scholar]
- MacKerell AD, Bashford D, Bellott M, Dunbrack RL, Evanseck JD, Field MJ, Fischer S, Gao J, Guo H, Ha S, Joseph-McCarthy D, Kuchnir L, Kuczera K, Lau FTK, Mattos C, Michnick S, Ngo T, Nguyen DT, Prodhom B, Reiher WE, Roux B, Schlenkrich M, Smith JC, Stote R, Straub J, Watanabe M, Wiorkiewicz-Kuczera J, Yin D, Karplus M. All-atom empirical potential for molecular modeling and dynamics studies of proteins. J Phys Chem B. 1998;102:3586–3616. doi: 10.1021/jp973084f. [DOI] [PubMed] [Google Scholar]
- MacKerell AD, Banavali NK. All-atom empirical force field for nucleic acids: II. Application to molecular dynamics simulations of DNA and RNA in solution. J Comp Chem. 2000;21:105–120. [Google Scholar]
- Minnick DT, Bebenek K, Osheroff WP, Turner RM, Jr, Astatke M, Liu L, Kunkel TA, Joyce CM. Pre-steady-state kinetic-analysis of processive DNA-replication including complete characterization of an exonuclease-deficient mutant. J Biol Chem. 1999;274:3067–3075. [Google Scholar]
- Ollis DL, Brick P, Hamlin R, Xuong NG, Steitz TA. Structure of large fragment of Escherichia coli DNA polymerase I complexed with dTMP. Nature. 1985;313:762–766. doi: 10.1038/313762a0. [DOI] [PubMed] [Google Scholar]
- Patel SS, Wong I, Johnson KA. Biochemistry. 1991;30:511–525. doi: 10.1021/bi00216a029. [DOI] [PubMed] [Google Scholar]
- Radhakrishnan R, Schlick T. Orchestration of cooperative events in DNA synthesis and repair mechanism unraveled by transition path sampling of DNA polymerase β's closing. Proc Natl Acad Sci USA. 2004;101:5970–5975. doi: 10.1073/pnas.0308585101. [DOI] [PMC free article] [PubMed] [Google Scholar]
- Pavelites JJ, Bash PA, Gao J, MacKerell AD., Jr A Molecular Mechanics Force Field for NAD+, NADH and the Pyrophosphate Groups of Nucleotides. J Comp Chem. 1997;18:221–239. [Google Scholar]
- Rigler R. Nobel prize symposium: Single Molecule Spectroscopy in Chemistry, Physics and Biology 2008 organizer. [Google Scholar]
- Rothwell PJ, Waksman G. Structure and mechanism of DNA polymerases. Adv Protein Chem. 2005;71:401–440. doi: 10.1016/S0065-3233(04)71011-6. [DOI] [PubMed] [Google Scholar]
- Ryckaert JP, Ciccotti G, Berendsen HJC. Numerical integration of the Cartesian equations of motion of a system with constraints: molecular dynamics of n-alkanes. J Comp Phys. 1977;23:327–341. [Google Scholar]
- Schlitter J, Engels M, Kruger P, Jacoby E, Wollmer A. Targeted Molecular Dynamics Simulation of Conformational Change - Application to the T ↔ R Transition in Insulin. Mol Sim. 1993;10:291–&. [Google Scholar]
- Steitz TA. DNA polymerases: structural diversity and common mechanisms. J Biol Chem. 1999;274:17395–17398. doi: 10.1074/jbc.274.25.17395. [DOI] [PubMed] [Google Scholar]
- Van der Vaart A, Karplus M. Simulation of conformational transitions by the restricted perturbation-targeted molecular dynamics method. J Chem Phys. 2005;122:114903. doi: 10.1063/1.1861885. [DOI] [PubMed] [Google Scholar]
- Wang J, Sattar AK, Wang CC, Karam JD, Konigsberg WH, Steitz TA. Crystal structure of a pol alpha family replication DNA polymerase from bacteriophage RB69. Cell. 1997;89:1087. doi: 10.1016/s0092-8674(00)80296-2. [DOI] [PubMed] [Google Scholar]
- Warren JJ, Forsberg LJ, Beese LS. The structural basis for the mutagenicity of O6-methyl-guanine lesions. Proc Natl Acad Sci USA. 2006;103:19701–19706. doi: 10.1073/pnas.0609580103. [DOI] [PMC free article] [PubMed] [Google Scholar]
- Yang LJ, Beard WA, Wilson SH, Broyde S, Schlick T. Polymerase beta simulations suggest that Arg258 rotation is a slow step rather than large subdomain motions per se. J Mol Biol. 2002;317:651–671. doi: 10.1006/jmbi.2002.5450. [DOI] [PubMed] [Google Scholar]
- Yin YW, Steitz TA. The structural mechanism of translocation and helicase activity in T7 RNA polymerase. Cell. 2004;116:393–404. doi: 10.1016/s0092-8674(04)00120-5. [DOI] [PubMed] [Google Scholar]
- Zhang G, Campbell EA, Minakhin L, Richter C, Severinov K, Darst SA. Crystal structure of Thermus aquaticus core RNA polymerase at 3.3 Å resolution. Cell. 1999;98:811–824. doi: 10.1016/s0092-8674(00)81515-9. [DOI] [PubMed] [Google Scholar]
Associated Data
This section collects any data citations, data availability statements, or supplementary materials included in this article.