

Abstract
Experimental evidence suggests that regional differences in action potential (AP) morphology can provide a substrate for initiation and maintenance of reentrant arrhythmias in the right atrium (RA), but the relationships between the complex electrophysiological and anatomical organization of the RA and the genesis of reentry are unclear. In this study, a biophysically detailed three-dimensional computer model of the right atrial tissue was constructed to study the role of tissue heterogeneity and anisotropy in arrhythmogenesis. The model of Lindblad et al. for a rabbit atrial cell was modified to incorporate experimental data on regional differences in several ionic currents (primarily, INa, ICaL, IK1, Ito, and Isus) between the crista terminalis and pectinate muscle cells. The modified model was validated by its ability to reproduce the AP properties measured experimentally. The anatomical model of the rabbit RA (including tissue geometry and fiber orientation) was based on a recent histological reconstruction. Simulations with the resultant electrophysiologically and anatomically detailed three-dimensional model show that complex organization of the RA tissue causes breakdown of regular AP conduction patterns at high pacing rates (>11.75 Hz): as the AP in the crista terminalis cells is longer, and electrotonic coupling transverse to fibers of the crista terminalis is weak, high-frequency pacing at the border between the crista terminalis and pectinate muscles results in a unidirectional conduction block toward the crista terminalis and generation of reentry. Contributions of the tissue heterogeneity and anisotropy to reentry initiation mechanisms are quantified by measuring action potential duration (APD) gradients at the border between the crista terminalis and pectinate muscles: the APD gradients are high in areas where both heterogeneity and anisotropy are high, such that intrinsic APD differences are not diminished by electrotonic interactions. Thus, our detailed computer model reconstructs complex electrical activity in the RA, and provides new insights into the mechanisms of transition from focal atrial tachycardia into reentry.
Introduction
Cardiac arrhythmias, such as atrial flutter and fibrillation (AF), are associated with irregular high-frequency electrical activity in the heart (1,2). Both experimental and computational evidence supports the idea that such arrhythmias can be sustained by a number of reentrant activation waves (3,4), but mechanisms of reentry initiation in the atria are poorly understood. Experimental data demonstrate that cardiac (primarily, atrial) tissues with large regional differences in electrical properties are more vulnerable to reentry (5,6), which may result from unidirectional conduction block in regions with longer refractoriness. However, details of the relationship between tissue anatomical structure, anisotropy, electrical heterogeneity, and vulnerability to reentry are difficult to dissect experimentally.
Biophysically and anatomically detailed computational models have been successfully used to dissect the mechanisms of complex cardiac dynamics observed in experiments (3,7,8), but the majority of these computer simulation studies have focused on spiral wave breakup due to dynamic rather than naturally existing electrophysiological or anatomical heterogeneities. Interactions of structure-dependent heterogeneity with electrical activation patterns have been considered only in simplified two-dimensional models (9,10).
Relationships between structure and function of the atria have long been recognized (11–13). It has been proposed that the complex branching anatomy of the crista terminalis and pectinate muscle bundles in the right atrium (RA) can provide a substrate for reentrant activity during AF. Primarily, the thick bundle of crista terminalis can act as a conduction barrier leading to initiation of atrial reentry (6). However, echocardiographic clinical data suggest that the block within the crista terminalis is functional in nature (14–16), and hence, factors other than the bundle structure must be considered—such as different action potential morphologies within the crista terminalis and the rest of the RA (17,18).
The RA is characterized by significant regional differences in action potential (AP) morphology, which are due to variations in the density of several ionic currents (17–21). An organized distribution of AP morphology with the longest action potential duration (APD) near the sinoatrial (SA) node and decreasing APD along the conduction pathway has been reported (17,22): the crista terminalis is the first to be activated by the AP arriving from the SA node, and the activation then spreads to the pectinate muscles; the AP of the crista terminalis is longer than that of the pectinate muscles (17,22).
The aim of this study is to construct and study a detailed computer model combining the anatomy of the rabbit RA (23) and electrophysiological differences between its major structurally distinct regions (18). A generic rabbit atrial AP model (24) is modified based on extant voltage-clamp datasets recorded for several ionic currents from rabbit crista terminalis and pectinate muscle cells (18). The bundle structure of the RA is accounted for by anisotropic gap junction conductance along and transverse to the experimentally identified fibers of the crista terminalis and pectinate muscles (23). The resultant three-dimensional model is used to study the role of complex tissue organization in transition from normal to reentrant electrical activity in the RA subjected to high rate pacing.
Model Development
The dynamics of electrical activation in cardiac tissues can be described by the following nonlinear partial differential equation (7,8,25):
| (1) |
Here V (mV) is the membrane potential, ∇ is a spatial gradient operator defined within the tissue geometry, and t is time (s). D is a tensor of diffusion coefficients (mm2 ms−1) that characterizes electrotonic spread of voltage via gap junctional coupling, C m (pF) is the cell membrane capacitance, and I ion is the total membrane ionic current (pA). Families of electrophysiologically detailed cardiac cell models have been developed to describe the voltage- and time-dependent current, I ion (26). Such models are normally based on experimentally measured voltage-clamp datasets for individual ionic currents (Na+, Ca2+, K+), and allow simulations of the AP morphology and rate-dependence.
A model describing the total ionic current for a rabbit atrial cell has been developed by Lindblad et al. (24). While it can accurately reproduce the whole cell voltage-clamp data on which it has been based, and provides feasible morphologies of the rabbit atrial AP, the model has several limitations. Primarily, the model uses hybrid experimental datasets recorded from cells in the rabbit left atrium (27,28), the SA node (29,30), and ventricles (31,32). Secondly, the model does not account for regional differences in the electrical properties of atrial cells. As APs in right and left atrial cells are different (19), comparison of APs simulated with the model (24) to those recorded experimentally from rabbit right atrial cells of the crista terminalis and pectinate muscles (18) demonstrates substantial differences in their morphology—primarily, the AP shape, duration, the resting membrane potential, and the AP overshoot. These differences are illustrated in Fig. 1 and Table 1.
Figure 1.
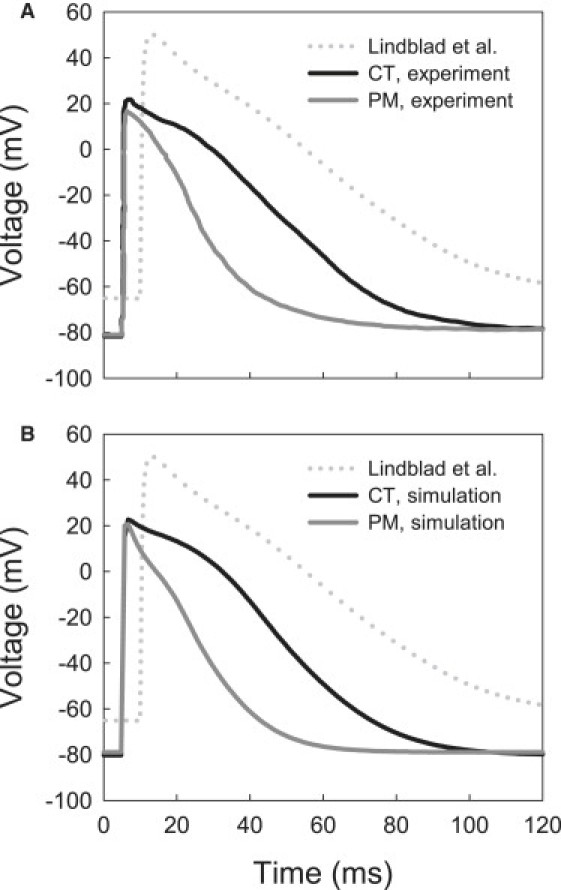
Action potentials in the rabbit crista terminalis (CT) and pectinate muscle (PM) cells. (A) Experimental recordings (18). (B) Simulations with the respective modified models. AP simulated with the original model by Lindblad et al. (24) is shown in both panels with dotted lines. AP characteristics are summarized in Table 1.
Table 1.
Action potential properties in rabbit atrial cells: model versus experiment
| Lindblad et al. (24) | Yamashita et al. (18) |
Modified model |
|||
|---|---|---|---|---|---|
| CT | PM | CT | PM | ||
| RP, mV | −65 | −81 ± 5 | −78 ± 3 | −81 | −78 |
| APA, mV | 115 | 98 ± 6 | 92 ± 7 | 104 | 98 |
| APD, ms | 97 | 77 ± 5 | 52 ± 8 | 78 | 50 |
| dV/dtmax, V/s | 113 | 147 ± 46 | 159 ± 49 | 164 | 165 |
CT, crista terminalis; PM, pectinate muscle; RP, resting potential; APA, action potential amplitude; APD, action potential duration (measured at 90% repolarization); and dV/dtmax, maximum upstroke velocity. All values were obtained at a stimulation frequency of 1 Hz.
The aim of this study is to develop a new family of AP models for the rabbit right atrium that 1), is based on available experimental data obtained from rabbit RA cells; and 2), incorporates details of regional differences in the RA cell electrical properties. Hence, the model by Lindblad et al. (24) was modified based on relevant experimental data for the kinetics and current densities of several major ionic currents determining the AP properties of rabbit RA cells. Yamashita et al. (18) provided voltage-clamp datasets for several ionic currents (L-type Ca2+ current, I CaL, transient outward current, I to, and inward rectifier K+ current, I K1) varying between the crista terminalis and pectinate muscle cells, and Ko et al. reported new data on the kinetics of I CaL (33) and the fast Na+ current, I Na (34). Conductances and kinetics of these currents were modified to simulate their correct time course, current density, and current-voltage (I-V) relationships reported in the experiments. Below we describe details of such modifications made for each individual current.
Fast Na+ current, INa
The fast Na+ current responsible for the initial depolarization of the AP is difficult to measure experimentally. The only available experimental dataset from rabbit atria, used by the model of Lindblad et al. (24), has been obtained under nonphysiological conditions (primarily, low temperature, 17°C). Hence, whereas steady-state characteristics of I Na in the model are reliable, its highly temperature-dependent kinetics can be improved. A nonphysiologically high AP overshot, which is ∼+50 mV compared to +20 mV measured in experiments (18), is an indicator of inadequate kinetics of I Na in the model of Lindblad et al. (24). Hence, we modified the I Na kinetics based on the recent experimental data from rabbit atrial cells (34), and compared the results to experimental voltage-clamp measurements from peripheral rabbit SA node cells (35) adjacent to the crista terminalis.
The I-V relationship for I Na simulated with the original model by Lindblad et al. (24) is significantly different from the experimental data from Honjo et al. (35) at positive membrane voltages ( Fig. 2 A). The difference can be corrected by reformulating the inactivation kinetics of I Na based on the experimental measurements of Ko et al. (34)—primarily by decreasing the inactivation time constants, τ h1 and τ h2, by 0.2 and 2.5 ms, respectively (Fig. 2 B). These changes improved the match between the simulated I-V relationship and experimental data (35), and resulted in a reduction of the AP overshoot to the physiological value of ∼+20 mV (18). Changes in the inactivation kinetics also produced a maximum upstroke velocity of ∼165 V/s, which is consistent with the experimental data of Yamashita et al. (18). The modified formulation for I Na was used in both the crista terminalis and pectinate muscle cell models, as no evidence for regional heterogeneity in I Na in the RA has been reported.
Figure 2.
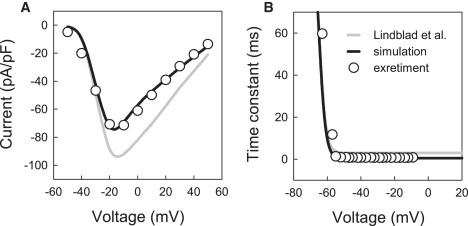
Characteristics of the fast Na+ current, INa. (A) Current-voltage relationships simulated with the original model of Lindblad et al. (24) (shaded line) and our modified model (solid line) compared to experimental data for the rabbit SA node (35) (dots); peak density of INa was measured during 10 ms voltage-clamp pulses to −55 to +40 mV from the holding potential of −60 mV. (B) Slow inactivation time constant of INa in the original model of Lindblad et al. (24) and our modified model compared to experimental data for rabbit atrial cells (34).
L-type Ca2+ current, ICa,L
The sustained inward L-type Ca2+ current supports the AP plateau and provides a trigger for the intracellular Ca2+-induced Ca2+ release. The description of I Ca,L in the model by Lindblad et al. (24) was based on experimental data obtained from rabbit SA node cells (29) and ventricular cells (32). Comparing the I-V relationships for I Ca,L simulated with the model and measured in experiments by Yamashita et al. (18) shows significant differences in the current density ( Fig. 3), which is ∼50% lower in the model. In addition, the I-V relationship simulated with the model is shifted by ∼+10 mV in comparison to the experimental ones.
Figure 3.
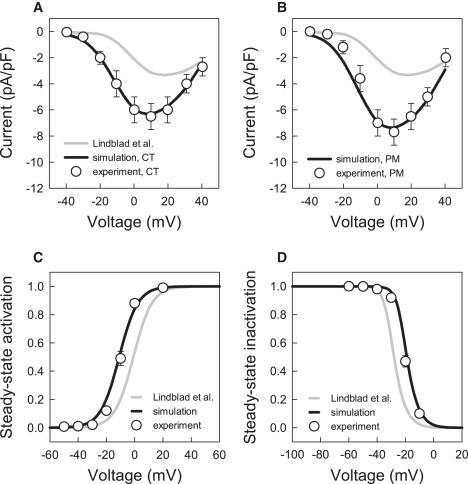
Characteristics of the L-type Ca2+ current, ICa,L. (A and B) Current-voltage relationships simulated with the original model by Lindblad et al. (24) and our modified model compared to experimental data for rabbit crista terminalis and pectinate muscle cells (18) (dots). Peak density of ICa,L was measured during 200 ms voltage-clamp pulses to −40 to +40 mV from a holding potential of −60 mV. (C and D) Steady-state activation and inactivation curves for ICa,L in the original model by Lindblad et al. (24) and our modified model compared to experimental data for rabbit atrial cells (33).
Hence, we reformulated the steady-state characteristics of I Ca,L (primarily, shifted the steady-state activation and inactivation curves along with the respective time constants) based on the experimental data of Ko et al. (33), and adjusted the maximum current conductance of I Ca,L to produce I-V relationships consistent with the experimental measurements (18). As Yamashita et al. (18) reported different currents densities in rabbit crista terminalis and pectinate muscle cells, the I Ca,L conductance in the model was adjusted differentially (increased by 180 and 220%, respectively), resulting in the I-V relationships consistent with the experimental measurements for these two cell types (Fig. 3). These modifications improved the overall shape of the APs simulated by the model.
Inward rectifier K+ current, IK1
The inward rectifier supplies a functionally important K+ current that strongly influences the resting membrane potential. Description of I K1 in the model by Lindblad et al. (24) utilized a combination of experimental data obtained from the cells in the rabbit left atrium (30) and rabbit ventricles (27)—although the latter article reported significant differences in this current between rabbit atrial and ventricular cells. As in the case of I Ca,L, the current density of I K1 in the model (24) is lower than that reported for rabbit crista terminalis and pectinate muscle cells by Yamashita et al. (18). Hence, to match the experimental data we increased the conductance of I K1 by 200% and 250% for the crista terminalis and pectinate muscle cells, respectively. In addition, the intracellular K+ concentration, [K+]i, was increased from 100 mM (24) to a more physiological value of 140 mM. Combined changes in the conductance of I K1 and [K+]i shifted the resting membrane potential in the model from −65 mV toward the physiological value of ∼−80 mV (Table 1). Small differences in the resting membrane potential between the crista terminalis and pectinate muscle cells (see Table 1) were simulated by setting conductances of the background inward Na+ and Ca2+ currents, I Na,b and I Ca,b—1.5 times higher in the pectinate muscle cells.
Transient and sustained outward currents, Ito and Isus
The transient outward K+ current, I to, develops immediately after the AP upstroke and significantly modulates early repolarization. It is likely that the sustained component of outward current (see inset in Fig. 4 B), which affects later stages of repolarization, is a separate current rather than another phase of I to. Therefore, similar to the existing models of rabbit atrial (24) and SA node (36) cells, we chose to treat the two components as separate mathematical entities, I to and I sus.
Figure 4.
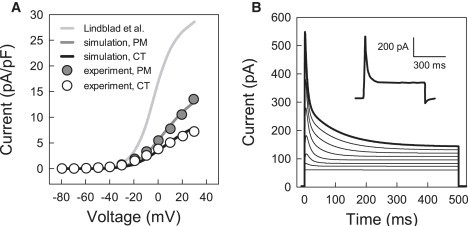
Characteristics of the transient outward K+ current, Ito. (A) Current-voltage relationships simulated with the original model of Lindblad et al. (24) and our modified models compared to experimental data for rabbit crista terminalis (CT) and pectinate muscle (PM) cells (18); peak density of Ito was measured in the voltage-clamp simulations illustrated in panel B. (B) Current simulated during 500 ms voltage-clamp pulses to −70 to +30 mV from a holding potential of −80 mV as compared with an experimental recording from a pectinate muscle cell (18); the latter is shown in the inset and was obtained in the presence of TTX to block INa and Cd2+ to block ICaL. Note that panel A shows the pure 4-AP-sensitive current Ito, whereas panel B presents the sum of Ito and Isus.
Description of I to in the Lindblad et al. model (24) was based on experimental data obtained from both atrial (37) and ventricular (31) cells from rabbit. Ventricular data were used, primarily, for fitting the amplitude of I to in the model. However, the resulting current density computed from the model (24) is significantly different from the experimental measurements by Yamashita et al. (Fig. 4 A). Hence, we had to modify the model by decreasing the conductance of I to by 80% and 65% for the crista terminalis and pectinate muscle cells, respectively, to obtain the I-V relationships matching the experimental data (Fig. 4 A).
The sustained current in the Lindblad et al. model (24) was considered to be carried by Cl−, and is described as the background Cl− current, I Cl,b. However, we chose to refer to it as simply I sus, and consider it as a background current with a reversal potential of −70 mV, as measured by Yamashita et al. (18). As our simulations revealed that the APD in the model was highly sensitive to the magnitude of I sus, the conductance of I sus was chosen empirically to adjust the APD in the crista terminalis and pectinate muscle cells. These final modifications resulted in feasible outward current (Fig. 4 B), and correct APDs (Table 1) and the overall AP shapes (Fig. 1) in the models for the two atrial cell types.
Appendix 1 summarizes all changes made to the model by Lindblad et al. (24) to reproduce the AP properties in the crista terminalis and pectinate muscle cells, and Fig. 5 illustrates regional differences in the ionic current densities simulated with the modified models as compared to the respective experimental data of Yamashita et al. (18). In summary, two modifications of the Lindblad et al. model (24) have been developed to describe regional ionic and AP differences between two major cell types in the rabbit RA.
Figure 5.
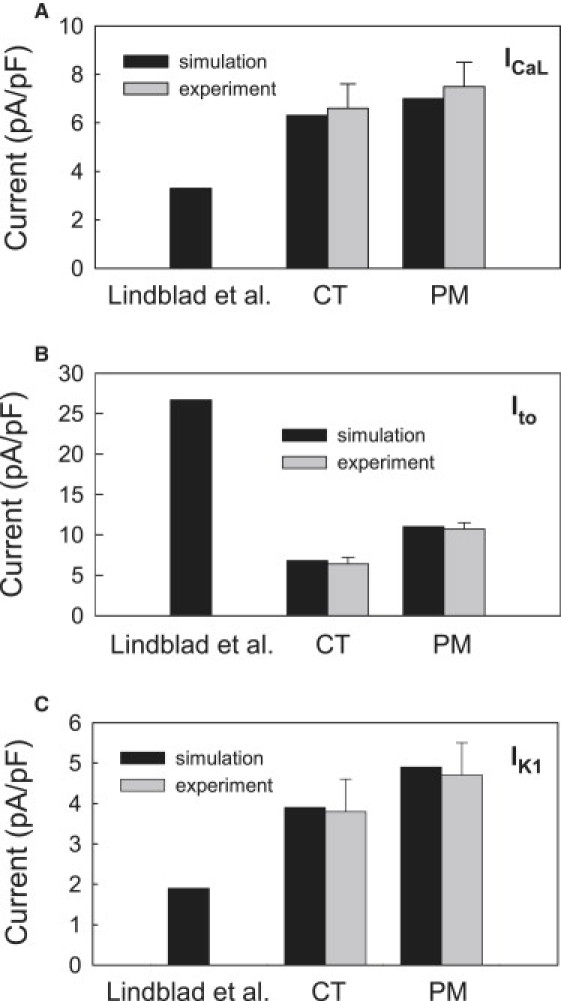
Densities of ionic currents simulated with the original model by Lindblad et al. (24) and our modified models for rabbit crista terminalis and pectinate muscle cells (solid bars) as compared to the experimental data of Yamashita et al. (18) (shaded bars). (A) L-type Ca2+ current, ICa,L. (B) Transient outward K+ current, Ito. (C) Inward rectifier K+ current, IK1.
Ca2+ handling
Very limited experimental data on the intracellular Ca2+ dynamics and their differences between the crista terminalis and pectinate muscle cells is available. As noted by Lindblad et al. (24), their model only qualitatively mimics the Ca2+ transient, as the available data do not provide a sufficient basis for modeling the intracellular Ca2+ handling mechanisms quantitatively. As the main aim of this study was to develop electrophysiologically detailed cell and tissue models based on relevant experimental data, and to investigate quantitative, as well as qualitative effects of the electrical heterogeneity on the genesis of reentry in the RA, we tried to avoid potentially artificial effects of inadequately modeled Ca2+ handling on electrical activity. Hence, unless stated otherwise, simulations were performed with the intracellular Ca2+ concentration buffered to a constant level of 0.073 μM (Model 1). However, results obtained using cell and tissue models with such buffered Ca2+ handling were compared to and validated against results obtained with respective full models including the description of the Ca2+ dynamics by Lindblad et al. (Model 2). The latter was modified to account for the decreased AP overshoot; the voltage threshold for activation of Ca2+ release, V act, was respectively decreased from +40 to +20 mV.
Dependence of Ca2+ release on the membrane potential in the model by Lindblad et al. (24) is contrived, as studies that are more recent have demonstrated that this type of release is the characteristic of skeletal muscle, rather than cardiac muscle (38). To determine whether results of our study are affected by a more realistic form of Ca2+ release, we also used the Ca2+ handling model by Shannon et al. (39) (Model 3). The latter provides a feasible description of Ca2+-induced Ca2+ release in rabbit ventricular myocytes, and produces long Ca2+ transients (∼500 ms) characteristic of this cell type. We used Ca2+ handling equations and parameters by Shannon et al. (39) as downloaded from http://www.cellml.org, but rescaled cell volumes and the magnitude of Ca2+ uptake (pump) and release fluxes, J pump,SR and J rel,SR, to produce shorter Ca2+ transients (∼100 ms) characteristic of rabbit atrial myocytes (40,41). Primarily, the whole cell volume, Volcell, (and hence, volumes of all intracellular compartments) was halved, and rate constants of J pump,SR and J rel,SR (V max and k s, respectively) were increased 15- and fivefold, respectively. Note that all ionic currents in ventricular myocytes can be considered as consisting of two fractions that flow through the sarcolemma and junctional clefts, respectively (39). Such consideration is invalid in case of atrial myocytes due to the lack of T-tubule system (42). Hence, we considered all ionic currents in Model 3 as purely sarcolemmal currents, with the current responsible for Ca2+-induced Ca2+ release, I Ca,L, flowing into the cell at specialized junctional sites close to ryanodine receptors (42,43).
Full kinetic equations for the alternative formulations of the Ca2+ handling models by Lindblad et al. (24) and Shannon et al. (39) are presented in Appendices 2 and 3.
Other ion concentrations
Similar to buffering the intracellular Ca2+ concentration, concentrations of Na+ and K+ in Model 1 were buffered to constant levels ([Na+]i = 8.4 mM and [K+]i = 140 mM) to avoid effects of slow concentration drifts on electrical activity. However, in Model 2 and Model 3 full dynamic variations of the intracellular ionic concentrations, as described by Lindblad et al. (24) and Shannon et al. (39), were used. Respective kinetic equations are presented in Appendices 2 and 3. Hence, in the model with buffered Ca2+ (Model 1), all ion concentrations are buffered, whereas in models with full Ca2+ handling (Models 2 and 3), the concentrations are dynamic. Initial values for all concentrations (as well as other kinetic variables) in the latter case were determined as steady-state values at the end of 10 s pacing at physiological rate of 500 ms.
Three-dimensional tissue model
The developed single cell models were incorporated into a detailed three-dimensional tissue model describing the complex anatomical structure of the rabbit RA tissue ( Fig. 6).
Figure 6.
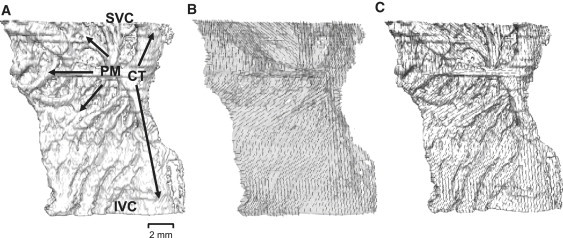
Reconstructed anatomy of rabbit RA tissue. (A) Three-dimensional tissue geometry with the thick bundle of crista terminalis (CT, crossing the tissue vertically) and smaller pectinate muscles (PM, branching to the left) shown with arrows. Approximate positions of the superior vena cava (SVC) and the inferior vena cava (IVC) are indicated. Note that holes in the tissue geometry are not physical defects of the RA, but simply areas occupied by connective tissue as identified by histological methods (23). (B) Fiber orientations in the semitransparent tissue shown with short solid lines. (C) Superposition of the tissue geometry and fiber orientation illustrating fiber alignment along the bundles of the crista terminalis and pectinate muscles.
In cardiac tissue, cylindrical cells are aligned parallel to each other, and excitation is conducted faster along the fibers than across them (2,44–46). Primarily, the RA tissue has a characteristic pattern of fibers arranged along the bundles of the crista terminalis and pectinate muscles, which provides a fast pathway for activation spread from the SA node into the RA. Detailed three-dimensional anatomical structure of the rabbit RA has been reconstructed recently based on a combination of histological and immunohistochemical experiments (23). Its geometry presents a high-resolution (40 μm), regular Cartesian grid of 210 × 45 × 240 points; for each point a flag variable identifies whether it belongs to the crista terminalis or pectinate muscle. Fiber orientation has been measured histologically at the epicardial and endocardial surfaces of the RA. As these two patterns are similar to each other, and the rabbit atrial tissue is very thin, we assume that the fiber orientation does not change through the depth of the tissue. Details of the fiber alignment along the bundles of the crista terminalis and pectinate muscles are illustrated in Fig. 6, B and C.
Values of the diffusion coefficients along and transverse to the fibers in our model are D || = 5 mm2 ms−1 and D ⊥ = 0.5 mm2 ms−1 (corresponding to integral gap junctional conductances of 500 nS and 50 nS), respectively. Such diffusion coefficients produce intraatrial conduction velocities of ∼0.6 and 0.2 m/s in parallel and transverse to the fiber direction. This is in good agreement with respective experimental measurements of 0.5–0.8 and 0.15–0.45 m/s (44–46). Combinations of the fiber orientation vectors with the diffusion coefficients give components of the tensor D at each grid point (7,25).
Equation 1 was solved on the geometry grid using a finite-difference partial differential equation solver based on the explicit Euler method with time and space steps, Δt = 0.005 ms and Δx = 0.04 mm, respectively. Computer code implementing the partial differential equation solver was parallelized under MPI and executed on the IBM BlueGene supercomputer (Edinburgh, UK). A single run of the code simulating 1 s of activity on 128 CPUs took ∼6 h. Thus, a high-resolution model incorporating detailed tissue anatomy, fiber orientation, and electrical heterogeneity within the rabbit RA has been constructed and implemented.
Simulations
Fig. 1 illustrates simulated action potentials in the crista terminalis and pectinate muscle cells, as compared to the respective experimental recordings (18). Not only the AP shapes, but all major AP characteristics are consistent with the experimental data shown in Table 1: the new models accurately reproduce the AP duration, overshoot, maximum upstroke velocity, and the resting membrane potential, as observed in experiments by Yamashita et al. (18). Importantly, the original model by Lindblad et al. (24) was modified only to incorporate available experimental data on kinetics of several ionic currents in the crista terminalis and pectinate muscle cells (18,33,34), but this ultimately resulted in accurate reconstruction of the experimentally measured AP properties in these two cell types.
Transition from normal propagation to reentry
Computer simulations with the three-dimensional model reproduce essential features of patterns of electrical activity in the rabbit RA tissue, similar to those observed in experiments (22). Fig. 7 shows subsequent snapshots of an activation wave spreading through the three-dimensional tissue. An initial action potential was generated by applying a localized stimulation at the border between the crista terminalis and adjacent pectinate muscles (area 4.8 ≤ x ≤ 5.2 mm, 6.8 ≤ z ≤ 7.2 mm at the endocardial surface). Due to anisotropic intercellular coupling, the AP spreads into the neighboring cells, resulting in an activation wave that rapidly propagates through the fibers aligned along the crista terminalis and pectinate muscles into the whole RA. This mimics the natural activation sequence when the AP generated in the SA node spreads into the RA through the crista terminalis (22). Periodic pacing at a basic cycle length (BCL) of 330 ms (∼180 beats/min or 3.3 Hz, which is approximately the normal heart rate for rabbit) results in periodic regular activation patterns of the RA tissue.
Figure 7.
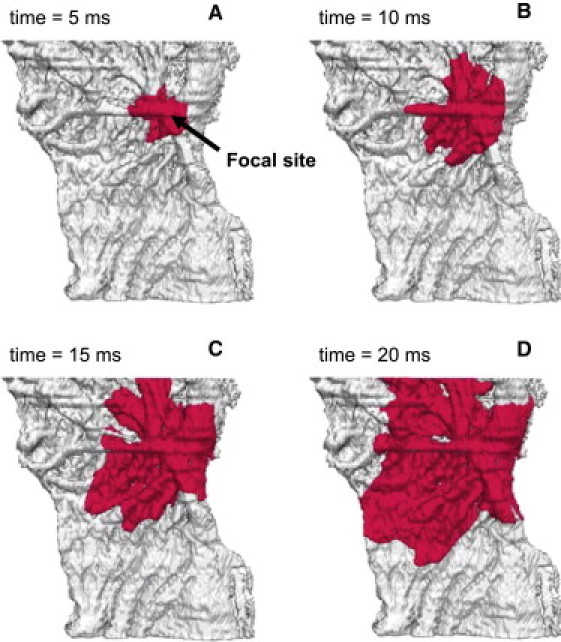
Normal electrical activity in the anatomically and electrophysiologically detailed model of rabbit RA tissue. Activity was initiated by applying a −10 nA stimulus to a focal pacing site (shown with an arrow). Snapshots of the propagating wave (A–D) are shown as iso-surfaces of the membrane voltage V = −30 mV for successive moments of time.
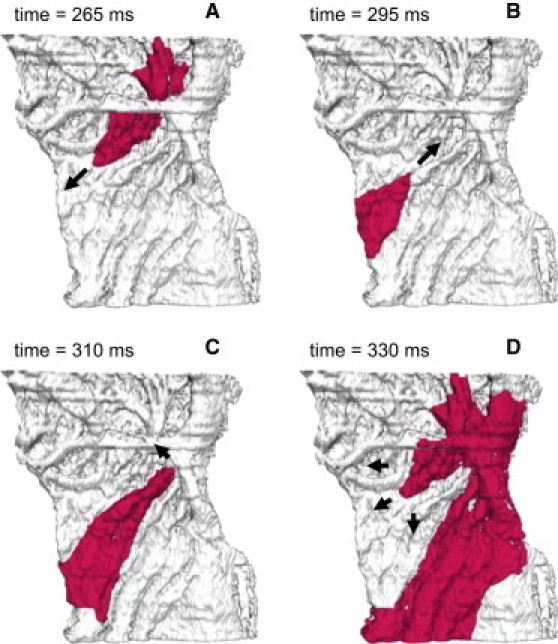
However, the tissue heterogeneity and anisotropy cause the normal AP conduction pattern to break-down at high pacing rates (∼700 beats/min or 11.75 Hz). As APD in the crista terminalis cells is longer (77 ms compared to 50 ms in the pectinate muscle cells (Table 1)) and electrotonic coupling transverse to fibers of the crista terminalis is weak, high-frequency pacing at a BCL of 85 ms applied to the border between these two regions results in a unidirectional conduction block toward the crista terminalis ( Fig. 8 A). Activation spreads into the RA along the individual pectinate muscles (Fig. 8 B) and reenters the initial pacing site and now-recovered crista terminalis (Fig. 8 C). Hence, after ∼300 ms of high-rate pacing a reentrant spiral wave is generated, rotating in the pectinate muscle region of the RA with a period of ∼60 ms (Fig. 8 D). Only every second cycle of the wave reenters the crista terminalis, such that the activation period here is doubled.
Figure 8.
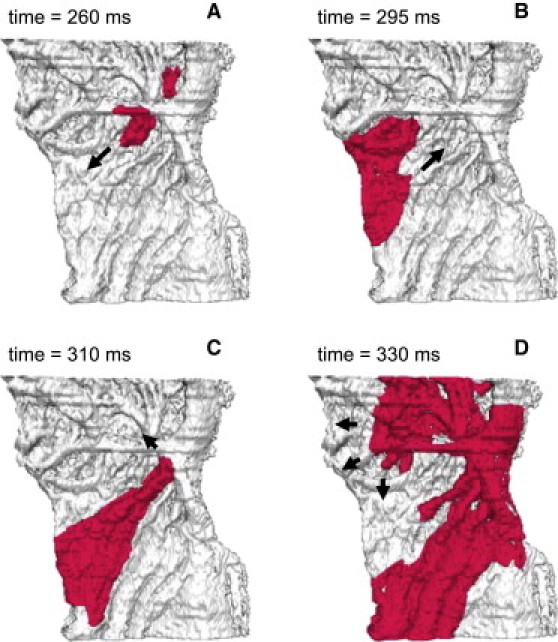
Reentrant electrical activity in the model of rabbit RA tissue. Reentry was initiated by applying a series of rapid stimuli to a focal pacing site (same as in Fig. 7). Snapshots of the propagating wave (A–D) are shown as iso-surfaces of the membrane voltage V = −30 mV for successive moments of time. The tissue heterogeneity results in a unidirectional conduction block toward the crista terminalis (A), leading to generation of a spiral wave reentry (D). Arrows indicate directions of wave propagation.
Note that reentry in these simulations is sustained, and meander of the reentrant spiral wave through the pectinate muscle network does not lead to its self-termination, contrary to results obtained for simplified models of isotropic human atrial tissues (47,48). High-frequency reentrant activation in our model of rabbit RA tissue is sustained primarily due to slow conduction through the anisotropic network formed by the pectinate muscles (see below). Note also that susceptibility to reentry is strongly dependent on the location of the pacing site (5,6), and a small shift of the pacing site in our simulations (from the endocardial area 4.8 ≤ x ≤ 5.2 mm, 6.8 ≤ z ≤ 7.2 mm, to the area 4.4 ≤ x ≤ 4.8 mm, 6.8 ≤ z ≤ 7.2 mm) can result in failure to initiate reentry. However, a much more extensive study will be required to search the whole range of such locations, as well as stimulation frequencies.
Mechanisms of reentry initiation
Fig. 8 illustrates that functional (AP heterogeneity) and anatomical (bundle anisotropy) differences between the crista terminalis and pectinate muscle lead to the conduction block and reentry, and sustained reentrant movement through the pectinate muscle region is also determined by the structure of its anisotropic bundle network. Further simulations suggest both heterogeneity and anisotropy are essential for reentry generation and maintenance, as even high-frequency pacing cannot generate reentry in either heterogeneous isotropic or homogeneous anisotropic RA tissue (not shown). This is consistent with the earlier hypothesis that reentry in the RA occurs as a result of a combined repolarization-anisotropic discontinuous propagation mechanism (6). Below we quantify contributions of the tissue heterogeneity and anisotropy to reentry mechanisms.
Fig. 9 A demonstrates simulated APD distributions in the RA tissue, which is consistent with experimental measurements (18,22); the APD is higher in the crista terminalis than in the pectinate muscle region. Fig. 9 B shows APD gradients across the border between these two areas for tissues with different degrees of anisotropy. Tissue with the highest anisotropy ratio (10:1, which is the natural gap junctional anisotropy of the RA bundles (44–46)) shows the highest APD gradients of up to ∼20 ms/mm, whereas in isotropic tissue the APD gradients are modulated by the electrotonic coupling and reduced to ∼1–3 ms/mm. Increase of the APD gradient at higher anisotropy ratios (Fig. 9 B) can be explained by weaker coupling transverse to the crista terminalis, which results in weaker modulation of the spatial APD distribution by the electrotonic interactions. Fig. 9 C shows that the magnitude of the APD gradients also increases at higher pacing rates. Hence, only anisotropic RA tissue paced at a high rate generates APD gradients large enough to produce conduction block in the crista terminalis. Note that the conduction block in our simulations was achieved primarily by pacing the tissue close to the site that produced the highest APD gradient (Fig. 9, B and C).
Figure 9.
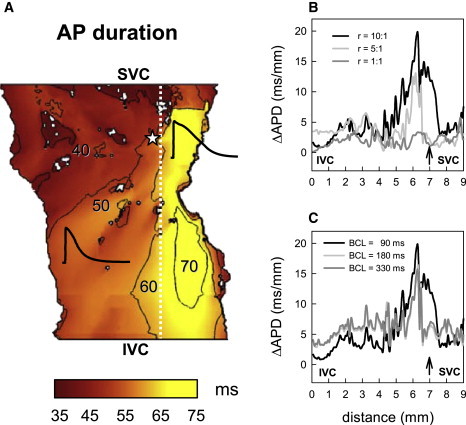
APD gradients in the model of rabbit RA tissue. (A) Spatial APD distribution illustrating tissue heterogeneity, with longer APs in the crista terminalis region of the tissue. Representative APs in the crista terminalis and pectinate muscle regions are shown. Palette indicates correspondence of color to the APD measured after normal AP propagation illustrated in Fig. 7. An asterisk indicates location of the pacing site. (B) APD gradients in anisotropic RA tissue (r = D||:D⊥ = 10:1), isotropic tissue (r = 1:1), and tissue with low anisotropy (r = 5:1) demonstrating different spatial patterns. The gradients are calculated across the border between the crista terminalis and pectinate muscle regions (white dashed line in A) and plotted against spatial coordinates counted along this border from the inferior vena cava (IVC) to the superior vena cava (SVC). An arrow indicates location of the pacing site. BCL = 90 ms. (C) APD gradients measured at different BCL (r = 10:1).
Fig. 10 shows the distribution of the activation times in the RA tissue, and the resultant time delays during conduction across the crista terminalis, which also strongly depend on the tissue anisotropy and pacing rate. Conduction across the crista terminalis takes only ∼5 ms in isotropic tissue, but almost 30 ms in the anisotropic RA tissue (Fig. 10 B). Increasing the pacing rate also leads to increasingly long conduction time delays (Fig. 10 C), and ultimately results in conduction block upon reaching the critical BCL of 85 ms, as seen in Fig. 8. This is consistent with experimental observations in dog (11).
Figure 10.
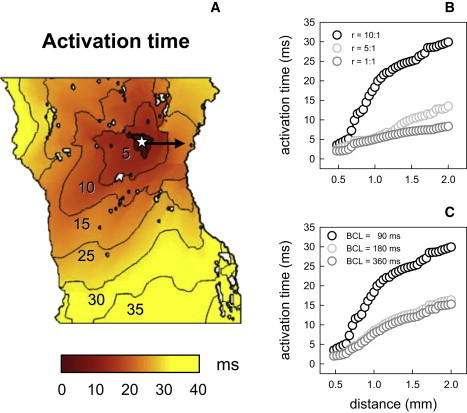
Activation times in the model of rabbit RA tissue. (A) Spatial distribution of activation times illustrating anisotropy of the tissue, with faster propagation along the bundles of the crista terminalis and pectinate muscle (the bundles can be seen in Fig. 6). Palette indicates correspondence of color to the activation times measured after normal AP propagation (illustrated in Fig. 7). An asterisk indicates location of the pacing site. (B) Activation times in anisotropic RA tissue (r = D||:D⊥ = 10:1), isotropic tissue (r = 1:1), and tissue with low anisotropy (r = 5:1) measured during conduction across the crista terminalis (arrow in A). BCL = 90 ms. (C) Activation times measured at different BCL (r = 10:1).
Importantly, time delays during conduction along pectinate muscles are also highly rate-dependent: high-frequency pacing of the RA increases the conduction time through the pectinate muscle network almost twice, from ∼15 ms at BCL = 180 ms up to ∼30 ms at BCL = 85 ms. It takes the AP ∼30 ms to travel down a bundle of pectinate muscles away from the pacing site, and 30 ms to come back along another bundle, so this provides a long enough time (∼60 ms) for the initial pacing site near the crista terminalis to recover before the AP reenters it after traveling along the pectinate muscle network. Hence, slow conduction through the anisotropic pectinate muscle network is a substrate for sustaining reentry in the RA tissue. This conclusion, based on measuring activation time delays in the RA tissue, along with the very existence of such time delays, is also consistent with a number of experimental observations (11,49).
Ca2+ handling effects
Intracellular Ca2+ dynamics has been shown to affect cellular AP properties and, as a result, patterns of reentrant electrical activity in the ventricles during transition from ventricular tachycardia to ventricular fibrillation (50,51). We studied effects of intracellular Ca2+ on AP properties and the genesis of reentry in the RA cell and tissue models.
We compared APs simulated using the cell models with buffered Ca2+ (Model 1) and the respective full models with two alternative descriptions of intracellular Ca2+ handling (Models 2 and 3): 1), the description by Lindblad et al. (24) incorporating voltage-dependent Ca2+ release ( Fig. 11); and 2), the description by Shannon et al. (39) incorporating Ca2+-induced Ca2+ release ( Fig. 12). In all three cases, the APs had similar morphologies at a physiological rate of 500 ms, and neither APs nor the intracellular Ca2+ transients in the full models showed beat-to-beat variations (Figs. 11 A and 12 A). Rapid pacing at BCL = 100 ms led to accumulation of intracellular Ca2+ in Models 2 and 3, which resulted in APs with a smaller amplitude, shorter APD, and elevated diastolic potential (DP) compared to Model 1 with buffered Ca2+ (Figs. 11 B and 12 B). Such behavior was qualitatively similar for both Ca2+ handling models used; qualitative differences between Models 2 and 3 (primarily, in the amplitude of Ca2+ transients) can be explained by greater Ca2+ release in the voltage-dependent Model 2. Note that accumulation of intracellular Ca2+ and elevation of the DP has been observed during rapid pacing in ventricular cells (51).
Figure 11.
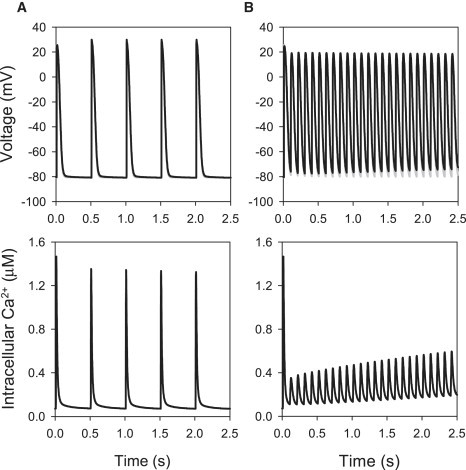
Effects of voltage-dependent Ca2+ handling on electrical activity in the crista terminalis cell model. APs simulated using Model 1 with the buffered intracellular Ca2+ concentration (shaded lines) are compared to those simulated using Model 2 with full Ca2+ handling (solid lines), as described by Lindblad et al. (24). APs paced at BCL of either 500 ms (A) or 100 ms (B) are shown in the two top panels; bottom panels show the intracellular Ca2+ concentration in the full model. During pacing at the physiological rate (A), AP parameters are similar in both models, with minor differences in the APD (78.8 ms in the buffered Ca2+ model and 81.5 ms in the full model) and the resting potential (−80.8 ms in the buffered Ca2+ model and −80.9 ms in the full model). Fast pacing results in an accumulation of intracellular Ca2+, a decrease of the APD, and elevation of the DP in the full model (B).
Figure 12.
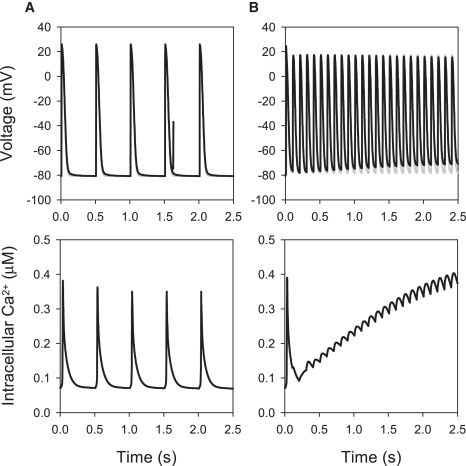
Effects of Ca2+-dependent Ca2+ handling on electrical activity in the crista terminalis cell model. APs simulated using Model 1 with the buffered intracellular Ca2+ concentration (shaded lines) are compared to those simulated using Model 3 with full Ca2+ handling (solid lines), as described by Shannon et al. (39). APs paced at BCL of either 500 ms (A) or 100 ms (B) are shown in the two top panels; bottom panels show the intracellular Ca2+ concentration in the full model. During pacing at the physiological rate (A), AP parameters are similar in both models, with minor differences in the APD (78.8 ms in the buffered Ca2+ model and 82.6 ms in the full model) and the resting potential (−80.8 ms in the buffered Ca2+ model and −81.0 ms in the full model). Fast pacing results in an accumulation of intracellular Ca2+, a decrease of the APD and elevation of the DP in the full model (B).
Importantly, genesis of reentry initiation was similar in the RA tissue models with and without Ca2+ handling: in all cases, reentry occurred due to a combination of the tissue electrical heterogeneity and anisotropy between the crista terminalis and pectinate muscles ( Fig. 13); the initiation mechanism was not affected by Ca2+ handling. Note that reentry in the tissue model with buffered Ca2+ (Model 1) was sustained, whereas in the full models (Models 2 and 3) it was transient and self-terminated after several cycles of rotation, as observed previously in two-dimensional model human atrial tissue models (47,48). This can be explained by emergence of conduction block areas within the tissue due to local elevations of intracellular Ca2+ (51,52), which leaves the spiral wave no space for rotation.
Figure 13.
Reentrant electrical activity in the model of rabbit RA tissue with Ca2+ handling. Results obtained using Models 2 and 3 are qualitatively and quantitatively similar. Reentry was initiated by applying a series of rapid stimuli to a focal pacing site (same location and BCL as in Fig. 8). Snapshots of the propagating wave (A–D) are shown as iso-surfaces of the membrane voltage V = −30 mV for successive moments of time. The tissue heterogeneity results in a unidirectional conduction block toward the crista terminalis (A), leading to generation of a spiral wave reentry (D). Arrows indicate directions of wave propagation.
Discussion
The main aims of this study were to:
-
1.
Develop a new family of AP models for the atrial cells of the crista terminalis and pectinate muscles, which incorporate experimental data on heterogeneous electrical properties of the rabbit RA (18).
-
2.
Develop a three-dimensional electrophysiologically and anatomically detailed computer model of the rabbit RA, which accounts for the electrical heterogeneities and fiber orientations in the distinctive regions of the crista terminalis and pectinate muscles (23).
-
3.
Use the three-dimensional model to investigate the effects of atrial electrical heterogeneity and anatomical complexity on the genesis of reentrant excitation in the RA.
These aims were successfully achieved. The resultant model reconstructs complex electrical activity in the rabbit RA, and provides insights into the mechanisms of transition from rapid focal activity to reentry due to atrial heterogeneity and anisotropy. Combined effects of intrinsic APD differences between the crista terminalis and pectinate muscles and conduction discontinuities due to their anisotropic bundle structure are identified as the substrate for such a transition, and slow conduction through the pectinate muscle network is a substrate for sustaining reentry in the RA tissue. Below we discuss major achievements, as well as limitations of the study, and compare its results and conclusions with AF mechanisms reported in other studies.
Single cell model
A new family of models for action potentials in rabbit atrial cells of the crista terminalis and pectinate muscles has been developed based on modifications of the model of Lindblad et al. (24). This is the first successful incorporation of detailed electrical heterogeneity of the rabbit RA into a mathematical model. The models, along with our previous models for the heterogeneous SA node (36) and ventricular myocytes (53), provide an important step toward our final goal of developing a model for the whole rabbit heart, which will account for details of its electrophysiological heterogeneity and anatomical complexity (54).
The new models for the rabbit crista terminalis and pectinate muscle cells have several advantages compared to earlier models of rabbit atrial cells (24,41) in terms of physiological detail and relevance. The Hilgemann-Noble model (41) was based on experimental data from multicellular tissue and did not reflect the true features of electrical activity in a single atrial myocyte. Although the ion channel kinetics and conductances in the Hilgemann-Noble model were later rescaled for a single cell (55), the model still had inevitable limitations as several ion channels had not been identified at that time (including the rapid and slow delayed rectifier K+ channels and the 4-AP sensitive transient outward K+ channel). A more recent model of Lindblad et al. (24) was developed mainly based on experimental data from single myocytes, but from a mixed source of different cell types and species. Another disadvantage of the Lindblad et al. model is that it does not address regional differences in the electrical properties of atrial cells (such as the differences between the crista terminalis and pectinate muscle cells). Although the AP simulated by the model of Lindblad et al. resembles the generic form of the rabbit atrial AP, its characteristics (such as APA, APD, RP, and maximum upstroke velocity; see Table 1) are significantly different from experimental values. The models developed in this study not only update the description of several ionic currents and, as a result the AP characteristics, in the model by Lindblad et al., but also incorporate the electrical heterogeneity of the rabbit RA.
AP rate-dependence
Experimental data on the AP rate-dependence in rabbit RA cells is limited. Yamashita et al. (18) provided AP recordings from the rabbit crista terminalis and pectinate muscle cells only at BCLs of 100 and 1000 ms, while Qi et al. (19) recorded APs from the rabbit crista terminalis at BCLs of 500 and 2000 ms. Hence, detailed restitution properties of these two cell types cannot be validated due to lack of experimental measurements. However, simulation results can be compared to experimental data for the rabbit crista terminalis cell paced at several commonly used (either fast or slow) rates. APD values measured from the experimental AP recordings (18,19) at BCLs of 100, 500, 1000, and 2000 ms were ∼70, 80, 77, and 75 ms. These are in excellent agreement with the respective values of 71.4, 79.2, 77.8, and 74.4 ms calculated from our crista terminalis cell model.
Sustained outward current
Simulations show that AP properties (primarily, APD) of the crista terminalis and pectinate muscle cells can be modulated by the sustained component of the outward current, I sus. Hence, the conductance and reversal potential of I sus in the respective models were adjusted to reproduce experimental measurements (18). Notably, while the original model of Lindblad et al. (24) implemented I sus as a background Cl− current, the modifications consider it nonselective, with a reversal potential E sus of −70 mV. In electrophysiological terms, the current can be interpreted as a sum of two separate currents, the background K+ current, I K,b, with a reversal potential of ∼−85 mV (which corresponds to the K+ equilibrium potential, E K), and the background Cl− current, I Cl,b, with a reversal potential of ∼−40 mV (Cl− equilibrium potential, E Cl).
Such consideration is valid, as the background currents are linear; hence, I sus = g sus(V–E sus) = g K,b(V–E K) + g Cl,b(V–E Cl) = (g K,b+g Cl,b)(V–(g K,b E K+g Cl,b E Cl)/(g K,b+g Cl,b)), where g sus = g K,b+g Cl,b and E sus = (g K,b E K+g Cl,b E Cl)/(g K,b+g Cl,b). Substituting numerical values for the reversal potentials gives (1+g)(–70) = (–85 + g(–40)), where g = g Cl,b/g K,b. Solving the latter equation produces the value g = 0.5 and the resulting relations g sus = 3.0g Cl,b = 1.5 g K,b. Hence, the nonselective background current defined in our model as I sus = g sus(V+70) could be a sum of two ion-specific currents, the background K+ current I K,b = (g sus/1.5)(V+85) and the background Cl− current I Cl,b = (g sus/3.0)(V+40). Note that experimental data on the ionic nature of I sus is not conclusive, and it may include both K+ and Cl− currents (31,56).
Ca2+ handling
Effects of the intracellular Ca2+ dynamics on electrical excitation in cardiac cells and tissues are well documented: they have been shown to affect cellular AP properties during AF (1), as well as alter the AP restitution leading to APD alternans and breakup of reentry into fibrillation-like states in the ventricles (51,57). Hence, although experimental data on Ca2+ handling in rabbit atrial cells is very limited, its effects should be considered.
We used the cell and tissue models either buffering the intracellular Ca2+, Na+, and K+ concentrations to constant levels (Model 1), or including two full descriptions (24,39) of Ca2+ handling and ionic concentrations (Models 2 and 3). Buffered models had several advantages:
-
1.
They allowed the avoidance of potentially artificial effects of inadequate modeling of Ca2+ dynamics and slow ion concentration drifts on electrical activity, which could arise due to lack of experimental detail in their description.
-
2.
They allowed the separation of effects of electrical heterogeneity and anisotropy of the RA (unidirectional conduction block and reentry initiation) from those arising due to the intracellular Ca2+ dynamics (self-termination of reentry).
-
3.
They were more computationally efficient, which is essential in simulating large three-dimensional tissues.
Major results produced using the latter approach—primarily, simulated AP morphologies and mechanisms of reentry generation in the RA—were validated against respective models with full Ca2+ handling and kinetic description of the intracellular Na+ and K+ concentrations (Figs. 11–13).
Differences between APs simulated with the models with either buffered (Model 1) or dynamic (Model 2 and 3) description of Ca2+ handling were minimal at slow pacing rates (Figs. 11 A and 12 A), but increased at high rates, with both Models 2 and 3 demonstrating accumulation of intracellular Ca2+ (Figs. 11 B and 12 B). Similar behavior has been observed during high-rate pacing of rabbit ventricular cells (50), but there is no experimental evidence to conclude whether such behavior can occur in the real rabbit RA. Importantly, genesis of reentry initiation after ∼300 ms of fast pacing was similar in the RA tissue models with and without Ca2+ handling (Figs. 8 and 13), and was not affected by the choice of the Ca2+ handling model. This can be explained by the fact that the AP dynamics during ∼500 ms of pacing, when the intracellular Ca2+ level has not substantially increased, did not significantly vary between the models (Figs. 11 B and 12 B). The small impact of Ca2+ handling on electrical activity in the rabbit RA in comparison to ventricular tissues (50–52) may be due to the relatively short Ca2+ transient in the rabbit atrial cell (40,41).
Hence, our simulations demonstrate that while Ca2+ dynamics may be important for sustaining reentry, it does not play a significant role in the mechanism of reentry initiation considered in this study, which is based primarily on electrical heterogeneity and anisotropy within the RA, and develops within ∼300 ms of fast pacing (Figs. 8 and 13). Experimental evidence shows that Ca2+ handling can be important in triggering ectopic focal activity in the atrium, primarily in the pulmonary vein region of the left atrium (58), but mechanisms of such ectopic activity are beyond the scope of this study.
Note also that the original model by Lindblad et al. (24) does not consider Ca2+-dependent inactivation of the L-type Ca2+ current, I Ca,L. In the absence of detailed quantitative information on I Ca,L inactivation in rabbit atrial cells, we were also unable to include a description of this phenomenon in our models. However, we considered an alternative version of our models with a description of Ca2+-dependent inactivation of I Ca,L based on the model of Shannon et al. (39) for a rabbit ventricular cell. Models with such a hybrid description of I Ca,L produced results similar to those illustrated in Fig. 13. Hence, Ca2+-dependent inactivation of I Ca,L may have little impact on APs in rabbit atrial cells; however, a more accurate description of this current will be required (subject to available experimental data) to validate such a conclusion.
Three-dimensional tissue model
This study presents three-dimensional tissue simulations of electrical excitation in the RA of the rabbit heart. This is the first model of the RA tissue incorporating detailed anatomical structure, fiber orientation, and electrical heterogeneity of distinctive regions of the crista terminalis and pectinate muscles. The presented three-dimensional model for the RA tissue distinguishes itself from other simplified (10,47) and detailed anatomical (59–61) models of atria in the following aspects: 1), finer spatial resolution and, as a result, more accurate anatomical structures; 2), inclusion of fiber orientation; and 3), more physiologically relevant cellular models and electrical heterogeneity. AP conduction patterns simulated with the model are consistent with experimental data. Primarily, the APD and activation time distributions (Figs. 9 and 10) are comparable with respective experimental measurements (see Fig. 6 in (22)) not only qualitatively, but also quantitatively. Differences between the simulations and experimental data (22) are observed mainly close to the pacing site, which can be explained by the fact that in experiments the AP was not paced, but entered the RA from the adjacent SA node.
Hence, our detailed three-dimensional model provides a potentially powerful tool for studying effects of the RA tissue anatomy on electrical activation patterns during functional impacts of physiological or pharmacological interventions.
Limitations
Limitations of cardiac cell and tissue models are well documented (2,24–26). In our single cell model development, we modified the equations for I Na, I Ca,L, I K1, I to and I sus in the model of Lindblad et al. (24) based on available experimental data (18,33,34). For other ion channels, as well as Ca2+ handling, due to the lack of experimental data concerning differences between the crista terminalis and pectinate muscle cells, we used equations and parameters from the original model of Lindblad et al. and assumed no difference between these two cell types. Note that each of the two single-cell models was used in the whole crista terminalis and pectinate muscle regions, respectively, even for cells that cannot be anatomically identified as belonging to the respective bundles. Note also that the three-dimensional anatomical tissue model is only a portion of the whole atria of the rabbit. Other anatomical structures, such as the SA node, Bachmann's bundle, valves (e.g., tricuspid valve), and orifices of blood vessels are not included in the current model, but may play a role in initiation and maintenance of atrial reentry and fibrillation.
Mechanisms of AF
AF is the most common cardiac arrhythmia. Although not fatal in itself, AF may lead to more serious conditions such as stroke, impaired cardiac output, and ventricular tachycardia. The mechanisms underlying AF are not completely understood, although functional reentry has been implicated in its initiation and maintenance (4).
Several studies described transition from periodic AP propagation into AF during rapid pacing of sheep atria (49,62). A pacing rate threshold for this transition (a breakdown frequency) was found to be ∼6.5 Hz in the sheep RA (49). AF generation was preceded by highly increased activation-time delays in both the crista terminalis and pectinate muscles, similar to our simulations (Fig. 9). Our simulations also provide a possible mechanism for such a transition from normal rhythm to AF—conduction block due to large intrinsic APD gradients between the crista terminalis and pectinate muscles, with their anisotropic bundle structure insuring that the gradients are not diminished by electrotonic interactions. Note that although the breakdown frequency for our model is higher (∼11.75 Hz), the difference can be explained by proportionally shorter APD in rabbit: 77 ms in the rabbit crista terminalis compared to ∼150 ms in the sheep (62).
The relationship between the structure of the crista terminalis and pectinate muscle bundles and conduction block leading to reentry and AF in the RA has long been recognized (11–13). Primarily, several intracardiac echocardiography studies have suggested that atrial arrhythmias are due to a functional conduction block within the crista terminalis (14–16). However, Spach et al. (6,17) showed that functional repolarization inhomogeneities interact with anisotropic discontinuous propagation to create a conduction barrier in the canine RA. Primarily, APD differences between the crista terminalis and the rest of RA were facilitated by slow conduction through the crista terminalis in the transverse direction, i.e., due to the tissue anisotropy (compare to Figs. 9 and 10). Note that enhancement of the APD gradients has also been demonstrated experimentally during conduction transverse to anisotropic bundles of ventricular tissue (63), and theoretically during conduction in a heterogeneous tissue divided by a simple geometric obstacle (9).
Interactions between tissue anisotropy and repolarization heterogeneity have also been used to explain mechanisms of micro-reentry in closed loops formed by the complex network of pectinate muscles (6). Our simulations quantify contributions of heterogeneity and anisotropy to the mechanisms of reentry initiation at high pacing rates, and demonstrate the genesis of macroscopic reentry in the entire RA tissue due to 1), the crista terminalis acting as a (functional and anatomical) conductive barrier where intrinsic APD gradients are not diminished by electrotonic interactions; and 2), pectinate muscles forming an anisotropic network of slow conductive pathways capable of sustaining circulation in the RA. Exact areas of the crista terminalis susceptible to conduction block can be localized by measuring the spatial distribution of the APD gradients in the RA tissue.
It has also been suggested that an organized distribution of AP morphology, with the longest APD near the SA node and decreasing APD along the conduction pathway into the RA (17,22), can provide a protective mechanism to ensure synchronized atrial contractions by preventing reentrant activity from entering the SA node. As shown in our simulations, only every second cycle of the atrial reentry can activate the crista terminalis (due to its longer APD and refractory period), and hence the activation frequency in the crista terminalis is half that in the rest of the RA. This result demonstrates that, paradoxically, the crista terminalis can also act as a conductive barrier protecting the adjacent SA node from sustained high-frequency excitation (such as reentry or AF) in the adjacent RA. Hence, the next step of our model development will be to include the detailed anatomy (23) and cellular electrophysiology (36) of the SA node tissue to study the interaction of the pacemaker with atrial reentry.
Acknowledgments
This work was supported by a project grant (No. BBS/B/1678X) from the Biotechnology and Biological Sciences Research Council of the United Kingdom.
Contributor Information
Mark R. Boyett, Email: mark.boyett@manchester.ac.uk.
Henggui Zhang, Email: henggui.zhang@manchester.ac.uk.
Appendix 1: Electophysiological Model Equations
General equations
Fast Na+ current
L-type Ca2+ current
T-type Ca2+ current
Transient outward K+ current
Sustained outward current
Fast delayed rectifier K+ current
Slow delayed rectifier K+ current
Inward rectifier K+ current
Na+-Ca2+ exchanger current
Na+-K+ pump current
Ca2+ pump current
Background currents
Equilibrium potentials
Appendix 2: Ionic Concentration Equations (Model 2)
Intracellular Na+ and K+ concentrations
Intracellular Ca2+ handling
Intracellular Ca2+ buffering
Appendix 3: Ionic Concentration Equations (Model 3)
Intracellular Na+ concentration
Intracellular Ca2+ handling
Intracellular Ca2+ buffering
Parameter values for all models are listed in Tables 2–4.
Table 2.
Electrophysiological model parameter values (Model 1)
| Crista terminalis | Pectinate muscle | |
|---|---|---|
| Cm | 135 pF | 40 pF |
| gNa | 0.028 × 10⁻⁶μS/pF | 0.028 × 10⁻⁶μS/pF |
| gCa,L | 144.0 × 10⁻⁶μS/pF | 168.0 × 10⁻⁶μS/pF |
| gCa,T | 120.0 × 10⁻⁶μS/pF | 120.0 × 10⁻⁶μS/pF |
| gto | 200.0 × 10⁻⁶μS/pF | 350.0 × 10⁻⁶μS/pF |
| gsus | 26.00 × 10⁻⁶μS/pF | 48.00 × 10⁻⁶μS/pF |
| gK,r | 70.00 × 10⁻⁶μS/pF | 70.00 × 10⁻⁶μS/pF |
| gK,s | 50.00 × 10⁻⁶μS/pF | 50.00 × 10⁻⁶μS/pF |
| gK1 | 203.2 × 10⁻⁶μS/pF | 302.8 × 10⁻⁶μS/pF |
| gNa,b | 0.400 × 10⁻⁶μS/pF | 0.600 × 10⁻⁶μS/pF |
| gCa,b | 0.400 × 10⁻⁶μS/pF | 0.600 × 10⁻⁶μS/pF |
| kNaCa | 0.400 × 10⁻⁶μS/pF | 0.400 × 10⁻⁶μS/pF |
| INaK | 1.288 × 10⁻³ nA/pF | 1.288 × 10⁻³ nA/pF |
| ICa,p | 190.0 × 10⁻⁶μS/pF | 190.0 × 10⁻⁶μS/pF |
| dNaCa | 0.0003 | 0.0003 |
| γNaCa | 0.4500 | 0.4500 |
| Km,Na | 11.00 mM | 11.00 mM |
| Km,K | 1.000 mM | 1.000 mM |
| Km,K1 | 0.590 mM | 0.590 mM |
| [Na+]o | 140.0 mM | 140.0 mM |
| [Ca2+]o | 2.500 mM | 2.500 mM |
| [K+]o | 5.000 mM | 5.000 mM |
| Esus | −70 mV | −70 mV |
| ECa,L | 50 mV | 50 mV |
| ECa,T | 38 mV | 38 mV |
| R | 8314 mJ/mol°C | 8314 mJ/mol°C |
| F | 96,487 C/mol | 96,487 C/mol |
| T | 35°C | 35°C |
Table 3.
Ca2+ handling parameters (Model 2)
| Voli | 12.60 pL |
| VolCa | 5.884 pL |
| Volup | 0.397 pL |
| Volrel | 0.044 pL |
| [Mg2+]i | 2.5000 mM |
| Kcy,Ca | 0.0003 mM |
| Ksr,Ca | 0.5000 mM |
| Kxcs,Ca | 0.4000 |
| KM,rel | 0.3000 μM |
| αrel | 200,000.0 pA/mM |
| Iup | 2800.0 pA |
| τtr | 0.010 s |
| krecov | 0.815 s−1 |
| Vact | 20 mV |
Table 4.
Ca2+ handling parameters (Model 3)
| Volcell | 16.503 pL |
| Volcyt | 10.727 pL |
| VolSR | 0.578 pL |
| VolSL | 0.330 pL |
| Voljct | 0.008 pL |
| [Mg2+]i | 1.000 mM |
| Vmax | 2.860 mM s−1 |
| Km,f | 0.000246 mM |
| Km,r | 1.700 mM |
| H | 1.787 |
| ks | 125,000.0 s−1 |
| kleak,SR | 0.005348 s−1 |
| MaxSR | 15.00 |
| MinSR | 1.000 |
| EC50-SR | 0.450 mM |
| ko,Ca | 10,000.0 mM−2 s−1 |
| ki,Ca | 500.0 mM s−1 |
| ko,m | 60.00 s−1 |
| ki,m | 5.000 s−1 |
References
- 1.Nattel S., Shiroshita-Takeshita A., Brundel B.J., Rivard L. Mechanisms of atrial fibrillation: lessons from animal models. Prog. Cardiovasc. Dis. 2005;48:9–28. doi: 10.1016/j.pcad.2005.06.002. [DOI] [PubMed] [Google Scholar]
- 2.Zipes D.P., Jalife J., editors. Cardiac Electrophysiology: From Cell to Bedside. Sanders; Philadelphia: 2004. [Google Scholar]
- 3.Gray R.A., Pertsov A.M., Jalife J. Spatial and temporal organization during cardiac fibrillation. Nature. 1998;392:75–78. doi: 10.1038/32164. [DOI] [PubMed] [Google Scholar]
- 4.Jalife J., Berenfeld O., Mansour M. Mother rotors and fibrillatory conduction: a mechanism of atrial fibrillation. Cardiovasc. Res. 2002;54:204–216. doi: 10.1016/s0008-6363(02)00223-7. [DOI] [PubMed] [Google Scholar]
- 5.Allessie M.A., Bonke F.I., Schopmann F.T.G. Circus movement in rabbit atrial muscle as a mechanism of tachycardia. II. The role of nonuniform recovery of excitability in the occurrence of unidirectional block studied with multiple microelectrodes. Circ. Res. 1976;39:168–177. doi: 10.1161/01.res.39.2.168. [DOI] [PubMed] [Google Scholar]
- 6.Spach M.S., Dolber P.C., Heidlage J.F. Interaction of inhomogeneities of repolarization with anisotropic propagation in dog atria: a mechanism for both preventing and initiating reentry. Circ. Res. 1989;65:1612–1631. doi: 10.1161/01.res.65.6.1612. [DOI] [PubMed] [Google Scholar]
- 7.Qu Z.L., Kil K., Xie F.G., Garfinkel A., Weiss J.N. Scroll wave dynamics in a three-dimensional cardiac tissue model: roles of restitution, thickness, and fiber rotation. Biophys. J. 2000;78:2761–2775. doi: 10.1016/S0006-3495(00)76821-4. [DOI] [PMC free article] [PubMed] [Google Scholar]
- 8.Benson A.P., Aslanidi O.V., Zhang H., Holden A.V. The canine virtual ventricles: a platform for dissecting pharmacological effects on propagating and arrhythmogenesis. Prog. Biophys. Mol. Biol. 2008;96:187–208. doi: 10.1016/j.pbiomolbio.2007.08.002. [DOI] [PubMed] [Google Scholar]
- 9.Sampson K.J., Henriquez C.S. Interplay of ionic and structural heterogeneity on functional action potential duration gradients: implications for arrhythmogenesis. Chaos. 2002;12:819–828. doi: 10.1063/1.1497735. [DOI] [PubMed] [Google Scholar]
- 10.Kuo S.R., Trayanova N.A. Action potential morphology heterogeneity in the atrium and its effect on atrial reentry: a two-dimensional and quasi-three-dimensional study. Philos. Trans. A. 2006;364:1349–1366. doi: 10.1098/rsta.2006.1776. [DOI] [PubMed] [Google Scholar]
- 11.Spach M.S., Miller W.T., Dolber P.C., Kootsey M., Sommer J.R. The functional role of structural complexities in the propagation of depolarization in the atrium of the dog: cardiac conduction disturbances due to discontinuities of effective axial resistivity. Circ. Res. 1982;50:175–191. doi: 10.1161/01.res.50.2.175. [DOI] [PubMed] [Google Scholar]
- 12.Yamashita T., Inoue H., Nozaki A., Sugimoto T. Role of anatomical architecture in sustained atrial reentry and double potentials. Am. Heart J. 1992;124:938–946. doi: 10.1016/0002-8703(92)90976-3. [DOI] [PubMed] [Google Scholar]
- 13.Ho S.Y., Anderson R.H., Sanchez-Quintana D. Atrial structure and fibers: morphologic bases of atrial conduction. Cardiovasc. Res. 2002;54:325–336. doi: 10.1016/s0008-6363(02)00226-2. [DOI] [PubMed] [Google Scholar]
- 14.Kalman J.M., Olgin J.E., Karch M.R., Hamdan M., Lee R.J. “Cristal tachycardias”: origin of right atrial tachycardias from the crista terminalis identified by intracardiac echocardiography. J. Am. Coll. Cardiol. 1998;31:451–459. doi: 10.1016/s0735-1097(97)00492-0. [DOI] [PubMed] [Google Scholar]
- 15.Schumacher B., Jung W., Schmidt H., Fischenbeck C., Lewalter T. Transverse conduction capabilities of the crista terminalis in patients with atrial flutter and atrial fibrillation. J. Am. Coll. Cardiol. 1999;34:363–373. doi: 10.1016/s0735-1097(99)00211-9. [DOI] [PubMed] [Google Scholar]
- 16.Yamabe H., Misumi I., Fukushima H., Ueno K., Kimura Y. Conduction properties of the crista terminalis and its influence on the right atrial activation sequence in patients with typical atrial flutter. Pacing Clin. Electrophysiol. 2002;25:132–141. doi: 10.1046/j.1460-9592.2002.00132.x. [DOI] [PubMed] [Google Scholar]
- 17.Spach M.S., Dolber P.C., Anderson P.A.W. Multiple regional differences in cellular properties that regulate repolarization and contraction in the right atrium of adult and newborn dogs. Circ. Res. 1989;65:1594–1611. doi: 10.1161/01.res.65.6.1594. [DOI] [PubMed] [Google Scholar]
- 18.Yamashita T., Nakajima T., Hazama H., Hamada E., Murakawa Y. Regional differences in transient outward current density and inhomogeneities of repolarization in rabbit right atrium. Circulation. 1995;92:3061–3069. doi: 10.1161/01.cir.92.10.3061. [DOI] [PubMed] [Google Scholar]
- 19.Qi A., Yueng-Lai-Wah J.A., Xiao J., Kerr C.R. Regional differences in rabbit atrial repolarization: importance of transient outward current. Am. J. Physiol. 1994;266:H643–H649. doi: 10.1152/ajpheart.1994.266.2.H643. [DOI] [PubMed] [Google Scholar]
- 20.Feng J., Yue L., Wang Z., Nattel S. Ionic mechanisms of regional action potential heterogeneity in the canine right atrium. Circ. Res. 1998;83:541–551. doi: 10.1161/01.res.83.5.541. [DOI] [PubMed] [Google Scholar]
- 21.Ramirez R., Nattel S., Courtemanche M. Mathematical analysis of canine atrial action potentials: rate, regional factors, and electrical remodeling. Am. J. Physiol. 2000;279:H1767–H1785. doi: 10.1152/ajpheart.2000.279.4.H1767. [DOI] [PubMed] [Google Scholar]
- 22.Boyett M.R., Honjo H., Yamamoto M., Nikmaram M.R., Niwa R. Downward gradient in action potential duration along conduction path in and around the sinoatrial node. Am. J. Physiol. 1999;276:H686–H698. doi: 10.1152/ajpheart.1999.276.2.H686. [DOI] [PubMed] [Google Scholar]
- 23.Dobrzynski H., Li J., Tellez J., Greener I.D., Nikolski V.P. Computer three-dimensional reconstruction of the sinoatrial node. Circulation. 2005;111:846–854. doi: 10.1161/01.CIR.0000152100.04087.DB. [DOI] [PubMed] [Google Scholar]
- 24.Lindblad D.S., Murphey C.R., Clark J.W., Giles W.R. A model of the action potential and underlying membrane currents in a rabbit atrial cell. Am. J. Physiol. 1996;271:H1666–H1696. doi: 10.1152/ajpheart.1996.271.4.H1666. [DOI] [PubMed] [Google Scholar]
- 25.Panfilov A.V., Keener J.P. Re-entry in three-dimensional Fitzhugh-Nagumo medium with rotational anisotropy. Physica D. 1995;84:545–552. [Google Scholar]
- 26.Noble D., Rudy Y. Models of cardiac ventricular action potentials: iterative interaction between experiment and simulation. Philos. Trans. A. 2001;359:1127–1142. [Google Scholar]
- 27.Giles W.R., Imaizumi Y. Comparison of potassium currents in rabbit atrial and ventricular cells. J. Physiol. 1988;405:123–145. doi: 10.1113/jphysiol.1988.sp017325. [DOI] [PMC free article] [PubMed] [Google Scholar]
- 28.Habuchi Y., Han X., Giles W.R. Comparison of the hyperpolarization-activated and delayed rectifier currents in rabbit atrioventricular and sinoatrial node. Heart Vessels. 1995;9(Suppl):203–206. [Google Scholar]
- 29.Hagiwara N., Irisawa H., Kameyama M. Contribution of two types of calcium currents to the pacemaker potentials of rabbit SA node cells. J. Physiol. 1988;395:233–253. doi: 10.1113/jphysiol.1988.sp016916. [DOI] [PMC free article] [PubMed] [Google Scholar]
- 30.Muraki K., Imaizumi Y., Watanabe M., Habuchi Y., Giles W.R. Delayed rectifier K+ current in rabbit atrial myocytes. Am. J. Physiol. 1995;269:H524–H532. doi: 10.1152/ajpheart.1995.269.2.H524. [DOI] [PubMed] [Google Scholar]
- 31.Fedida D., Giles W.R. Regional variations in action potentials and transient outward current in myocytes isolated from rabbit left ventricle. J. Physiol. 1991;442:191–209. doi: 10.1113/jphysiol.1991.sp018789. [DOI] [PMC free article] [PubMed] [Google Scholar]
- 32.Kawano S., Hiraoka M. Transient outward currents and action potential alterations in rabbit ventricular myocytes. J. Mol. Cell. Cardiol. 1991;23:681–693. doi: 10.1016/0022-2828(91)90978-u. [DOI] [PubMed] [Google Scholar]
- 33.Ko J.H., Park W.S., Earm Y.E. The protein kinase inhibitor, staurosporine, inhibits L-type Ca2+ current in rabbit atrial myocytes. Biochem. Biophys. Res. Commun. 2005;329:531–537. doi: 10.1016/j.bbrc.2005.01.156. [DOI] [PubMed] [Google Scholar]
- 34.Ko J.H., Park W.S., Kim S.J., Earm Y.E. Slowing the inactivation of voltage-dependent sodium channels by staurosporine, the protein kinase C inhibitor, in rabbit atrial myocytes. Eur. J. Pharmacol. 2006;534:48–54. doi: 10.1016/j.ejphar.2006.01.018. [DOI] [PubMed] [Google Scholar]
- 35.Honjo H., Boyett M.R., Kodama I., Toyama J. Correlation between electrical activity and the size of rabbit sino-atrial node cells. J. Physiol. 1996;496:795–808. doi: 10.1113/jphysiol.1996.sp021728. [DOI] [PMC free article] [PubMed] [Google Scholar]
- 36.Zhang H., Holden A.V., Kodama I., Honjo H., Lei M. Mathematical models of action potentials in the periphery and center of the rabbit sinoatrial node. Am. J. Physiol. 2000;279:H397–H421. doi: 10.1152/ajpheart.2000.279.1.H397. [DOI] [PubMed] [Google Scholar]
- 37.Fedida D., Shimoni Y., Giles W.R. Alpha-adrenergic modulation of the transient outward current in rabbit atrial myocytes. J. Physiol. 1990;423:257–277. doi: 10.1113/jphysiol.1990.sp018021. [DOI] [PMC free article] [PubMed] [Google Scholar]
- 38.Griffiths H., MacLeod K.T. The voltage-sensitive release mechanism of excitation contraction coupling in rabbit cardiac muscle is explained by calcium-induced calcium release. J. Gen. Physiol. 2003;121:353–373. doi: 10.1085/jgp.200208764. [DOI] [PMC free article] [PubMed] [Google Scholar]
- 39.Shannon T.R., Wang F., Puglisi J., Weber C., Bers D.M. A mathematical treatment of integrated Ca dynamics within the ventricular myocyte. Biophys. J. 2004;87:3351–3371. doi: 10.1529/biophysj.104.047449. [DOI] [PMC free article] [PubMed] [Google Scholar]
- 40.Endoh M. Muscarinic regulation of Ca2+ signaling in mammalian atrial and ventricular myocardium. Eur. J. Pharmacol. 1999;375:177–196. doi: 10.1016/s0014-2999(99)00231-9. [DOI] [PubMed] [Google Scholar]
- 41.Hilgemann D.W., Noble D. Excitation-contraction coupling and extracellular calcium transients in rabbit atrium: reconstruction of basic cellular mechanisms. Proc. R. Soc. Lond. B. Biol. Sci. 1987;230:163–205. doi: 10.1098/rspb.1987.0015. [DOI] [PubMed] [Google Scholar]
- 42.Blatter L.A., Kockskamper J., Sheehan K.A., Zima A.V., Huser J. Local calcium gradients during excitation-contraction coupling and alternans in atrial myocytes. J. Physiol. 2003;546:19–31. doi: 10.1113/jphysiol.2002.025239. [DOI] [PMC free article] [PubMed] [Google Scholar]
- 43.Woo S.-H., Cleeman L., Morad M. Ca2+ current-gated focal and local Ca2+ release in rat atrial myocytes: evidence from rapid 2-D confocal imaging. J. Physiol. 2002;543:439–453. doi: 10.1113/jphysiol.2002.024190. [DOI] [PMC free article] [PubMed] [Google Scholar]
- 44.Yamamoto M., Honjo H., Niwa R., Kodama I. Low-frequency extracellular potentials recorded from the sinoatrial node. Cardiovasc. Res. 1998;39:360–372. doi: 10.1016/s0008-6363(98)00091-1. [DOI] [PubMed] [Google Scholar]
- 45.Litchenberg W.H., Norman L.W., Holwell A.K., Martin K.L., Hewett K.W. The rate and anisotropy of impulse propagation in the postnatal terminal crest are correlated with remodeling of Cx43 gap junction pattern. Cardiovasc. Res. 2000;45:379–387. doi: 10.1016/s0008-6363(99)00363-6. [DOI] [PubMed] [Google Scholar]
- 46.de Groot J.R., Veenstra T., Verkerk A.O., Wilders R., Smits J.P. Conduction slowing by the gap junctional uncoupler carbenoxolone. Cardiovasc. Res. 2003;60:288–297. doi: 10.1016/j.cardiores.2003.07.004. [DOI] [PubMed] [Google Scholar]
- 47.Pandit S.V., Berenfeld O., Anumonwo J.M.B., Zaritski R.M., Kneller J. Ionic determinants of functional reentry in a 2-D model of human atrial cells during simulated chronic atrial fibrillation. Biophys. J. 2005;88:3806–3821. doi: 10.1529/biophysj.105.060459. [DOI] [PMC free article] [PubMed] [Google Scholar]
- 48.Simitev R.D., Biktashev V.N. Conditions for propagation and block of excitation in an asymptotic model of atrial tissue. Biophys. J. 2006;90:2258–2269. doi: 10.1529/biophysj.105.072637. [DOI] [PMC free article] [PubMed] [Google Scholar]
- 49.Berenfeld O., Zaitsev A.V., Mironov S.F., Pertsov A.M., Jalife J. Frequency-dependent breakdown of wave propagation into fibrillatory conduction across the pectinate muscle network in the isolated sheep right atrium. Circ. Res. 2002;90:1173–1180. doi: 10.1161/01.res.0000022854.95998.5c. [DOI] [PubMed] [Google Scholar]
- 50.Lakatta E.G., Guarnieri T. Spontaneous myocardial calcium oscillations: are they linked to ventricular fibrillation? J. Cardiovasc. Electrophysiol. 1993;4:473–489. doi: 10.1111/j.1540-8167.1993.tb01285.x. [DOI] [PubMed] [Google Scholar]
- 51.Chudin E., Goldhaber J., Garfinkel A., Weiss J., Kogan B. Intracellular Ca2+ dynamics and the stability of ventricular tachycardia. Biophys. J. 1999;77:2930–2941. doi: 10.1016/S0006-3495(99)77126-2. [DOI] [PMC free article] [PubMed] [Google Scholar]
- 52.Bondarenko V.E., Rasmusson R.L. Simulations of propagated mouse ventricular action potentials: effects of molecular heterogeneity. Am. J. Physiol. 2007;293:H1816–H1832. doi: 10.1152/ajpheart.00471.2007. [DOI] [PubMed] [Google Scholar]
- 53.Aslanidi O.V., Sleiman R.N., Williamson H., Boyett M.R., Zhang H. Modeling conduction through the Purkinje-ventricular junction and the short-QT syndrome associated with HERG mutation in the rabbit ventricles. IEEE Comp. Cardiol. 2007;34:241–244. [Google Scholar]
- 54.Boyett M.R., Li J., Inada S., Dobrzynski H., Schneider J.E. Imaging the heart: computer three-dimensional anatomic models of the heart. J. Electrocardiol. 2005;38:113–120. doi: 10.1016/j.jelectrocard.2005.06.102. [DOI] [PubMed] [Google Scholar]
- 55.Winslow R.L., Varghese A., Noble D., Adlakha C., Hoythya A. Generation and propagation of ectopic beats induced by spatially localized Na-K pump inhibition in atrial network models. Proc. R. Soc. Lond. B. Biol. Sci. 1993;254:55–61. doi: 10.1098/rspb.1993.0126. [DOI] [PubMed] [Google Scholar]
- 56.Duan D.Y., Fermini B., Nattel S. Sustained outward current observed after Ito1 inactivation in rabbit atrial myocytes is a novel Cl− current. Am. J. Physiol. 1992;263:H1967–H1971. doi: 10.1152/ajpheart.1992.263.6.H1967. [DOI] [PubMed] [Google Scholar]
- 57.Goldhaber J.I., Xie L.H., Duong T., Motter C., Khuu K. Action potential duration restitution and alternans in rabbit ventricular myocytes: the key role of intracellular calcium cycling. Circ. Res. 2005;96:459–466. doi: 10.1161/01.RES.0000156891.66893.83. [DOI] [PubMed] [Google Scholar]
- 58.Chou C.C., Nguyen B.L., Tan A.Y., Chang P.C., Lee H.L. Intracellular calcium dynamics and acetylcholine-induced triggered activity in the pulmonary veins of dogs with pacing-induced heart failure. Heart Rhythm. 2008;5:1170–1177. doi: 10.1016/j.hrthm.2008.04.009. [DOI] [PMC free article] [PubMed] [Google Scholar]
- 59.Harrild D., Henriquez C. A computer model of normal conduction in the human atria. Circ. Res. 2000;87:E25–E36. doi: 10.1161/01.res.87.7.e25. [DOI] [PubMed] [Google Scholar]
- 60.Seemann G., Hoper C., Sachse F.B., Dossel O., Holden A.V. Heterogeneous three-dimensional anatomical and electrophysiological model of human atria. Philos. Trans. A. 2006;364:1465–1481. doi: 10.1098/rsta.2006.1781. [DOI] [PubMed] [Google Scholar]
- 61.Virag N., Blanc O., Kappenberger L., editors. Computer Simulation and Experimental Assessment of Cardiac Electrophysiology. Futura Publishing; New York: 2001. [Google Scholar]
- 62.Gray R.A., Pertsov A.M., Jalife J. Incomplete reentry and epicardial breakthrough patterns during atrial fibrillation in the sheep heart. Circulation. 1996;94:2649–2661. doi: 10.1161/01.cir.94.10.2649. [DOI] [PubMed] [Google Scholar]
- 63.Osaka T., Kodama I., Tsuboi N., Toyama J., Yamada K. Effects of activation sequence and anisotropic cellular geometry on the repolarization phase of action potential of dog ventricular muscles. Circulation. 1987;76:226–236. doi: 10.1161/01.cir.76.1.226. [DOI] [PubMed] [Google Scholar]