

Abstract
Myosin cross-bridges play an important role in the regulation of thin-filament activation in cardiac muscle. To test the hypothesis that sarcomere length (SL) modulation of thin-filament activation by strong-binding cross-bridges underlies the Frank-Starling mechanism, we inhibited force and strong cross-bridge binding to intermediate levels with sodium vanadate (Vi). Force and stiffness varied proportionately with [Ca2+] and [Vi]. Increasing [Vi] (decreased force) reduced the pCa50 of force-[Ca2+] relations at 2.3 and 2.0 μm SL, with little effect on slope (nH). When maximum force was inhibited to ∼40%, the effects of SL on force were diminished at lower [Ca2+], whereas at higher [Ca2+] (pCa < 5.6) the relative influence of SL on force increased. In contrast, force inhibition to ∼20% significantly reduced the sensitivity of force-[Ca2+] relations to changes in both SL and myofilament lattice spacing. Strong cross-bridge binding cooperatively induced changes in cardiac troponin C structure, as measured by dichroism of 5′ iodoacetamido-tetramethylrhodamine-labeled cardiac troponin C. This apparent cooperativity was reduced at shorter SL. These data emphasize that SL and/or myofilament lattice spacing modulation of the cross-bridge component of cardiac thin-filament activation contributes to the Frank-Starling mechanism.
Introduction
The Frank-Starling relation describes the intrinsic ability of the heart to increase ventricular systolic force and stroke volume in response to increased ventricular filling in diastole. The cellular basis for this is the steep sarcomere length (SL) dependence of twitch contraction in myocytes, and underlying this is the enhanced sensitivity of the contractile apparatus to myoplasmic [Ca2+] when SL is increased (for review see Gordon et al. (1)). The mechanisms underlying SL-dependent activation of force have remained elusive, but they likely involve a complex interplay of the influences of Ca2+ and acto-myosin cross-bridge binding on thin-filament activation (for review see Fuchs and Martyn (2)). It is the purpose of this study to investigate the role that modulation of strong cross-bridge binding plays in SL dependence of contractile activation in cardiac muscle. It is important to understand the cellular and molecular mechanisms of the Frank-Starling relation because changes in the SL dependence of cardiac force may be an important component of heart failure (3).
After Ca2+ is released from intracellular stores, Ca2+ binding to the regulatory protein complex troponin (Tn) on thin filaments is the initial step in contractile activation. This allows movement of tropomyosin (Tm) on the surface of thin filaments, exposing binding sites for cross-bridges on actin. The formation of strong actin/cross-bridge interactions further activates thin filaments by contributing to the displacement of Tm into the “on” position. Thus, thin-filament activation (defined as the availability of binding sites on actin for strong acto-myosin cross-bridge binding and force) is dependent on feedback cooperative activation by cross-bridges (1,2,4). A unique additional feature of cardiac contractile activation is the ability of strong cross-bridge interaction with thin filaments to increase the Ca2+ affinity of cardiac troponin C (cTnC) (5–8). This constitutes an additional and potentially important feedback pathway for thin-filament activation by strong-binding cross-bridges. We recently proposed that length controls the sensitivity of force to myoplasmic [Ca2+] in cardiac muscle by direct modulation of cross-bridge proximity and binding to thin filaments (9,10). In this scheme, increasing myofilament lattice spacing (MFLS) at short SL decreases cross-bridge proximity to thin filaments. This reduces both the probability of strong cross-bridge binding to thin filaments and cross-bridge-induced thin-filament activation at a given myoplasmic [Ca2+] (10).
If this idea is true, then the sensitivity of cardiac force-[Ca2+] relations to SL or MFLS should depend on the size of the cross-bridge population available for strong binding, and perhaps require a minimal level of cross-bridge binding and force. To test this idea, we measured the effects of SL and MFLS on force-[Ca2+] relations in skinned right ventricular trabeculae from rat hearts when strong cross-bridge binding and force were inhibited to intermediate levels with sodium vanadate (Vi). Vi was utilized in previous studies to reveal strong cross-bridge enhancement of Ca2+ binding to cTnC and Ca2+-induced structural changes in cTnC (5–8). We recently showed that Vi inhibits force primarily by shifting the population of cycling cross-bridges toward stable weak-binding states with very slow attachment/detachment kinetics, and to detached states that contributed little to thin-filament activation (11). Thus Vi enables the population of cycling cross-bridges that contribute to thin-filament activation to be varied independently of changes in SL or MFLS. To more directly monitor the contribution of strong cross-bridge binding to thin-filament activation, we measured the relation between maximal Ca2+-activated force (Fmax) and dichroism of cTnC fluorescently labeled with 5′ iodoacetamido-tetramethylrhodamine (5′IATR) in skinned trabeculae when force was inhibited over a range of [Vi] values (7,8).
Increasing [Vi] reduced the Ca2+-sensitivity of force (pCa50) at both 2.3 and 2.0 μm SL. Force inhibition by <60% increased the SL dependence of force at both maximal activation and over a range of submaximal [Ca2+]. In contrast, force inhibition by >60% significantly reduced the SL dependence of both maximal Fmax and pCa50. At levels of inhibition that reduced SL effects on force, the sensitivity of force-[Ca2+] relations to altered MFLS was also diminished. Fluorescence measurements from (5′IATR)-labeled cTnC on cardiac thin filaments indicate that cross-bridge-induced changes in cTnC structure are cooperative, and that this apparent cooperativity is reduced at short SL compared with long SL. These results support the hypothesis that an important component of the Frank-Starling mechanism in cardiac muscle is the ability of changes in SL and/or MFLS to modulate strong cross-bridge binding to, and subsequent cooperative activation of, cardiac thin filaments.
Materials and Methods
Cardiac trabeculae preparation
Single cardiac trabeculae were prepared from male Sprague-Dawley rats (200–250 g) as described previously (7). Briefly, rats were anesthetized by an intraperitoneal injection of pentobarbital (50 mg/kg) and their hearts were removed rapidly and placed in oxygenated, physiological salt solution (in mM: 100 NaCl, 24 NaHCO3, 2.5 KCl, 1 MgS04.7H2O, 1 NaHPO4, and 1 CaCl2. Small trabeculae (100–200 μm in diameter, 1–2 mm long) were dissected from the right ventricle and their surface membranes were rendered permeable to bathing solution constituents by exposing them for 12 h at 4°C to a skinning solution containing (in mM) 100 KCl, 9.0 MgCl2, 4.0 MgATP, 5.0 K2 ethylene glycol-bis-(b-aminoethylether)-N,N,N,N-tetraacetic acid (EGTA), 10 3-(N-morpholino) propane sulfonic acid (MOPS), 1% (v/v) nonionic detergent Triton X-100, pH 7.0, and 50% (v/v) glycerol and 1% (v/v) protease inhibitor cocktail (P-8340; Sigma, St. Louis, MO). The skinned trabeculae were stored in the same solution without Triton X-100 at −20°C and used for experiments within 1 week. On average, the trabeculae dimensions were 1.43 ± 0.06 mm × 176 ± 13 μm (length × diameter; mean ± standard error (SE); n = 10).
Mechanics measurements
The ends of single trabeculae were wrapped in aluminum foil T-clips for attachment to a force transducer (model 400A, 2.2 kHz resonant frequency; Cambridge Technology, Watertown, MA) and a servomotor (model 300; Cambridge Technology) tuned for a 350 μs step response. SL was measured and adjusted under relaxing conditions using laser diffraction techniques as described previously (12). Force, length, and SL signals were low-pass filtered (fc = 40% of the sampling rate) with a CyberAmp 380 (Axon Instruments, Foster City, CA) and recorded digitally with a 12-bit resolution. All experiments were done at 15°C. Stiffness was measured by applying a 500 Hz sinusoidal length change (0.015 mL lengths) to the fiber. Stiffness was determined from the ratio of the peaks of the Fourier transforms of the force and ML signals.
Fluorescence measurements
Endogenous cTnC was extracted from skinned trabeculae and replaced with a mono-cysteine cTnC mutant cTnC(C35S) that had been labeled at Cys84 with 5′-iodoacetamide tetramethylrhodamine (5′IATR) as described previously (7,8). To monitor Ca2+ and cross-bridge-induced changes in cTnC structure, the dichroism of the 5′IATR probe was measured. Because the dichroism signal is expressed as a ratio to total fluorescence, it is much less sensitive to changes in fluorescence intensity that occur when SL is altered and the amount of fluorophore in the optical field changes. During the dichroism measurements the fiber was illuminated by an Hg vapor lamp (HBO 50/3, OSRAM GmbH, FRG) filtered at 540 ± 5 nm, and then passed through a 12% neutral density and polarizing filter oriented perpendicular to the fiber axis for excitation of 5′IATR-labeled cTnC. The polarization angle of the exciting light was sinusoidally (42 kHz) alternated parallel and perpendicular to the fiber axis by a photoelastic modulator (PEM, model 80; Hinds, Portland, OR) with the peak-to-peak retardation set to 413 nm. The light emitted after absorption by the probe (590–630 nm) was collected by the objective (NA = 0.32) and focused onto a photomultiplier tube (type R938HA; Hamamatsu, Hamamatsu City, Japan). The output of the photomultiplier was monitored with a wide band-pass current to voltage converter (−3 db @ 450 kHz). To determine the root mean-square (RMS) amplitude of the sinusoidally varying difference in fluorescence intensity parallel (I ⊥) and perpendicular (I ll) to the fiber axis, the output of the amplifier was directed to a lock-in amplifier (model 3961B; Ithaco, Ithaca, NY). Details of the apparatus and protocols are described elsewhere (7,8).
Dichroism or polarization anisotropy (r) was measured and expressed using the equation given by Tanner et al. (13) as:
where D is the RMS value of I ll − I ⊥ (from the output of the lock-in amplifier), and L is the total fluorescence (I ll + 2I ⊥). The retardation of PEM was set so that the zeroth-order Bessel function (J o) was zero. Further details of the optical measurements are described in Martyn et al. (14).
The magnitude of dichroism depends on the average orientation of the population of probes with respect to the “magic angle”, at which dichroism would be zero. Thus, an increase in dichroism could indicate either an increase in the degree of order of the population of probes or a change in average orientation of the probes, so that they become more oriented parallel to the fiber axis. Likewise, decreasing dichroism would indicate that either the average angle of the probes approached the “magic angle” or the probes became more disordered. Measurements of linear dichroism do not allow distinction between these possible mechanisms, although recent EPR measurements of maleimide-labeled TnC indicated that Ca2+ binding to TnC causes both disorder and angle changes (15), and fluorescence polarization measurements of 5′IATR cTnC(C35S) in guinea pig skinned cardiac trabeculae indicated that changes in dichroism occur primarily as a result of changes in probe angle (16).
Solutions
The solutions contained (in mM) 15 phosphocreatine, 15 EGTA, 80 MOPS, 1 Mg2+, 135 Na+ + K+, 1 dithiothreitol (DTT), 250 U mL−1 creatine kinase (CK; Sigma), and 5 mM ATP at pH 7.0 and ionic strength 0.17 M. For activation solutions, [Ca2+] (expressed as pCa = −log [Ca2+]) was varied by adding Ca2+ propionate. In a subset of experiments, Dextran T500 (4% w/v) was added to all solutions. Vi was prepared as described by Goodno (17) and added to the bathing solutions from a 100 mM stock solution.
Data analysis
Force-pCa data were fit by the Hill equation, where Fmax is the maximally activated force, n H is
the Hill coefficient or slope, and pCa50 is the pCa at which force is half-maximal. The reported pCa50 and n H values represent the means of the values from the individual fits ± SE. The means were compared with the use of Student's t-test, with significance at the 95% confidence level (p < 0.05).
Results
Effects of Vi on force and force-[Ca2+] relations
To study the role of strong cross-bridge binding in the SL dependence of cardiac force, it was necessary to determine the [Vi] necessary to achieve selected levels of force inhibition. Maximum Ca2+-activated force (pCa 4.5) was measured at 2.0 (•) and 2.3 (○) μm SL in the presence of varying Vi concentrations (0–0.3 mM) in single skinned cardiac trabeculae. The summarized data (mean ± SE) from seven trabeculae are shown in Fig. 1. Force was expressed relative to maximal Ca2+-activated force (pCa 4.5) at 2.3 μm SL in uninhibited controls. The apparent sensitivity of maximum force to Vi was greater at short SL, being inhibited to 50% of its maximum value at ∼0.06 mM Vi vs. ∼0.08 mM at longer SL.
Figure 1.
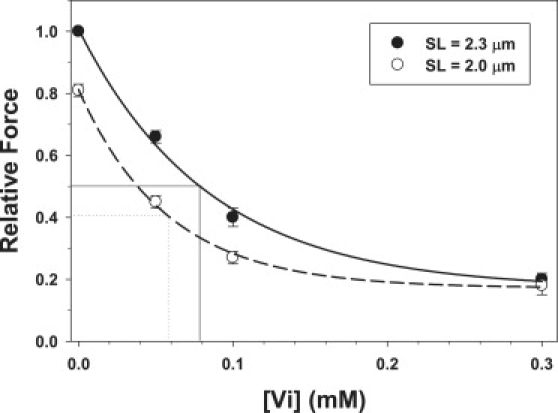
Effects of increasing [Vi] on maximum Ca2+-activated force (pCa 4.5) were obtained at 2.3 (•) and 2.0 (○)μm SL. Data (mean ± SE) were obtained from seven trabeculae. The approximate [Vi] at which maximal force was inhibited to 50% of controls (no Vi) are indicated for data obtained at 2.0 (small dotted line) and 2.3 μm SL (thin solid line), respectively.
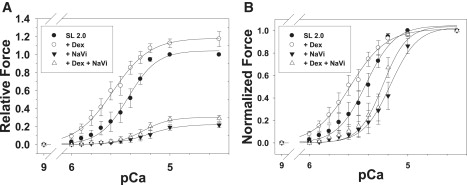
Based on the data in Fig. 1, the force-[Ca2+] relations shown in Fig. 2 were measured with 0.05, 0.10, and 0.30 mM Vi in all bathing solutions to inhibit Fmax at 2.3 μm SL to 66% (▾), 40% (▪), and 20% (♦) of controls (•; no Vi), respectively. The effects of Vi on force-[Ca2+] relations were measured at 2.3 (solid symbols) and 2.0 μm SL (open symbols). Data (mean ± SE) were obtained from nine (•), six (▴), seven (▪), and six (♦) trabeculae, and were fit with the Hill equation. The pCa50 and n H values for each condition are summarized in Table 1.
Figure 2.
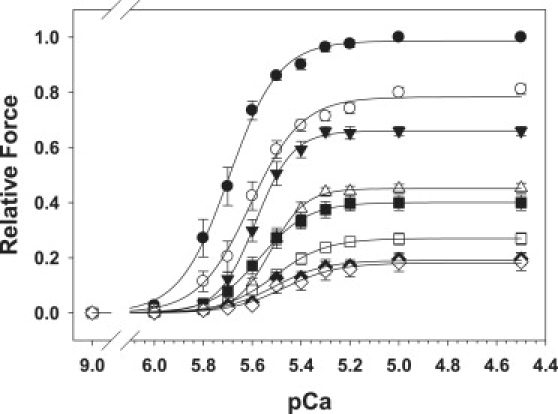
Force-[Ca2+] relations were measured at 2.0 μm (open symbols) and 2.3 μm (solid symbols) SL in the presence of zero Vi (•, ○), 0.05 (▾, ▵), 0.10 (▪, □) and 0.3 mM Vi (♦, ♢). Data (mean ± SE) for each condition were obtained from 10, 6, 7, and 6 trabeculae, respectively. The levels of force inhibition for each [Vi] and both SLs, along with the Hill fit parameters for the force-[Ca2+] relations (pCa50 and nH), are included in Table 1.
Table 1.
Summary of Vi effects on SL and MFLS dependent force-[Ca2+] relations
| [NaVi] (mM) | SL (μm) | Dex (%) | N | Fmax∗ | SEM | Fmax† ratio | SEM | nH | SEM | pCa50 | SEM | ΔpCa50‡ | SEM |
|---|---|---|---|---|---|---|---|---|---|---|---|---|---|
| 0.00 | 2.3 | 10 | 1.00 | 0.00 | 1.24 | 0.03 | 5.5 | 0.6 | 5.71 | 0.02 | 0.09 | 0.01 | |
| 2.0 | 10 | 0.81 | 0.02 | 5.5 | 0.6 | 5.62 | 0.03 | ||||||
| 0.05 | 2.3 | 6 | 0.66 | 0.02 | 1.46 | 0.04 | 6.1 | 0.5 | 5.58 | 0.01 | 0.06 | 0.01 | |
| 2.0 | 6 | 0.45 | 0.02 | 7.2 | 1.1 | 5.52 | 0.01 | ||||||
| 0.10 | 2.3 | 7 | 0.40 | 0.03 | 1.52 | 0.11 | 5.9 | 0.9 | 5.57 | 0.03 | 0.06 | 0.02 | |
| 2.0 | 7 | 0.27 | 0.02 | 5.0 | 0.2 | 5.52 | 0.03 | ||||||
| 0.30 | 2.3 | 6 | 0.20 | 0.02 | 1.14 | 0.07 | 5.4 | 1.2 | 5.52 | 0.03 | 0.04 | 0.01 | |
| 2.0 | 6 | 0.18 | 0.03 | 4.9 | 0.9 | 5.48 | 0.03 | ||||||
| 0§ | 2.0 | 4% | 8 | 1.17 | 0.08 | 1.17 | 0.08 | 3.5 | 0.6 | 5.58 | 0.06 | 0.13 | 0.06 |
| 2.0 | 8 | 1.00 | 0.00 | 5.1 | 0.6 | 5.45 | 0.06 | ||||||
| 0.30 | 2.0 | 4% | 8 | 0.29 | 0.03 | 1.39 | 0.12 | 8.6 | 1.6 | 5.29 | 0.06 | 0.08 | 0.04 |
| 2.0 | 8 | 0.22 | 0.03 | 6.7 | 1.1 | 5.20 | 0.06 |
Fmax is taken as a fraction of force at pC 4.5 and 2.3 tm SL within the same fiber.
The Fmax ratio is the ratio of maximal force (pCa 4.5) obtained at 2.3 vs. 2.0 μm SL.
ΔpCa50 is calculated from the Hill fits to data from individual trabeculae.
Data in Vi experiments and those with Dextran were obtained with different batches of animals.
Inspection of Fig. 2 suggests that increasing [Vi] and greater force inhibition had a complex effect on the SL dependence of Fmax, in addition to effects on pCa50. This is emphasized by Fig. 3, which illustrates the effect of force inhibition on the relationship of both maximal force (pCa 4.5) at long versus short SL (Fig. 3 A) and the effect of Vi on pCa50 at long and short SL (Fig. 3 B). When maximal force at 2.3 μm SL was inhibited by Vi to either ∼60% (0.05 mM Vi) or ∼40% (0.10 mM Vi) of control, the relative degree of inhibition was greater at 2.0 μm SL (Fig. 1). As a result, the ratio of maximum force at long versus short SL at 2.3–2.0 μm SL increased (Fig. 3 A), whereas absolute force decreased at both lengths (Fig. 2). In comparison, inhibition of maximal force by ∼80% (0.30 mM Vi) significantly reduced the SL dependence of Fmax. In contrast to maximal force, Fig. 3 B illustrates that increasing force inhibition decreased pCa50 of force-[Ca2+] relations at both 2.3 (•) and 2.0 (○) μm SL. In Fig. 3 B the arrows connect the pCa50 values obtained at long and short SL at the [Vi] indicated next to the arrows (mM). Whereas force inhibition decreased pCa50, the effect was maximal for both SLs at 0.05 mM Vi, with lesser decreases at higher [Vi] (Table 1). The pCa50 and n H values obtained at both SLs, along with the differences in pCa50 (ΔpCa50) obtained at each [Vi], are included in Table 1.
Figure 3.
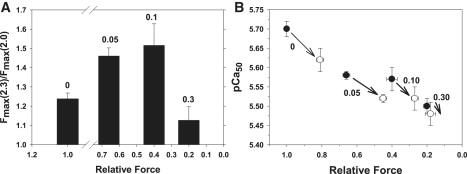
(A) To demonstrate changes in the SL dependence of maximal force (pCa 4.5) at varying degrees of force inhibition with Vi, the SL dependence of maximal force is expressed as the ratio of force obtained at 2.3 vs. 2.0 μm SL. Data were obtained from the same trabeculae as in Fig. 2. Panel B illustrates the dependence of pCa50 at 2.0 μm (○) and 2.3 μm (•) SL on the level of force inhibition by Vi; data were obtained from the same experiments as in Fig. 2. Data obtained with a long and short SL for a given [Vi] are connected by arrows, with the [Vi] indicated in mM next to each pair.
Although the data in Figs. 2 and 3 describe the effects of force inhibition by Vi on the SL dependence of maximal force and pCa50, a more complete description of the enhancement of force by increasing SL at all activating [Ca2+] and [Vi] can be obtained by subtracting the Hill fits at short SL in Fig. 2 from the corresponding curves at long SL, as we previously described (9). The resulting relationship, illustrated in Fig. 4, represents force enhancement by increasing SL over the entire force-[Ca2+] relationship. In Fig. 4 A, force enhancement is expressed as a fraction of Fmax at 2.3 μm SL in uninhibited controls, and in Fig. 4 B it is expressed relative to the maximal force obtained at 2.3 μm SL for each level of force inhibition (see figure legend). As we found in a previous study (9), the relative force increase from increasing SL was greatest at submaximal force levels (pCa 5.6–5.4), near the pCa50 at short SL for controls (Table 1). Inhibition of maximal force by ∼40% with 0.05 mM Vi induced a shift of the curves to higher [Ca2+] (consistent with decreasing pCa50 in Fig. 3) and reduced the peak of SL dependence at submaximal [Ca2+] compared with controls. At [Ca2+] above pCa 5.2, the relative effect of increasing SL on force was the same as for controls, although the absolute level of maximal force was reduced at both SLs. In addition to decreasing the apparent Ca2+ sensitivity of force (Fig. 3, Table 1), the primary effect of greater force inhibition by increasing [Vi] to 0.10 and 0.30 mM was to progressively reduce the effect of SL on force at all activating [Ca2+] (Fig. 4 A). When force was expressed as a fraction of the maximum Ca2+-activated force obtained at 2.3 μm SL for each condition (Fig. 4 B), the data indicate that increasing [Vi] from 0 to 0.30 mM not only reduced Fmax and decreased pCa50, it also reduced the effect of increasing SL on submaximal force from pCa 6.0 to ∼5.6, a range that includes the pCa50 for force-[Ca2+] relations at both SLs (Table 1). This is significant because cardiac myocytes are activated at submaximal levels under normal physiological conditions (18,19). In contrast, for [Ca2+] > pCa 5.6, relative force enhancement by increasing SL was greater with 0.05 and 0.10 mM Vi (dotted and dashed curves in Fig. 4 B). This contrasts with data obtained when force was inhibited to ∼20% of Fmax with 0.30 mM Vi (Fig. 4 B, dotted-dashed curve). In this case, force enhancement by increasing SL was significantly reduced over the full range of activating [Ca2+].
Figure 4.
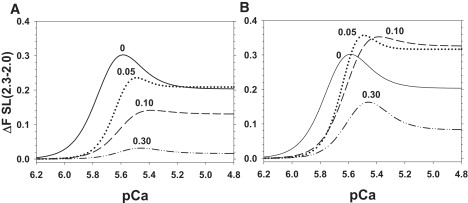
To demonstrate the enhancement of force when SL was increased from 2.0 to 2.3 μm over the full range of activating [Ca2+], the Hill fit curves to the data in Fig. 2 at 2.0 μm SL were subtracted from the curves obtained at 2.3 μm SL for 0 (solid line), 0.05 (dotted line), 0.10 (dashed line), and 0.30 (dot-dashed line) mM Vi. (A) Force is expressed relative to maximum control (pCa 4.5) at 2.3 μm SL without Vi. (B) Force is expressed relative to the maximum force obtained at 2.3 μm SL for each [Vi].
We recently showed that inhibition of maximum Ca2+-activated force with Vi was associated with decreased strong cross-bridge binding to cardiac thin filaments (11). To demonstrate that this holds true at both maximal and submaximal levels of Ca2+ activation in the absence and presence of Vi, stiffness was measured by small-amplitude (0.5% ML), 500 HZ sinusoidal oscillation of ML. Fig. 5 compares the relationship between stiffness and force at different [Ca2+] levels when SL was 2.0 μm (open symbols) and 2.3 μm (solid symbols). Stiffness and force at both SLs was expressed as a fraction of the value at pCa 4.5 at 2.3 μm SL in controls. Fmax at 2.3 μm SL was inhibited to ∼60% (Fig. 4 B) or ∼20% (Fig. 4 C) Fmax by Vi. Data (mean ± SE) were obtained from seven trabeculae. At a given level of force inhibition, stiffness and force declined in nearly direct proportion to decreasing [Ca2+]. Although increasing [Vi] inhibited force slightly more than stiffness (11), there was no significant difference between the stiffness-force relations at either SL. The results indicate that at each SL, the force and the population of strongly bound, force-generating cross-bridges decreased in roughly the same proportion with both increasing [Vi] and decreasing [Ca2+].
Figure 5.
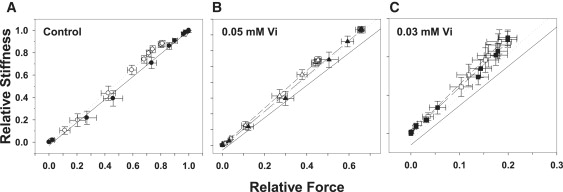
The relationship between sinusoidal stiffness and force at different [Ca2+] levels when SL was 2.3 μm (solid symbols) or 2.0 μm (open symbols) is illustrated for controls (A) and when force was inhibited by 0.05 (B) and 0.30 (C) mM Vi. In B and C the solid and dashed lines represent the stiffness-force relations in A at 2.0 and 2.3 μm SL, respectively. The force and stiffness data are scaled differently in each panel. A solid unity line is included in each panel for comparison. Data (mean ± SE) were obtained from 6 to 10 trabeculae.
We, as well as other investigators, have suggested that the altered spacing between thick and thin filaments (MFLS) that accompanies changing SL may play an important role in the mechanisms underlying the SL dependence of force in cardiac muscle (for review see Fuchs and Martyn (2)). Like increasing SL (9), decreasing MFLS at short SL by osmotic compression of trabeculae with Dextran T500 increases both Fmax and pCa50 (9,20). To test whether strong inhibition of cross-bridge binding to cardiac thin filaments can reduce the MFLS dependence of force-[Ca2+] relations, as found for the effect of SL on force (Fig. 3, Table 1), we compared the effects of adding 4% Dextran T500 on force-[Ca2+] relations at 2.0 μm SL in the absence of Vi and when maximum force was inhibited by Vi to ∼20% of control ( Fig. 6, Table 1). We found that 4% Dextran T500 caused about the same decrease in MFLS in skinned trabeculae (10) as observed when SL increased from 2.0 to 2.3 μm in intact cardiac trabeculae (21). The data (mean ± SE; n = 8 trabeculae) shown in Fig. 6 were obtained at 2.0 μm SL without Dextran (open symbols) and with 4% Dextran (closed symbols) in both controls (circles; no Vi) and when Fmax was inhibited by ∼80% by Vi (triangles). In Fig. 6 A force is expressed as a fraction of Fmax at 2.0 μm SL in controls, with no Vi. In Fig. 6 B the same data as in Fig. 6 A are shown with force is expressed as a fraction of maximum force obtained at pCa 4.5 at each SL and for each condition. The data were fit with the Hill equation, and the values of pCa50 and n H are included in Table 1 along with a comparison of the effects of Dextran on Fmax at each SL. The data in Fig. 6 and Table 1 indicate that increased pCa50 from osmotic lattice compression in controls was significantly diminished when force was inhibited to ∼20% of maximum. This supports the idea that, like SL, MFLS effects on force-[Ca2+] relations result from modulation of the population of strong-binding cross-bridges.
Figure 6.
Effect of osmotic compression with 4% Dextran T500 on force-[Ca2+] relations measured at 2.0 μm SL. In panel A, force is expressed as a fraction of Fmax at 2.3 μm SL in controls. The same data are shown in B with force expressed as a fraction of the maximum force obtained for each condition. Measurements were made in the absence (solid symbols) and presence (open symbols) of 4% Dextran T500 in controls (circles) and when force was inhibited by 0.3 mM Vi (triangles). The data were fit with the Hill equation; pCa50 and nH values are included in Table 1. Data were obtained from five trabeculae.
One interpretation of the diminished SL and MFLS dependence of force at higher [Vi] in Figs. 2–4 and 6 is that the reduction of the population of strong-binding cross-bridges and force by >60% significantly reduces or even eliminates the ability of cross-bridges to cooperatively activate cardiac thin filaments (2,11). Under these conditions, changes in SL or MFLS would be expected to have a minimal impact on the level of thin-filament activation and force. To test this idea more directly, we monitored Ca2+ and cross-bridge-induced changes in cTnC structure on thin filaments using fluorescence techniques, as we did previously (7,8). This approach is justified by the findings that strongly bound cross-bridges increase Ca2+ binding to thin filaments in cardiac muscle (22). A mono-cysteine mutant cTnC (cTnC(C35S) was labeled at Cys84 with 5′ iodoacetamido-tetramethyl rhodamine (5′IATR). Endogenous cTnC was extracted from skinned trabeculae and replaced with the cTnC(C35S) 5′IATR-labeled mutant. Changes in dichroism of the 5′IATR probe were measured to monitor alterations of cTnC structure on cardiac thin filaments. We previously showed that maximal force inhibition decreased dichroism at maximal [Ca2+] (pCa 4.5) by ∼20% (7,8). In the study presented here, we measured dichroism at pCa 4.5 at both 2.3 and 2.0 μm SL, when maximal force was inhibited at varying [Vi]. To avoid biasing, the order of SL at which data were acquired was reversed. Data (mean ± SE; n = 4) are shown in Fig. 7. In Fig. 7 A force and dichroism are compared for relaxed and maximally Ca2+-activated controls, and when force was maximally inhibited with 1.0 mM Vi. In controls, maximum Ca2+-activation increased dichroism 2.77 ± 0.03-fold compared with pCa 9.2, in accordance with our previous results (7,8). In the presence of 1.0 mM Vi, force was 5 ± 1.0% of control, and dichroism was 2.55 ± 0.03-fold greater than in relaxing solution, corresponding to a ∼13% decrease from pCa 4.5 without Vi. Stiffness and force were inhibited to the same extent by 1.0 mM Vi.
Figure 7.
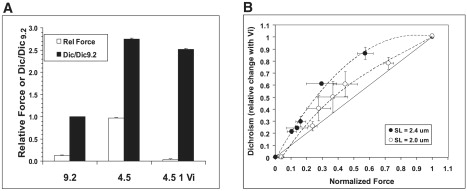
(A) Changes in force (open bars) and dichroism (solid bars) of trabeculae that contain 5′IATR-labeled cTnC(C35S) are compared in relaxing, (pCa 9.2) and maximally activating (pCa 4.5) solutions, and when force and stiffness (pCa 4.5) were maximally inhibited with 1.0 mM Vi. (B) The relative change in dichroism is plotted versus maximum force (pCa 4.5), at various levels of force inhibition with Vi (0–1.0 mM). Data (mean ± SE) were obtained from 4 trabeculae at 2.3 (•) and 2.0 (○) μm SL. The change in dichroism after force inhibition at a given [Vi] is expressed as a fraction of the difference between controls (pCa 4.5) with no Vi and dichroism at pCa 4.5 in the presence of 1.0 mM Vi (A).
Fig. 7 B illustrates the effect of increasing [Vi] and increasing force inhibition at maximal [Ca2+] (pCa 4.5) on 5′IATR-labeled cTnC(C35S) dichroism in skinned cardiac trabeculae at 2.0 (○) and 2.3 (•) μm SL. Changes in dichroism are expressed as a fraction of the difference between controls at pCa 4.5 (with no Vi) and when force was maximally inhibited with 1.0 mM Vi, and are plotted against the level of force (pCa 4.5) obtained at various [Vi] levels. The level of dichroism at pCa 9.2 (relaxing) was the same before and after inhibition of maximal force (pCa 4.5) with 1.0 mM Vi, indicating that cross-bridges “trapped” in the Vi-bound state (11) did not alter cTnC structure in the absence of Ca2+. The effect of increasing [Vi] on dichroism at pCa 4.5 differed between long and short SLs. At 2.3 μm SL increasing [Vi] decreased force at pCa 4.5 to a greater extent than dichroism, whereas at 2.0 μm SL maximal force and dichroism declined more proportionately. Increasing [Vi] inhibited force and stiffness to the same extent at both SLs (Fig. 5), indicating that changes in force were associated with a proportionate decrease in strong cross-bridge/thin-filament interactions. The greater effect of Vi on force than on activation-induced changes in cTnC structure at long SL implies that the effect of cycling cross-bridges on thin-filament activation may be cooperative. If this were not the case, the decline of dichroism with force (and stiffness) with increasing [Vi] would be more proportionate. By contrast, at short SL and increasing [Vi], dichroism decreased more linearly with force, indicating a reduction in the ability of cross-bridges to cooperatively induce changes in cTnC structure.
Discussion
The inhibition of force and strong cross-bridge binding by Vi has complex effects on the SL dependence of force-[Ca2+] relations in cardiac muscle. In a previous work (11) we argued that force inhibition by Vi was associated with a partitioning of the cross-bridge population between those with normal cycling kinetics and a subpopulation in a relatively stable Vi-bound state; the Vi-bound state exhibited weak binding to thin filaments, with very slow apparent attachment/detachment kinetics. As a result, in the presence of Vi, force likely results from a subpopulation of cross-bridges with normal cycling kinetics, the size of which can be controlled by [Vi], rather than from cross-bridges in rapid equilibrium between a number of weak- and strong-binding states (11). In this study, the Ca2+ sensitivity of force (pCa50) decreased at all levels of force inhibition. At both 2.3 and 2.0 μm SL, pCa50 decreased the most at 0.05 mM Vi, where Fmax at 2.3 um SL was reduced by ∼40%, and increasing [Vi] resulted in a smaller reduction of pCa50 at both SLs (Fig. 3 B and Table 1). Force inhibition decreased the effect of SL on pCa50 (ΔpCa50; Fig. 3 B and Table 1). To further characterize the effects of force inhibition on length-dependent activation, we described the Ca2+ dependence of the force enhancement when SL was lengthened from 2.0 to 2.3 μm at various [Vi] levels (Fig. 4). Concentrations of Vi that inhibited Fmax at longer SL by <60% resulted in greater relative force enhancement at pCa > ∼5.6 when SL was increased (Fig. 4 B). In contrast, >60% inhibition of force reduced both the SL and MFLS dependence of force at all activating [Ca2+] (Figs. 3, 4, and 6). We also observed that the ability of cycling, strong-binding cross-bridges to cooperatively activate thin filaments (indicated by cross-bridge-induced changes in cTnC structure) was reduced at 2.0 compared with 2.3 μm SL (Fig. 7). These results are discussed in the context of the ability of strong-binding cross-bridges to cooperatively activate cardiac thin filaments, thereby contributing to length-dependent activation and the Frank-Starling mechanism.
Cooperative thin-filament activation by cross-bridges
In striated muscle, Ca2+ binding to the Ca2+-binding subunit of Tn (TnC) is the initial event that leads to movement of Tm on the thin-filament surface, thereby allowing the transition of cross-bridges from weak-binding to strong-binding, force-producing states. Strong-binding cross-bridges further displace Tm into the activating position, exposing additional strong-binding sites on actin (1,4). Recent structural evidence indicates that even in the absence of Ca2+, thin filaments exist in an equilibrium between Tm positions that block or allow initial weak cross-bridge binding, and that Ca2+ binding to Tn favors displacement of Tm partially toward the activating position (23). Thus, biochemical and structural studies substantiate the need for both Ca2+ binding by Tn and subsequent strong cross-bridge/thin-filament interaction to activate thin filaments in both skeletal and cardiac muscle (1,4). We recently suggested that thin-filament activation is submaximal in cardiac muscle, even at saturating [Ca2+] (24). This idea is supported by structural studies of isolated cTnC (25,26), isolated thin filaments (27), and force measurements from single regulated thin filaments that were reconstituted with cardiac Tn (28). The implied lower capacity of Ca2+ binding to activate cardiac thin filaments may make the level of thin-filament activation particularly sensitive to modulation of the cross-bridge component of activation by changes in SL and/or MFLS. Furthermore, a unique feature of cardiac muscle is the ability of strong-binding, force-generating cross-bridges to increase Ca2+ binding to cTnC (Fig. 7) (5–8). This constitutes an additional and potentially important feedback pathway for thin-filament activation by cross-bridges in the presence of Ca2+. Thus, the steep SL dependence of force in cardiac muscle could result from both the diminished capability of Ca2+ to activate thin filaments and the ability of SL/MFLS to modulate strong cross-bridge binding and the cooperative contribution of strong cross-bridges to thin-filament activation.
Effects of SL and MFLS on thin-filament activation by strong cross-bridges
If the central thesis is correct (i.e., that the SL dependence of activation results from SL and MFLS modulation of strong cross-bridge binding and allosteric activation of cardiac thin filaments by cross-bridges), inhibition of strong cross-bridge binding should mimic the decreased Ca2+ sensitivity of force observed when SL is decreased or MFLS increased. In support of this idea, we found that increasing [Vi] and inhibition of strong cross-bridge/thin-filament interaction (Fig. 5) decreased pCa50 (Figs. 2 and 3 B, Table 1). Furthermore, increasing [Vi] decreased the dependence of force-[Ca2+] relations on SL (Figs. 2–4) and MFLS (Fig. 6). The latter seems at odds with other interventions, such as lower pH and elevated phosphate (of which Vi is an analog), that also inhibit cardiac force (29). Fukuda et al. (29) showed that the SL dependence of pCa50 increased with lower pH and elevated [Pi]. However, force inhibition by both H+ and elevated [Pi] likely differs from inhibition by Vi because both H+ and Pi may be in rapid equilibrium with the entire cross-bridge population, particularly in the case of Pi (30). This may contrast with Vi, where force generation likely results from cross-bridges with no Vi-bound, whereas the remainder are in a stable, weak-binding state (11). This idea is supported by a comparison of chord stiffness measurements that demonstrated a shift of the stiffness-stretch rate relation toward higher stretch rates and implied faster cross-bridge kinetics with elevated Pi, whereas Vi increased stiffness only at low stretch rates (11). On the other hand, our results are compatible those of Fukuda et al. (29) when force enhancement by increasing SL over the entire force-[Ca2+] relation is considered. For example, at intermediate levels of force inhibition that compare with those at pH 6.2 and 20 mM Pi (29), the relative enhancement of force with increasing SL at pCa > 5.6 was greater than in uninhibited controls (Fig. 4 B; discussed below).
Increasing [Vi] not only decreased pCa50, it also altered the SL dependence of Fmax (Fig. 3 A). When force was inhibited to ∼66% (0.05 mM Vi) and ∼40% (0.1 mM Vi) Fmax at 2.3 μm SL, the ratio of maximal force at long versus short SL (Fmax2.3/Fmax2.0) increased, reflecting relatively greater inhibition at short SL at a given [Vi] (Fig. 1). Further inhibition of Fmax to 20% reduced the effect of SL on Fmax. Because [Ca2+] was maximal, these results suggest that the SL dependence of Fmax was not the result of altered myofilament overlap alone. A possible explanation is that at intermediate [Vi] and reduction of the cycling cross-bridge population, the sensitivity of thin-filament activation to SL- or MFLS-induced changes in cross-bridge binding was enhanced. On the other hand, when the cross-bridge population is reduced to ∼20% at 0.30 mM Vi, cross-bridges may not contribute significantly to thin-filament activation, reducing any influence changes in SL or MFLS may have on force at saturating [Ca2+].
Several additional lines of evidence support the idea that the dependence of thin-filament activation state on strong cross-bridge binding likely underlies increased pCa50 and Fmax when SL increases or MFLS decreases, as observed by us (Figs. 2 and 3, Table 1) and many others (1,2). For example, the SL dependence of force-[Ca2+] relations decreased whether strong cross-bridge binding was enhanced by lowering [ATP] (9) or increasing [ADP] (31). Addition of strong, noncycling cross-bridges (exogenous NEM subfragment 1) likewise leads to elevated thin-filament activation and reduced SL dependence of cardiac force (32). Similarly, when skeletal muscle myofibrils are submaximally activated by elevated [MgADP] without Ca2+, increasing SL over a range that decreased myofilament overlap, and decreased MFLS both enhanced force (33). In contrast, at higher [MgADP] and greater activation, increasing SL caused force to decrease with decreasing myofilament overlap. The enhancement of force by increasing SL (and decreasing MFLS) at submaximal activation by MgADP-bound cross-bridges, despite decreasing filament overlap, was attributed to increased cross-bridge proximity and binding to thin filaments, leading to greater activation (33). Thus, conditions that increase cross-bridge binding to thin filaments tend to reduce the effects of SL or MFLS on force in both skeletal and cardiac muscle. Of interest, reduction in the SL dependence of force is not restricted to conditions that increase strong cross-bridge binding. Lowered ionic strength (34) and temperature (35) both favor an increased population of weak-binding cross-bridge states (10) and reduce the SL dependence of force. This implies that when weak cross-bridge binding is enhanced, changes in SL or MFLS induce much smaller relative changes in initial weak binding. Furthermore, we demonstrated that decreasing MFLS enhanced “weak” cross-bridge/thin-filament interaction in skinned cardiac trabeculae (10). These data led to the suggestion that changes in SL or MFLS may modulate force in the presence of Ca2+ by controlling the probability of the initial weak-binding cross-bridge state (2). On the other hand, there is some controversy regarding whether SL-dependent changes in MFLS modulate force-[Ca2+] relations in cardiac muscle (36), although more recent evidence indicates that MFLS may modulate the Ca2+ sensitivity of cardiac force (37). This important issue was recently reviewed (2).
Although elevated populations of weak- or strong-binding states reduce the length dependence of activation, we found that reduction of the population of cycling cross-bridges by more than ∼60% of maximal also reduced the effects of SL (Fig. 2, 3 B, 4) and MFLS (Fig. 6) on cardiac force-[Ca2+] relations. This is consistent with the idea that when force and cross-bridge binding are inhibited to this level, the contribution of cycling, strongly bound cross-bridges to cooperatively activate cardiac thin filaments is reduced to the extent that changes in SL or MFLS will result in little or no change in thin-filament activation. Although both enhancement of strong cross-bridge/thin-filament interaction and inhibition of cross-bridge binding by Vi decrease the SL dependence of cardiac force-[Ca2+] relations, there is an important difference. Enhancement of strong cross-bridge/thin-filament interaction by NEM-S1, elevated ADP, or low ATP reduced SL effects on force-[Ca2+] relations by predominantly increasing pCa50 at short SL, with little effect at longer SL. In contrast, the data in Fig. 3 B and Table 1 indicate that increasing [Vi] (0–0.30 mM) decreased pCa50 more at the longer SL (0.19 vs. 0.14 pCa units). Thus the effect of Vi on pCa50 was greatest when the population of cycling cross-bridges was largest and contributing significantly to thin-filament activation. In contrast, at short SL and with less strong cross-bridge binding, the smaller effect of Vi on pCa50 could reflect a reduction of the cross-bridge component of activation. Under these conditions, activation could depend primarily on Ca2+ binding to cTnC, which has been shown to be unaffected by SL or MFLS in cardiac muscle when force is inhibited (5–7,22).
Evidence for cooperative thin-filament activation by strong cross-bridges
The idea that the ability of strong cross-bridges to cooperatively activate cardiac thin filaments depends on the size of the cycling cross-bridge population is supported by the fluorescence data in Fig. 7. When relating the data in Fig. 7 to reduced SL dependence of force at the highest [Vi] (Figs. 2 and 3), one should consider that peak myoplasmic [Ca2+] is submaximal in intact cardiac myocytes (18). The proportional decrease in force and stiffness when [Ca2+] decreases in skinned trabeculae (Fig. 5) suggests that in myocytes the population of cycling bridges is likewise reduced. At this submaximal level of strong cross-bridge binding, further reduction of the cross-bridge population from decreasing SL (increasing MFLS) could reduce thin-filament activation by cross-bridges, further contributing to a steep decrease in activation and force. Inhibition of maximal force with 1 mM Vi caused dichroism to decrease by ∼14% of the difference between relaxed (pCa 9.2) and maximal Ca2+ activation (pCa 4.5) (Fig. 7 A). Although this difference was small, the sensitivity of the 5′IATR probe to structural changes induced by Ca2+ binding to cTnC site II, or to those induced by strong cross-bridge binding to thin filaments, may not be the same. This makes it difficult to attribute the change of dichroism with 1 mM Vi to a specific change in the thin-filament activation state. However, at 2.3 μm SL, inhibition of strong cross-bridge binding caused less change in the degree of cTnC structural perturbation than force and stiffness (Fig. 5), indicating that thin-filament activation by cross-bridges was cooperative. If this were not the case, and each strong cross-bridge made an equivalent contribution to thin-filament activation, the component of cTnC structural change induced by strong cross-bridges should have declined in direct proportion to reduced force and stiffness with increasing [Vi]. Of interest, at short SL, dichroism and force declined more proportionately with increasing [Vi]. This is consistent with the idea that at short SL and reduced force, the population of cycling cross-bridges at a given [Vi] fell below the level needed to sustain cooperative thin-filament activation, contributing to the steep decline in force at the shorter SL.
The apparent effects of force inhibition on cTnC structure are in stark contrast to skeletal fibers, where changes in SL or inhibition of force do not alter the relationship between free [Ca2+] and either Ca2+ bound to thin filaments (6,38) or Ca2+-induced changes in TnC structure (7). This observation does not indicate that skeletal thin-filament activation is insensitive to strong cross-bridge binding, just that it is not associated with increased Ca2+ binding to skeletal TnC. Further, cardiac force-[Ca2+] relations are more sensitive to SL than skeletal fibers (39). We have proposed that the ability of force-generating cross-bridges to enhance Ca2+ binding to cTnC increases the sensitivity of cardiac thin-filament activation to SL- and/or MFLS-induced changes in strong cross-bridge binding. One could speculate that the molecular basis of this sensitivity resides in thin-filament regulatory protein isoform differences between cardiac and skeletal muscle. For example, the smaller “opening” of the N-terminal domain of cTnC in response to Ca2+ binding to the single Ca2+ regulatory site (25,40) compared with a much larger response to Ca2+ binding to the two regulatory sites on skeletal TnC (41) may contribute to the greater apparent dependence of cardiac thin-filament activation on cross-bridges. Additionally, important differences between the skeletal and cardiac isoforms of TnI or TnT could determine the relative sensitivity of the interaction between TnC and TnI to strong cross-bridge binding during Ca2+ activation. These ideas are speculative and require experimental validation.
The fluorescent data in Fig. 7 and the slope (n H) of cardiac force-[Ca2+] relations suggest that the processes underlying thin-filament activation and force generation are cooperative. On the other hand, n H was not significantly altered by changes in SL or force inhibition with Vi (Table 1). This observation is consistent with other studies (9,42) and suggests that the apparent cooperativity of cardiac force-[Ca2+] relations (n H) was not influenced by the size of the strong cross-bridge population. This lack of sensitivity of n H to changes in SL or altered cross-bridge binding is difficult to explain and beyond the scope of this study. However, it is likely that multiple interactions determine n H in both skeletal and cardiac muscle. These interactions could include strong cross-bridge enhancement of cTnC affinity for Ca2+, spread of activation between adjacent thin-filament regulatory units, Tm displacement, and spread of activation from strong cross-bridges and potential cross-bridge/cross-bridge interactions. Further, the properties of Tn subunits and/or Tm may contribute to n H. Supporting this complexity are observations that disruption of thin-filament regulatory unit interaction decreased both pCa50 and n H in skeletal fibers (43), whereas similar experiments with cardiac muscle did not significantly alter the slope of force-[Ca2+] relations (44).
Taken together, the results indicate that when the cycling population of cross-bridges is large enough to support cooperative activation of cardiac thin filaments (Fig. 7), changes in cross-bridge binding from alteration of SL or MFLS have a significant impact on the Ca2+ sensitivity (pCa50) of cardiac force. Thus, a minimal cycling cross-bridge population may be necessary during contraction to maintain the steep SL dependence of force and the Frank-Starling mechanism in cardiac muscle.
Effects of intermediate force inhibition on SL-dependent activation
When the effects of SL on force are considered over the full range of activating [Ca2+], as illustrated in Fig. 4, the results indicate that force inhibition reduces the absolute difference in force at 2.0 and 2.3 μm SL, particularly at submaximal [Ca2+] (Fig. 4 A). However, when the data are normalized to maximum force at long SL for each [Vi] (Fig. 4 B), force inhibition to 60% and 40% of control reduced the effect of increasing SL on force at lower [Ca2+] (pCa > 5.6), but resulted in greater force enhancement at higher [Ca2+] than in controls (Fig. 4 B). In contrast, when maximal force at long SL was inhibited to ∼20% of control, the influence of SL on force at all activating [Ca2+] was significantly reduced (Fig. 4 B). A possible explanation for these results is that, to maintain the SL or MFLS dependence of force, cardiac thin filaments are “tuned” to require both Ca2+ binding to cTnC and allosteric, cooperative activation by cross-bridges to achieve a given level of activation, even at unphysiological saturating [Ca2+] (Fig. 3 A). Under these conditions, SL- and MFLS-induced changes in the probability of cross-bridge/thin-filament interaction would have a maximal impact on thin-filament activation and force. This idea offers a potential explanation for the enhanced effect of SL on force at higher [Ca2+] (pCa < 5.6) in skinned trabeculae when Fmax is inhibited by 40% and 60%, as well as for the significant reduction in SL sensitivity that results when force is further inhibited (Fig. 4 B). In the first case, thin-filament response to Ca2+ and strong cross-bridge binding is tuned such that an intermediate reduction of strong cross-bridge binding, whether from reduced activating [Ca2+] or a reduction in SL (increased MFLS), further sensitizes thin-filament activation to changes in strong cross-bridge binding. This implies that the properties of the thin-filament regulatory components are such that cardiac activation is maintained within a range that is submaximal for force generation but maximally sensitive to modulation of the cross-bridge component of activation by altered SL or MFLS. On the other hand, if the population of cycling cross-bridges falls by more than ∼60%, the cross-bridge component of activation is diminished to the point that small changes in binding from altered SL or MFLS will have little effect on activation, leading to a reduction or loss of the Frank-Starling mechanism.
These results emphasize the complex nature of thin-filament activation in cardiac muscle and support the idea that length, via the accompanying changes in MFLS, modulates force and the Ca2+ sensitivity of force by regulating the probability of cooperative thin-filament activation by cross-bridges. Furthermore, in cardiac muscle the level of thin-filament activation from Ca2+ binding to Tn and strong-binding cross-bridges may be tuned to promote the steep SL dependence of contractile force that allows the heart to function as an adaptive pump that is responsive to changes in venous return and metabolic demand.
Acknowledgments
We thank Drs. Albert Gordon and Franklin Fuchs for helpful comments on the manuscript, and Martha Mathiason and Dr. Charles Lou for expert technical assistance.
This research was supported by grants from the National Institutes of Health (67071 to D.A.M. and 65497 to M.R.).
References
- 1.Gordon A.M., Homsher E., Regnier M. Regulation of contraction in striated muscle. Physiol. Rev. 2000;80:853–924. doi: 10.1152/physrev.2000.80.2.853. [DOI] [PubMed] [Google Scholar]
- 2.Fuchs F., Martyn D.A. Length-dependent activation in cardiac muscle: some remaining questions. J. Muscle Res. Cell Motil. 2005;26:199–212. doi: 10.1007/s10974-005-9011-z. [DOI] [PubMed] [Google Scholar]
- 3.Schwinger R.H., Bohm M., Koch A., Schmidt U., Morano I. The failing human heart is unable to use the Frank-Starling mechanism. Circ. Res. 1994;74:959–969. doi: 10.1161/01.res.74.5.959. [DOI] [PubMed] [Google Scholar]
- 4.Lehrer S.S., Geeves M.A. The muscle thin filament as a classical cooperative/allosteric regulatory system. J. Mol. Biol. 1998;277:1081–1089. doi: 10.1006/jmbi.1998.1654. [DOI] [PubMed] [Google Scholar]
- 5.Hofmann P.A., Fuchs F. Evidence for a force-dependent component of calcium binding to cardiac troponin C. Am. J. Physiol. 1987;253:C541–C546. doi: 10.1152/ajpcell.1987.253.4.C541. [DOI] [PubMed] [Google Scholar]
- 6.Wang Y.P., Fuchs F. Length, force, and Ca(2+)-troponin C affinity in cardiac and slow skeletal muscle. Am. J. Physiol. 1994;266:C1077–C1082. doi: 10.1152/ajpcell.1994.266.4.C1077. [DOI] [PubMed] [Google Scholar]
- 7.Martyn D.A., Gordon A.M. Influence of length on force and activation-dependent changes in troponin C structure in skinned cardiac and fast skeletal muscle. Biophys. J. 2001;80:2798–2808. doi: 10.1016/S0006-3495(01)76247-9. [DOI] [PMC free article] [PubMed] [Google Scholar]
- 8.Martyn D.A., Regnier M., Xu D., Gordon A.M. Ca2+ and crossbridge dependent changes in N- and C-terminal structure of troponin C in rat cardiac muscle. Biophys. J. 2001;80:360–370. doi: 10.1016/S0006-3495(01)76020-1. [DOI] [PMC free article] [PubMed] [Google Scholar]
- 9.Adhikari B.B., Regnier M., Rivera A.J., Kreutziger K.L., Martyn D.A. Cardiac length dependence of force and force redevelopment kinetics with altered crossbridge cycling. Biophys. J. 2004;87:1784–1794. doi: 10.1529/biophysj.103.039131. [DOI] [PMC free article] [PubMed] [Google Scholar]
- 10.Martyn D.A., Adhikari B.B., Regnier M., Gu J., Xu S. Response of equatorial x-ray reflections and stiffness to altered sarcomere length and myofilament lattice spacing in relaxed skinned cardiac muscle. Biophys. J. 2004;86:1002–1011. doi: 10.1016/S0006-3495(04)74175-2. [DOI] [PMC free article] [PubMed] [Google Scholar]
- 11.Martyn D.A., Smith L., Kreutziger K.L., Xu S., Yu L.C. The effects of force inhibition by sodium vanadate on cross-bridge binding, force redevelopment, and Ca2+-activation in cardiac muscle. Biophys. J. 2007;92:1–12. doi: 10.1529/biophysj.106.096768. [DOI] [PMC free article] [PubMed] [Google Scholar]
- 12.Chase P.B., Martyn D.A., Hannon J.D. Activation dependence and kinetics of force and stiffness inhibition by aluminiofluoride, a slowly dissociating analogue of inorganic phosphate, in chemically skinned fibres from rabbit psoas muscle. J. Muscle Res. Cell Motil. 1994;15:119–129. doi: 10.1007/BF00130423. [DOI] [PubMed] [Google Scholar]
- 13.Tanner J.W., Thomas D.D., Goldman Y.E. Transients in orientation of a fluorescent cross-bridge probe following photolysis of caged nucleotides in skeletal muscle fibres. J. Mol. Biol. 1992;223:185–203. doi: 10.1016/0022-2836(92)90725-y. [DOI] [PubMed] [Google Scholar]
- 14.Martyn D.A., Freitag C.J., Chase P.B., Gordon A.M. Ca2+ and crossbridge induced changes in troponin C in skinned skeletal muscle fibers: effects of force inhibition. Biophys. J. 1999;76:1480–1493. doi: 10.1016/S0006-3495(99)77308-X. [DOI] [PMC free article] [PubMed] [Google Scholar]
- 15.Li H.-C., Fajer P.G. Orientational changes of troponin C associated with thin filament activation. Biochem. J. 1994;33:14324–14332. doi: 10.1021/bi00251a046. [DOI] [PubMed] [Google Scholar]
- 16.Bell M.G., Lankford E.B., Gonye G.E., Ellis-Davos G.C.R., Martyn D.A. Kinetics of cardiac thin-filament activation probed by fluuorescence polarization of rhodamine-labeled troponin-C in skinned guinea pig trabeculae. Biophys. J. 2006;90:531–543. doi: 10.1529/biophysj.105.072769. [DOI] [PMC free article] [PubMed] [Google Scholar]
- 17.Goodno C.C. Myosin active-site trapping with vanadate ion. Methods Enzymol. 1982;85:116–123. doi: 10.1016/0076-6879(82)85014-3. [DOI] [PubMed] [Google Scholar]
- 18.Fabiato A. Myoplasmic free calcium concentration reached during the twitch of an intact isolated cardiac cell and during calcium-induced release of calcium from the sarcoplasmic reticulum of a skinned cardiac cell from the adult rat or rabbit ventricle. J. Gen. Physiol. 1981;78:457–497. doi: 10.1085/jgp.78.5.457. [DOI] [PMC free article] [PubMed] [Google Scholar]
- 19.Allen D.G., Kentish J.C. Calcium concentration in the myoplasm of skinned ferret ventricular muscle following changes in muscle length. J. Physiol. 1988;407:489–503. doi: 10.1113/jphysiol.1988.sp017427. [DOI] [PMC free article] [PubMed] [Google Scholar]
- 20.Wang Y., Fuchs F. Interfilament spacing, Ca2+ sensitivity, and Ca2+ binding in skinned bovine cardiac muscle. J. Muscle Res. Cell Motil. 2001;22:251–257. doi: 10.1023/a:1012298921684. [DOI] [PubMed] [Google Scholar]
- 21.Irving T.C., Konhilas J., Perry D., Fischetti R., de Tombe P.P. Myofilament lattice spacing as a function of sarcomere length in isolated rat myocardium. Am. J. Physiol. 2000;279:H2568–H2573. doi: 10.1152/ajpheart.2000.279.5.H2568. [DOI] [PubMed] [Google Scholar]
- 22.Hofmann P.A., Fuchs F. Effect of length and cross-bridge attachment on Ca2+ binding to cardiac troponin C. Am. J. Physiol. 1987;253:C90–C96. doi: 10.1152/ajpcell.1987.253.1.C90. [DOI] [PubMed] [Google Scholar]
- 23.Pirani A., Xu C., Hatch V., Craig R., Tobacman L.S. Single particle analysis of relaxed and activated muscle thin filaments. J. Mol. Biol. 2005;346:761–772. doi: 10.1016/j.jmb.2004.12.013. [DOI] [PubMed] [Google Scholar]
- 24.Regnier M., Martin H., Barsotti R.J., Martyn D.A., Clemmens E.W. Crossbridge vs. thin filament contributions to the level and rate of force development in cardiac muscle. Biophys. J. 2004;87:1815–1824. doi: 10.1529/biophysj.103.039123. [DOI] [PMC free article] [PubMed] [Google Scholar]
- 25.Spyracopoulos L., Li M.X., Sia S.K., Gagné S.M., Chandra M. Calcium-induced structural transition in the regulatory domain of human cardiac troponin C. Biochemistry. 1997;36:12138–12146. doi: 10.1021/bi971223d. [DOI] [PubMed] [Google Scholar]
- 26.Li M.X., Spyracopoulos L., Sykes B.D. Binding of cardiac troponin-I147–163 induces a structural opening in human cardiac troponin C. Biochemistry. 1999;38:8289–8298. doi: 10.1021/bi9901679. [DOI] [PubMed] [Google Scholar]
- 27.Lehman W., Rosol M., Tobacman L.S., Craig R. Troponin organization on relaxed and activated thin filaments revealed by electron microscopy and three-dimensional reconstruction. J. Mol. Biol. 2001;307:739–744. doi: 10.1006/jmbi.2001.4514. [DOI] [PubMed] [Google Scholar]
- 28.Warner-Clemmens E., Entazari M., Martyn D.A., Regnier M. Different effects of cardiac vs. skeletal muscle regulatory proteins on in vitro measures of actin filament speed and force. J. Physiol. 2005;566:737–746. doi: 10.1113/jphysiol.2005.084194. [DOI] [PMC free article] [PubMed] [Google Scholar]
- 29.Fukuda N., O-Uchi J., Sasaki D., Kajiwara H., Ishiwata S. Acidosis or inorganic phosphate enhances the length dependence of tension in rat skinned cardiac muscle. J. Physiol. 2001;536:153–160. doi: 10.1111/j.1469-7793.2001.00153.x. [DOI] [PMC free article] [PubMed] [Google Scholar]
- 30.Webb M.R., Hibberd M.G., Goldman Y.E., Trentham D.R. Oxygen exchange between Pi in the medium and water during ATP hydrolysis mediated by skinned fibers from rabbit skeletal muscle: evidence for Pi binding to a force-generating state. J. Biol. Chem. 1986;261:15557–15564. [PubMed] [Google Scholar]
- 31.Fukuda N., Kajiwara H., Ishiwata S., Kurihara S. Effects of MgADP on length dependence of tension generation in skinned rat cardiac muscle. Circ. Res. 2000;86:E1–E6. doi: 10.1161/01.res.86.1.e1. [DOI] [PubMed] [Google Scholar]
- 32.Fitzsimons D.P., Moss R.L. Strong binding of myosin modulates length-dependent Ca2+ activation of rat ventricular myocytes. Circ. Res. 1998;83:602–607. doi: 10.1161/01.res.83.6.602. [DOI] [PubMed] [Google Scholar]
- 33.Shimamoto Y., Kono F., Suzuki M., Ishiwata S. Nonlinear force-length relationship in the ADP-induced contraction of skeletal myofibrils. Biophys. J. 2007;93:4330–4331. doi: 10.1529/biophysj.107.110650. [DOI] [PMC free article] [PubMed] [Google Scholar]
- 34.Smith S.H., Fuchs F. Effect of ionic strength on length-dependent Ca(2+) activation in skinned cardiac muscle. J. Mol. Cell. Cardiol. 1999;31:2115–2125. doi: 10.1006/jmcc.1999.1043. [DOI] [PubMed] [Google Scholar]
- 35.Martyn D.A., Smith L. The temperature dependence of length-dependent activation in cardiac muscle. Biophys. J. 2005;88:120a. [Google Scholar]
- 36.Konhilas J.P., Irving T.C., de Tombe P.P. Myofilament calcium sensitivity in skinned rat cardiac trabeculae: role of interfilament spacing. Circ. Res. 2002;90:59–65. doi: 10.1161/hh0102.102269. [DOI] [PubMed] [Google Scholar]
- 37.Farman G.P., Walker J.S., de Tombe P.P., Irving T.C. Impact of osmotic compression on sarcomere structure and myofilament calcium sensitivity in isolated rat myocardium. Am. J. Physiol. Heart Circ. Physiol. 2006;291:H1847–H1855. doi: 10.1152/ajpheart.01237.2005. [DOI] [PubMed] [Google Scholar]
- 38.Fuchs F., Wang Y.P. Force, length, and Ca(2+)-troponin C affinity in skeletal muscle. Am. J. Physiol. 1991;261:C787–C792. doi: 10.1152/ajpcell.1991.261.5.C787. [DOI] [PubMed] [Google Scholar]
- 39.Konhilas J.P., Irving T.C., de Tombe P.P. Length-dependent activation in three striated muscle types of the rat. J. Physiol. 2002;544:225–236. doi: 10.1113/jphysiol.2002.024505. [DOI] [PMC free article] [PubMed] [Google Scholar]
- 40.Sia S.K., Li M.X., Spyracopoulos L., Gagne S.M., Liu W. Structure of cardiac muscle troponin C unexpectedly reveals a closed regulatory domain. J. Biol. Chem. 1997;272:18216–18221. doi: 10.1074/jbc.272.29.18216. [DOI] [PubMed] [Google Scholar]
- 41.Strynadka N.C., Cherney M., Sielecki A.R., Li M.X., Smillie L.B. Structural details of a calcium-induced molecular switch: X-ray crystallographic analysis of the calcium-saturated N-terminal domain of troponin C at 1.75 A resolution. J. Mol. Biol. 1997;273:238–255. doi: 10.1006/jmbi.1997.1257. [DOI] [PubMed] [Google Scholar]
- 42.Dobesh D.P., Konhilas J.P., de Tombe P.P. Cooperative activation in cardiac muscle: impact of sarcomere length. Am. J. Physiol. Heart Circ. Physiol. 2002;282:H1055–H1062. doi: 10.1152/ajpheart.00667.2001. [DOI] [PubMed] [Google Scholar]
- 43.Regnier M., Rivera A.J., Wang C.K., Bates M.A., Chase P.B. Thin filament near-neighbour regulatory unit interactions affect rabbit skeletal muscle steady-state force-Ca(2+) relations. J. Physiol. 2002;540:485–497. doi: 10.1113/jphysiol.2001.013179. [DOI] [PMC free article] [PubMed] [Google Scholar]
- 44.Gillis T.E., Martyn D.A., Rivera A.J., Regnier M. Investigation of thin filament near-neighbor regulatory unit interactions during force development in skinned cardiac and skeletal muscle. J. Physiol. 2007;580:561–576. doi: 10.1113/jphysiol.2007.128975. [DOI] [PMC free article] [PubMed] [Google Scholar]