

Abstract
We report on the application of surface plasmon resonance (SPR), based on Fourier transform infrared spectroscopy in the mid-infrared wavelength range, for real-time and label-free sensing of transferrin-induced endocytic processes in human melanoma cells. The evanescent field of the mid-infrared surface plasmon penetrates deep into the cell, allowing highly sensitive SPR measurements of dynamic processes occurring at significant cellular depths. We monitored in real-time, infrared reflectivity spectra in the SPR regime from living cells exposed to human transferrin (Tfn). We show that although fluorescence microscopy measures primarily Tfn accumulation in recycling endosomes located deep in the cell's cytoplasm, the SPR technique measures mainly Tfn-mediated formation of early endocytic organelles located in close proximity to the plasma membrane. Our SPR and fluorescence data are very well described by a kinetic model of Tfn endocytosis, suggested previously in similar cell systems. Hence, our SPR data provide further support to the rather controversial ability of Tfn to stimulate its own endocytosis. Our analysis also yields what we believe is novel information on the role of membrane cholesterol in modulating the kinetics of endocytic vesicle biogenesis and consumption.
Introduction
All hydrophilic drugs, including protein drugs, must at some point interact with the plasma membrane as a biological barrier to be traversed en route to their target, e.g., the cell cytoplasm. A major route by which these molecules may access the cell interior is endocytosis. Therefore, a significant challenge for modern pharmacological science is to develop new technologies capable of real-time monitoring of protein trafficking into living cells. These technologies may greatly assist the development of novel strategies aiming at increasing the efficacy of protein drugs' internalization into cells, and accordingly increasing their potency as therapeutic agents to treat human diseases (see Bareford and Swaan (1) and Watson et al. (2) for reviews).
Iron is an essential nutrient that participates in numerous biological processes, primarily as a cofactor in enzymes that perform electron oxidation-reduction reactions. Transferrin (Tfn) is an important iron carrier in the body, and nearly all extracellular iron is bound to Tfn. Cellular capture of Tfn is mediated primarily by the Tfn receptor (TfnR), which is internalized via clathrin-mediated endocytosis. Recently, the Tfn endocytic pathway has been exploited for mediating delivery of therapeutic drugs, peptides, proteins, and even genes into malignant tissues and cells (3). This underscores the importance of studying the endocytic pathway of Tfn.
The TfnR has been traditionally thought to be a constitutively endocytosing receptor, i.e., a receptor whose endocytosis is not dependent on the presence of ligand. Although the empty receptor is indeed efficiently internalized via clathrin-coated pits, accumulating evidence suggests that Tfn binding may regulate certain aspects of the TfnR endocytic pathway. First, Tfn addition stimulates TfnR internalization (4); second, time-resolved capacitance measurements suggest that cell exposure to Tfn stimulates the production of endocytic vesicles (5–7); third, Tfn stabilizes the assembly, growth, and budding of clathrin-coated pits (8). Hence, the mechanism by which Tfn affects its own endocytosis definitely merits further investigation.
We reported previously that the surface plasmon resonance (SPR) in the near infrared (IR) wavelength range can be used for real-time sensing of the cell membrane cholesterol contents (9). The surface plasmon (SP) is an electromagnetic wave that propagates along a metal-dielectric interface and decays exponentially in a direction perpendicular to the interface, E = E0exp(−kzz)cos(kxx), where kz and kx stand for wave vectors in z and x directions (10,11). SPR applications for bioanalysis continue to grow (12,13) In the visible and near-IR range, the penetration depth, δz, of the SP wave is very small (δz = 0.2–0.5 μm), thus limiting the ability of SPR to detect processes occurring close to cell-substrate contact sites. Recently, we have extended the SP technology to the mid-infrared (mid-IR) wavelength range (14), using a Fourier transform infrared spectrometer (FTIR). Because δz ∼ λ2 (15), the extension to longer wavelengths enables deeper penetration of the SP field into the cell, thus allowing the sensing of dynamic processes taking place in significant portions of the cell. Because Tfn internalization via the clathrin-coated pits pathway is well characterized, and because this pathway is significant for Tfn delivery into cells for therapeutic purposes, we decided to test the ability of the FTIR-SPR in the mid-IR to sense endocytic processes mediated by Tfn bound to its cell surface receptor. In this study, we chose the wavelength λ = 2.26 μm. At this wavelength, the SP penetration depth (δz = 1.6 μm (15)) is large enough to enable detection of endocytic-related processes taking place not only at the cell's plasma membrane, but also deeper in the cytoplasm.
We found that FTIR-SPR in the mid-IR can detect, in real-time, endocytic processes related to Tfn-induced formation of early endocytic vesicles. Our SPR results correlate with independent time-resolved capacitance data (5–7), suggesting that the SP wave indeed senses Tfn-induced generation of endocytic carriers. Novel information was obtained about the cholesterol dependent dynamics of endocytic vesicle formation and consumption, e.g., by recycling back to the plasma membrane. To the best of our knowledge, our work reports for the first time that the FTIR-SPR can serve as a tool for real-time and label-free sensing of endocytic processes in living cells.
Materials and Methods
FTIR-SPR measurements
Experimental setup
Surface plasmon was excited using Kretchmann's geometry (see Fig. S1 A in the Supporting Material). A Bruker FTIR spectrometer (Equinox 55, Bruker Optik GmbH, Ettlingen, Germany), equipped with a KBr beam splitter, served as the mid-IR source. A right-angle ZnS prism (20 × 40 mm base; ISP Optics, Irvington, NY) was coated with an 18-nm-thick gold film, using electron-beam evaporation. Cells were cultured on the gold surface, as described below. The prism and cells were attached to a flow chamber mounted on a goniometer, in such a way that the cells on the gold-coated surface faced the flow chamber's volume (0.5 mL). The flow chamber was filled with cell growth medium, resulting in direct contact between the medium and the cells. The growth medium was held at the temperature equal to that of the flow cell. It was passed through the chamber at a constant flow rate (5 μL/min) during the entire experiment, using a motorized bee syringe pump equipped with a variable speed controller. The infrared light from the output window of the FTIR instrument passed through a collimator, consisting of a 1-mm diameter pinhole mounted between two gold-coated off-axis parabolic mirrors with focal lengths of 76.2 mm and 25.4 mm, correspondingly. The collimated beam of 4 mm in diameter was passed through a grid polarizer and iris, reflected from the ZnS prism, and focused by an additional parabolic mirror onto a liquid-nitrogen-cooled MCT (HgCdTe) detector. We measured SPR reflectivity spectra, and monitored time dependence of the reflected beam intensity at a fixed wavelength (2.26 μm).
Cell culture preparation for SPR measurements
Human melanoma (MEL 1106) cells were cultured on a 10-cm diameter dish in Dolbecco's modified Eagle's medium (DMEM, Biological Industries, Beit Haemek, Israel), supplemented with 4.5 g/L D-glucose, 10% antibiotics, and 10% fetal calf serum, as described previously for HeLa cells (9). For SPR experiments, we cultured these cells on Au-coated prisms as follows: on reaching 70% confluence, cells were detached from the dish by trypsin C (0.05% Trypsin/EDTA in Puck's saline A; Biological Industries) treatment, and brought to a cell density of ∼1.8 × 10⁵ cells/ml in complete growth medium. Three milliliters of cell suspension were seeded on top of the Au-coated ZnS prism mounted in the home-made polycarbonate holder (Fig. S1 B), and as a result the cell suspension completely covered the prism's base. Cells were allowed to attach for at least 3 h in the CO2 incubator (5% CO2, 37°C, 90% humidity). Thereafter, growth medium (5 mL) was added, and the prism was placed in a CO2 incubator for another 2 days until a uniform and nearly confluent cell monolayer (∼30 cells per 1000 μm2) covered the Au-surface (Fig. S1 C). Quantitative immunoblotting analysis, using the H68.4 anti-human TfnR monoclonal antibodies (16,17), showed similar levels of the ∼90-kDa protein band corresponding to the molecular mass of the human TfnR in HeLa (cervical carcinoma cells), A431 (epidermoid carcinoma cells), and the melanoma cell-lines (Fig. S3). Because the human melanoma cells grew more consistently as a uniform and tight monolayer on the gold film, these cells were chosen as the experimental cell system for our studies.
SPR measurements and analysis
In the initial phase of each experiment, cells cultured on a gold-coated prism were exposed to serum-free DMEM for 3 h at 37°C to deplete the cells of internal pools of Tfn contributed by the serum. The prism with cells was then attached to the flow chamber, which was rapidly filled with prewarmed (37°C) minimal essential medium (MEM) containing Hank's salts (Biological Industries), 20 mM Hepes, pH 7.2, and 5 μg/mL BSA (MEM-BSA). The temperature in the flow chamber was adjusted to 37°C ± 0.1°C, unless otherwise indicated.
Thereafter, the angle of incidence in our SPR configuration was set to θ = 35.5°. Measurements at this angle yielded an SPR reflectivity minimum at λ = 2.34 μm (ν = 4280 cm−1; Fig. 1, inset). Our studies were carried out close to this wavelength, i.e., at λ = 2.26 μm (ν = 4225 cm−1), whereby the sensitivity (S = ΔR/Δn) is maximal. The SPR signal is the ratio of the reflectivities obtained for p- and s-polarized incident beams. The FTIR setup measured the reflectivity spectra every 25 s with a 4-cm−1 wavenumber resolution and with 16-scan averaging. These measurements were carried out continuously for 15–20 min, during which the MEM-BSA flow rate was 5 μL/min, until a stable SPR signal was recorded. Then, 2 mL of MEM buffer containing 5 μg/mL of Tfn were introduced into the flow chamber. This step was carried out at higher flow rate (500 μL/min). In the next step, the flow rate was reduced back to 5 μL/min. SPR measurements were carried out continuously throughout all the indicated stages. At the end of each experiment, the prism was examined under the microscope for cell monolayer integrity.
Figure 1.
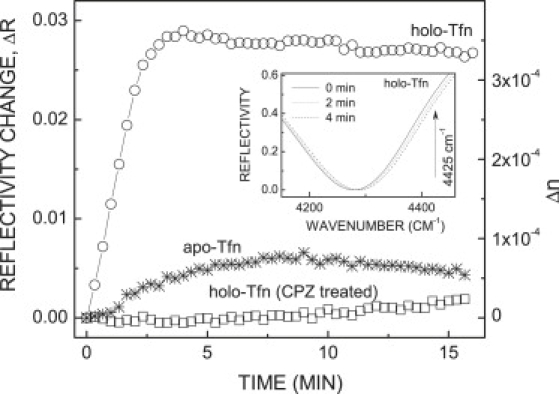
Kinetics of the SPR signal change after exposure of human melanoma cells to Tfn. Human melanoma cells cultured on a gold-coated ZnS prism were exposed to holo-Tfn (circles), apo-Tfn (stars), or first treated with CPZ followed by washout with plain MEM/BSA and then treated with holo-Tfn (squares). Time-resolved reflectivity in the SPR regime was recorded for each experiment independently. Left vertical scale shows reflectivity change at 4425 cm−1 (λ = 2.26 μm). Right vertical scale shows corresponding refractive index variation. The inset shows reflectivity spectrum as measured by FTIR. Note progressive blue shift of the SPR minimum after introduction of holo-Tfn. SPR minimum is achieved at 4280 cm−1 and the maximal reflectivity change occurs at 4425 cm−1 (marked with an arrow).
Fig. S2 shows changes in the SPR reflectivity spectra recorded from a gold-coated prism, without cells (Fig. S2, dashed line) or with a cell layer (Fig. S2, solid line). The presence of cells shifts the SPR minimum to a longer wavelength, because the refractive index of cells exceeds that of the growth medium. Representative SPR signals obtained for melanoma cell monolayers exposed to holo-Tfn at 37°C and monitored at three different time points are presented in the inset of Fig. 1. The reflectivity minimum shifts toward shorter wavelengths over time due to variation of the refractive index of the medium sensed by the SPR. All subsequent results are presented as changes in reflectivity R over time [ΔR|ν = R(t0)|ν − R(t)|ν], measured at a specific wavenumber ν = 4425 cm−1 (Fig. 1, inset, indicated by an arrow). Δn was calculated using the expression: Δn = ΔR|ν /S(ν), where S(ν) = δR/δn is the SPR sensitivity. Specifically, S(ν = 4425 cm−1) ≈ 80 RIU−1 (refractive index units) (14).
Preparation of holo- and apo-Tfn
Human apo-Tfn (Biological Industries, Beit Haemek, Israel) was loaded with iron as described (18). The apo-Tfn was extensively dialyzed against 35 mM sodium citrate, pH 5.0, to remove possible iron traces from the commercial product. The protein was then dialyzed against 20 mM Hepes, 150 mM NaCl, pH 7.4, and used as apo-Tfn in the SPR experiments. All samples were aliquoted and frozen at −70°C.
Preparation of lissamine rhodamine apo-Tfn
Apo-Tfn was tagged with lissamine rhodamine (sulforhodamine B sulfonyl chloride), as described (19). Briefly, human Apo-Tfn (4 mg/mL dissolved in 25 mM Na2CO3, 75 mM NaHCO3, pH 9.8), was incubated at 5°C overnight with 1 mM lissamine rhodamine sulfonyl chloride (Molecular Probes, Eugene, OR), and the labeled protein was isolated by gel filtration on Sepharose G25 (Sigma-Aldrich, St. Louis, MO) pre-equilibrated with 150 mM NaCl, 20 mM MES, pH 5.3. The sample was then dialyzed against Hepes buffer, and aliquots were stored at −20°C.
Cholesterol depletion and enrichment
Acute cholesterol depletion and enrichment of cells was achieved by treating the melanoma cells with methyl-β-cyclodextrin (mβCD, C-4555; Sigma, St. Louis, MO) or mβCD loaded with cholesterol (mβCD-chol), as described previously (9). Importantly, mβCD does not penetrate into the plasma membrane or intracellular membranes. Hence, the agent extracts cholesterol primarily from the plasma membrane and possibly from juxtaposed organelles (e.g., early endosomes) that constantly communicate with that membrane. Cholesterol levels were determined biochemically on cells cultured at ∼70% confluence, using the Infinity cholesterol reagent kit (402-20; Sigma). Cholesterol levels were normalized to cellular protein levels determined by the bicinchoninic acid protein assay (Pierce Biotechnology, Rockford, IL).
Time-lapse imaging of fluorescently tagged-Tfn uptake
Melanoma cells were cultured to ∼50% confluence on Glass Bottom Culture dishes (35 mm dish, 14 mm Microwell; MatTek, Ashland, MA). Cells were first exposed to growth medium lacking serum for 3 h before the experiment, and then washed three times with internalization buffer (150 mM NaCl, 20 mM Hepes, pH 7.4, 1 mM CaCl2, 5 mM KCl, 1 mM MgCl2, 10 mM glucose). After the last wash, internalization buffer containing 0.1 μM sulforhodamine green (SRG) (Biotium, Hayward, CA) was added to the medium. Cells were imaged with an Olympus FV-1000 confocal microscope equipped with an on-scope incubator (Life Image Services, Basel, Switzerland), which controls temperature and humidity, and provides an atmosphere of 5% CO2. A 60×/NA = 1.35 oil immersion objective was used. Because the anionic SRG does not enter intact cells, the cells appear as dark objects against a uniform fluorescent background when imaged with the confocal microscope. First, one plane of focus was acquired, and then Rhodamine Red-holo Tfn (5 μg/mL; Jackson ImmunoResearch, West Grove, PA) was introduced into the imaging buffer. Confocal images of both the SRG (Ex: 514 nm; Em: 535–565 nm) and Rhodamine Red holo-Tfn (Ex: 543 nm; Em: 560–660 nm) were acquired from the same section every 10 or 20 s. A similar protocol was used for lissamine rhodamine apo-Tfn, except that the SRG was imaged using 488-nm excitation and a 505–525-nm emission filter. The FV1000 was equipped with the Zero Drift Controller option, to maintain the same focus plane throughout the entire period of imaging. The images were processed using ImageJ (National Institutes of Health, Bethesda, MD) as follows. First, the despeckle filter (essentially a median filter with a 3 × 3 kernel) was applied to remove point noise. The SRG image was used to determine the cell boundaries. Then, the average fluorescence intensity inside the cells (F(t)intracellular) was divided by the average fluorescence intensity in a region of interest outside the cells (〈F(t)〉extracellular), i.e., fluorescence signal is Ifluo = F(t)intracellular/F(t)extracellular This procedure was adopted based on the assumption that there is insignificant depletion of labeled Tfn in the medium, so that the fluorescence in the medium should remain constant. The original time lapse sequences are provided in Movie S1, Movie S2, Movie S3, Movie S4, Movie S5, and Movie S6. The ImageJ macros that were used to process the data are available on request from the authors.
Results
FTIR-SPR measurements on cells exposed to holo-Tfn detect small, but significant SPR shifts
Cells cultured on the Au-coated ZnS prism were exposed to holo-Tfn, and SPR measurements were conducted as described above. Cells exposed to the ligand at 37°C exhibited time-dependent shifts of the SPR minimum toward shorter wavelengths (“blue-shift”). The signal rapidly increased for ∼2–3 min (t1/2 = 1.6 min), and leveled-off for the remaining measurement time (Fig. 1, circles). Addition of Tfn to the cell-free Au-coated prism had a negligible effect on the SPR signal.
Because apo-Tfn has low binding affinity to the TfnR, this ligand should not be taken up by cells (confirmed by time-lapse microscopy, see below), we expected to observe minimal SPR shifts, if at all, on cell exposure to the ligand. Indeed, compared with holo-Tfn, the SPR signal observed in response to apo-Tfn treatment was very small (Fig. 1, stars). This small change might be caused by residual Fe-loaded ligand in the apo-Tfn. Taken together, these results suggest that FTIR-SPR measurements sense a dynamic event evoked in response to cell exposure to holo-Tfn. Because receptor-mediated endocytosis via clathrin-coated pits is the main portal of Tfn entry into cells, we reasoned that this process contributed to the observed changes in the SPR signal. Then, saturation of the SPR signal after 4 min of holo-Tfn uptake could represent a steady-state between two balancing membrane trafficking events: ligand-induced endocytosis and recycling back to the plasma membrane.
Chlorpromazine treatment diminishes the Tfn-induced SPR signal
The cationic amphiphilic drug chlorpromazine (CPZ) inhibits clathrin coat assembly and transferrin internalization (20). To examine the effects of CPZ on holo-Tfn uptake, cells cultured on an Au/ZnS prism were first exposed to MEM/BSA containing 10 μM CPZ at 37°C for 20 min, then CPZ was washed out with plain MEM/BSA. We waited for 30 min until a stable SPR signal was obtained, and then a typical Tfn uptake experiment was carried out. The results showed that under these conditions, the SPR signal did not respond to Tfn, and remained essentially constant during the measurement time (Fig. 1, squares). These results suggest that endocytic processes potentially induced by cell exposure to Tfn were inhibited by CPZ treatment.
To confirm the effects of CPZ on Tfn endocytosis by an independent method, we used fluorescence time-lapse microscopy to record in real-time the internalization of Rhodamine Red-Tfn at 37°C into live melanoma cells, as described in Materials and Methods. Briefly, cells cultured on glass coverslips were exposed to fluorescently labeled holo or apo-Tfn, or first treated with CPZ followed by 30 min of drug washout, and then exposed to the holo ligand. Representative confocal images taken from a single focal plane of Movie S1, Movie S2, and Movie S3 are shown in Fig. 2 A upper, middle, and lower panels, correspondingly. Quantitative analysis of the accumulation of Rhodamine Red fluorescence within a confined cell area (Fig. 2 C) was carried out as described in Materials and Methods, and the results are shown in Fig. 2 B. Apo-Tfn accumulated within the cells at significantly lower efficacy than holo-Tfn. CPZ treatment severely inhibited holo-Tfn uptake into the cells. These results correlate nicely with SPR data presented in Fig. 1, suggesting that SPR indeed sensed an endocytic process.
Figure 2.
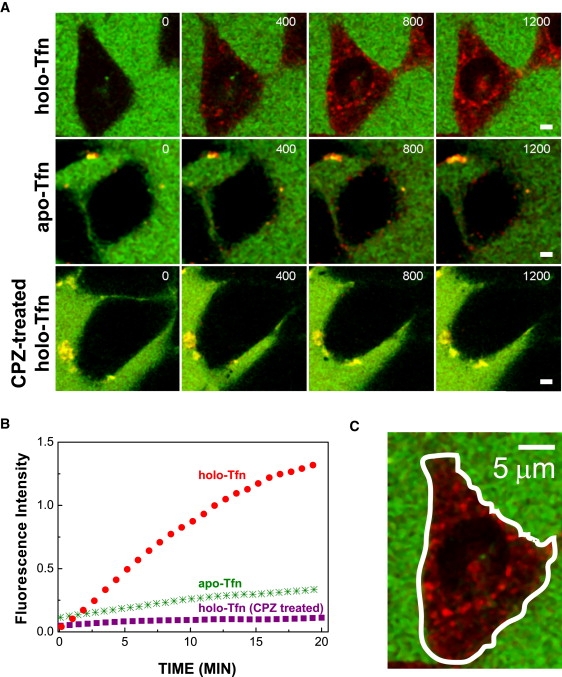
Real-time fluorescence imaging of Rhodamine Red Tfn endocytosis. (A) Time lapse imaging. Cells cultured on glass coverslips were either exposed to Rhodamine Red holo-Tfn, lissamine rhodamine apo-Tfn, or first treated with CPZ followed by washout with plain MEM/BSA and then treated with Rhodamine Red holo-Tfn. Confocal imaging of live cells was carried out simultaneously in the green and red channels. The measurements started ∼30 s after cell exposure to the ligand. Representative images taken at different measurement times (indicated in s at each frame) in a specific focal plane, where the red fluorescence was maximal, are shown. The images, which were selected from the respective Movie S1, Movie S2, and Movie S3, were processed by contrast enhancement, using ImageJ software. Scale bar = 5 μm. (B) Quantitative analysis. The intracellular fluorescence intensity of Tfn recorded from at least five different cells in each case was averaged and normalized to the extracellular background. The intracellular accumulation of holo and apo-Tfn in melanoma cells, and of holo-Tfn in CPZ-treated cells is shown. (C) Representative image. The image shows how an area of interest (solid white line), basically defined by SRG delineating the cell boundaries at a particular optical section, was chosen for the fluorescence quantitative analyses of Tfn internalization. Scale bar = 5 μm.
Tfn-induced shifts in the SPR signal is diminished at lower temperatures
It is well known that the efficacy of clathrin-coated pits-mediated endocytosis is significantly reduced at temperatures below 37°C, and is nearly blocked at temperatures below 20°C (16). Consistent with this, our SPR measurements showed negligible SPR variation in response to cell exposure to holo-Tfn at 19°C; a larger variation at 30°C and maximal variation at 37°C (Fig. 3 A). Time-lapse fluorescence imaging of cells exposed to Rhodamine Red-holo-Tfn also showed reduced ligand internalization rates at lower temperatures (Fig. 3 B; Movie S4). This strong temperature dependence of Tfn endocytosis is consistent with previous observations on mammalian cells (16), which demonstrated that endocytosis via clathrin-coated pits is a thermally-activated process with an activation energy of ∼16 kcal/mol at 30–37°C.
Figure 3.

Effects of temperature on Tfn-induced SPR variation and real-time fluorescence measurements of Tfn uptake. (A) SPR measurements. Measurements were carried out as in Fig. 1. The half-life times (t1/2) of kinetics measured at 37°C and 30°C are 1.6 and 6.6 min, respectively. The process measured at 19°C is practically arrested. (B) Time-lapse fluorescence imaging measurements. Rhodamine Red holo-Tfn fluorescence accumulation at 37°C or 23°C was monitored as described in Fig. 2.
Tfn-induced variations in the SPR and fluorescence signals are cholesterol-dependent
Previous data have shown that plasma membrane cholesterol depletion by mβCD treatment significantly diminishes the rate of clathrin-mediated endocytosis of various receptors, including the TfnR but has no apparent effect on Tfn recycling (17,21). The effects of cholesterol depletion were studied by the SPR technique. Cells cultured on an Au-coated ZnS prism were exposed to mβCD, as described (9). The agent was rapidly removed by rinsing with plain MEM/BSA. Holo-Tfn was then introduced into the flow chamber and SPR measurements were conducted at 37°C.
The SPR variation was smaller (ΔR = 0.01) in mβCD-treated (Fig. 4 A, squares) than in untreated cells (ΔR = 0.03; Fig. 4 A, circles). In contrast, cholesterol-enriched cells showed higher SPR saturation levels (ΔR = 0.04, Fig. 4 A, triangles). To emphasize the effect of altered cholesterol levels on the kinetics of the Tfn-induced SPR variations, we normalized the data of Fig. 4 A, ΔR/ΔRsaturation, and plotted the results in Fig. 4 B. It is clearly seen that not only the magnitude (shown in Fig. 4 A), but also the shape of the kinetic curve (Fig. 4 B), is affected strongly by alterations in membrane cholesterol levels.
Figure 4.
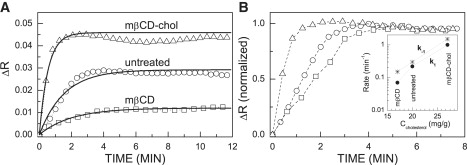
Kinetics of the Tfn-induced SPR reflectivity variation in human melanoma cells. Cells were grown on Au-coated ZnS prism. They were either untreated (circles), or subjected to cholesterol depletion by treatment with mβCD (rectangles), or cholesterol enriched by exposure to cholesterol complexed with mβCD (triangles). Cholesterol level was determined as described in Materials and Methods. (A) Raw data. Experimental data are indicated by the symbols. Solid lines are the fit to Eq. 3. (B) Normalized data. ΔR/ΔRsaturation. The dashed lines connect between the symbols. The inset describes the dependence of rate constants on cellular cholesterol levels.
In contrast to SPR measurements, the fluorescence measurements showed slower and sigmoidal kinetics of Tfn uptake (Fig. 5 A, see Movie S5 and Movie S6). To emphasize the effects of altered cholesterol levels on the kinetics of the Tfn-induced fluorescence intensity variations, we again normalized the experimental data of Fig. 5 A, Ifluo(t)/Ifluo (t = 20 min), and plotted the results in Fig. 5 B. Although the magnitude of the Tfn-induced fluorescence intensity variation depends on the alterations in membrane cholesterol levels (Fig. 5 A), the shape of the kinetic curve is virtually unaffected (Fig. 5 B).
Figure 5.
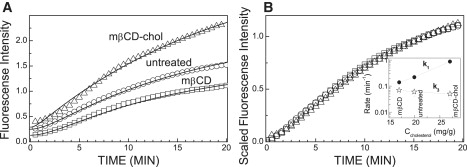
Kinetics of fluorescently labeled Tfn uptake into human melanoma cells. The cells were grown on glass coverslips and were either untreated (circles), or subjected to cholesterol depletion by treatment with mβCD (rectangles), or cholesterol enriched by exposure to cholesterol complexed with mβCD (triangles). Cholesterol levels were determined as described in Materials and Methods. (A) Raw data. Experimental data are indicated by the symbols. Solid lines are the fit to Eq. 4 using rate constants k−1 + k2 obtained from the SPR measurements. (B) Normalized data, Ifluo(t)/Ifluo(t = 20 min). The inset shows dependence of rate constants on cholesterol level in the plasma membrane. The lines connect between the symbols. The inset describes the dependence of rate constants on cellular cholesterol levels.
Discussion
The FTIR-SPR senses Tfn-induced formation of early endocytic vesicles
The SPR technique measures the refractive index of a cell layer with high precision. On cell exposure to holo-Tfn, we observed a blue shift of the SPR resonance, corresponding to a decrease of the average refractive index of the cell layer by Δn = −4 × 10⁻⁴. Changes in the refractive index were significantly smaller, |Δn| < 1 × 10⁻⁴, when cells were treated with apo-Tfn, or when endocytosis was severely arrested by CPZ treatment (Fig. 1).
Which endocytic process does the FTIR-SPR sense? We rule out the possibility that SPR measures the mere internalization of Tfn molecules. Exposure of a cell-free Au-coated prism to 5 μg/mL of holo-Tfn dissolved in water resulted in a very small refractive index increase by Δn = +2 × 10⁻⁶. It would be then reasonable to predict that the entrance and accumulation of a fraction of these molecules into cells via clathrin-mediated endocytosis would only increase the ligand concentration, and consequently the refractive index of the cells. However, our SPR measurements showed a strong decrease in the refractive index, suggesting that the SPR does not directly sense ligand accumulation within the cells.
We propose that the SPR senses Tfn-induced formation of early endocytic (EE) vesicles, which occupy cytoplasmic regions close to the cell surface (see Fig. 7). This argument is based on the following considerations/observations:
-
1.
Similarity to capacitance measurements. The kinetics of Tfn-induced capacitance changes in HeLa cells (6,7) is strikingly similar to the kinetics of Tfn-induced SPR change in human melanoma cells (Fig. 6). The capacitance technique measures changes in the plasma membrane surface area. The endocytic vesicles are derived from the cell surface and therefore decrease the area of that surface (5). Therefore, the capacitance experiments sense indirectly the production of endocytic vesicles stimulated by Tfn binding to its receptor.
-
2.
Decrease in refractive index. The refractive index decrease that was measured by the SPR technique is consistent with the proposed mechanism for the following reasons. Because the cell refractive index is higher than that of water, introduction of vesicles enclosing within their lumen a water-based solution derived from the extracellular milieu should decrease the average refractive index of the cell. This leads to a blue shift in the SPR signal.
Figure 7.
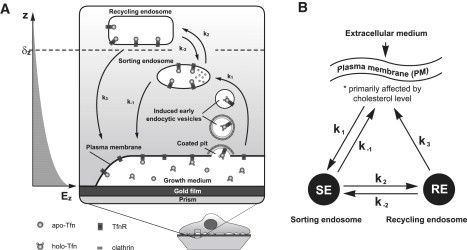
Endocytic and recycling pathways of Tfn. (A) Intracellular endocytic and recycling itineraries of Tfn and its receptor with respect to the SP wave penetration depth. The TfnR binds its ligand, diferric transferrin (holo-Tfn). The ligand-receptor complex is localized in the clathrin-coated pits. On budding into clathrin coated vesicles, the clathrin coat is rapidly dissociated, forming vesicles carrying the internalized molecules. Our observations suggest that Tfn binding induces the formation of endocytic vesicles, hence we termed them “induced early endocytic vesicles”. The naked vesicles then fuse with sorting endosomes (SE), contributing their cargo to these endosomes. The rate constant of the entire process is designated k1. The acidic environment in the lumen of sorting endosomes causes dissociation of the two Fe- ions from Tfn, resulting in the association of Fe-free apo-Tfn to its receptor. A fraction of the membrane associated apo-Tfn-TfnR complex is shuttled back to the plasma membrane. This process represents the short and more rapid recycling pathway of Tfn, characterized by rate constant k−1. Another fraction of the apo-Tfn-TfnR is targeted to a second and more distal endosomal compartment, the recycling endosomes (RE), with rate constant k2. A fraction of these molecules can either shuttle back to SE with a rate constant k−2, or be targeted to the plasma membrane with rate constant k3. The latter represents the longer and slower recycling pathway of Tfn. On exposure to neutral pH of the extracellular environment (growth medium), apo-Tfn dissociates from its receptor. The SP evanescent field, whose penetration depth (δz) is indicated in the left hand part of the figure, senses induced endocytic processes emerging from the plasma membrane that is in contact with the gold film. (B) Schematic description of the kinetic model described by Eqs. 2a and 2b.
Figure 6.
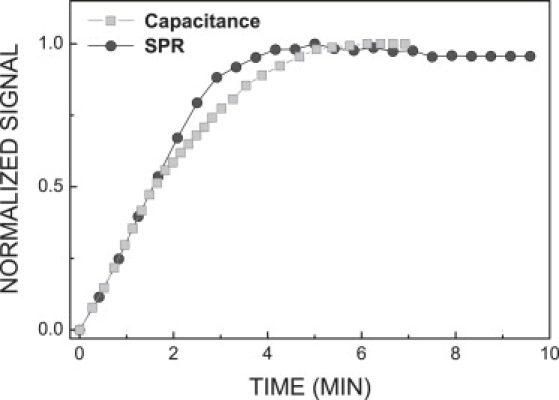
Kinetics of SPR signal and capacitance variations in response to holo-Tfn uptake are similar. Holo-Tfn-induced changes in the SPR signal (circles) and plasma membrane capacitance (squares) were adopted from Fig. 1 (this study), and Fig. 3A in Schwake et al. (7), respectively. Data were normalized to the maximal value.
To address these considerations more quantitatively, we estimate the change in the cell refractive index induced by EE vesicles as follows:
| (1) |
Here, nw and np are the refractive indices of water and organic molecules present in cell, respectively. The surface plasmon measurements were carried out at λ = 2.26 μm because at this particular wavelength the difference between nw and np is maximal, in particular, nw =1.28 (22) and np ∼ 1.57 (23). fp ∼ 30% is the volume fraction of organic molecules in the cell, and complete surface coverage of the prism with cells is assumed. Vc is the cell volume, Vv is the volume of water enclosed by the vesicle, and Nv is the number of EE vesicles.
We estimate Nv from capacitance measurements reported in Schwake et al. (6,7) as follows. Initial vesicle formation rate is dNv/dt ∼250 vesicles/min/cell. Cell capacitance reaches saturation at tsat = 2–3 min after cell exposure to holo-Tfn (Fig. 6). Hence, the number of newly formed EE during this time is: Nv = tsat dNv/dt = 700.
To estimate the volume of an endocytic vesicle, we considered it as a core-shell dielectric sphere having a diameter of 100–150 nm (6,8,24). The vesicle's shell consists of a thin (3–5 nm thick) membrane, encapsulating a large volume of water-based solution. Hence, Vv = 0.0014 μm3 is actually the vesicle volume. Seven hundred vesicles of 150 nm diameter would introduce a total volume of NvVv ∼ 1 μm3 of water into a cell volume of Vc ∼ 1000 μm3. The latter was calculated assuming cell having a cylindrical shape with height: h = 6 μm, and elliptical cross section: 2a = 26 μm and 2b = 9 μm.
On introducing these numbers into Eq. 1, we find that at the early stages of endocytosis the average refractive index of the cell layer decreases by Δn = −1 × 10⁻⁴. Although the sign of Δn is consistent with our observations, the magnitude is smaller by a factor of ∼4 (Fig. 1). This discrepancy could be attributed to the fact that the SPR probes with greater sensitivity cellular regions closer to the basal plasma membrane, where a fraction of newly formed EE vesicles likely accumulates (Fig. 7), whereas the calculation assumed that the vesicles distribute homogenously throughout the entire cell volume. Finally, it is noteworthy that the SPR method is sensitive to changes contributed by the total volume of water introduced with the newly generated vesicles. The subsequent fusion of these vesicles with sorting endosomes (SE) (Fig. 7) would not affect Eq. 1 because the vesicle water contents are transferred into the SE.
Tfn-induced regulation of endocytosis
Our findings may contradict the long-standing notion suggesting that the rate of TfnR endocytosis is not altered in response to ligand binding (25). In this case, endocytosis of the TfnR is constitutive, namely, Tfn binding does not evoke signaling pathways that affect TfnR internalization. However, a number of studies have already challenged this view. First, the most recent studies involving time-resolved fluorescence imaging of Tfn molecules and clathrin-coated pits suggest that Tfn binding to its cell surface receptor stabilizes the assembly, growth, and eventually the budding of clathrin-coated pits (8). These results suggest that Tfn binding may augment the efficacy of Tfn entry into the endocytic pathway by stabilizing the structure of clathrin coats, eventually leading to the production of EE vesicles. Second, Tfn internalization augments the activity of the nonreceptor tyrosine kinase Src, dynamin 2, and the actin-binding protein cortactin (M. A. McNiven, Mayo Clinic College of Medicine, personal communication, 2008), suggesting that Tfn binding to its receptor elicits signaling cascades that activate the endocytic machinery that mediates its own entry. These findings could be consistent with our most recent observations that a fraction of the human TfnR resides in detergent resistant, cholesterol and signaling molecules enriched raft platforms on the cell surface (17). Third, Girones and Davis have shown that diferric Tfn increases the internalization rate of its receptors in A431 human epidermoid-carcinoma cells (4). Combined with the patch clamp capacitance measurements, these independent data support our model whereby Tfn binding to its receptor prompts the formation of EE transport vesicles from the plasma membrane.
Modeling the kinetics of Tfn uptake
If FTIR-SPR indeed measures an early step of Tfn endocytosis, then the kinetic rate constants derived from our experiments should correlate with those obtained by other methods (26,27). A widely adopted kinetic model that describes the steps of Tfn -TfnR entry and recycling is schematically illustrated in Fig. 7, A and B. Holo-Tfn first binds to its receptor on the cell surface. Then, the Tfn-TfnR complex internalizes via clathrin coated pits into primary coated-pit-derived early endocytic vesicles. These vesicles then fuse with SE. The rate constant of this entire process is given by k1. The slightly acidic environment characterizing the lumen of SE results in the release of Fe3+-ions from the Tfn. Then, apo-Tfn bound to its receptor, is delivered from the endosomes either back to plasma membrane (the fast and direct recycling pathway), or is shuttled to another endosomal compartment that resides deeper in the cytoplasm, (recycling endosomes); the rate constants of these processes are k−1 and k2, respectively. The cargo is then shuttled from the RE back to the plasma membrane with rate constant, k3; this is the slow and indirect recycling pathway. A fraction of the Tfn-TfnR molecules can also flow from RE in the reverse direction, i.e., back to SE with rate constant k−2. This step is significantly slower than the trafficking step represented by k3.
The corresponding rate equations are
| (2a) |
| (2b) |
where Nextracellular, NSE, and NRE are the ligand concentrations in the extracellular medium, sorting, and recycling endosomes, respectively.
These linear differential equations can be solved analytically, but the resulting mathematical expressions are too cumbersome. These expressions would be simplified if we assume that the k−2 rate constant is negligible compared to k1,k−1,k2,k3, as was indeed suggested by previous studies (26,27). Because the cell surface was exposed continuously to a large excess of ligand under constant flow, it is reasonable to assume that in our experiments the ligand concentration in the extracellular medium remains constant (Nextracellular = const.). (This is different from the starting point of the endocytic process described in Hao et al. (26) and Sheff et al. (27), in which the ligand was initially bound to the cell surface receptors and subsequently chased into the endocytic pathway.) We solved Eqs. 2a and 2b) under these assumptions and found:
| (3) |
| (4) |
Equation 3 describes a first order fast process that saturates after Δt ∼ (k−1 + k2)−1. Equation 4 describes a slower, second order (sigmoidal) process that reaches saturation after Δt ∼ k3−1.
To link Eqs. 3 and 4 to the experimentally observed quantities, we hypothesize that the SPR technique measures primarily NSE. As discussed in the previous section, the SPR technique monitors changes in the volume fraction of endocytic vesicles/SE in cell regions sensed by the penetrating SPR wave. Because penetration depth of the mid-IR SPR is δz ∼ 1.6 μm, it would mostly sense cellular regions juxtaposed to the basal plasma membrane that contain primarily early endocytic vesicles and sorting endosomes (see Fig. 7). Our model assumes that RE, which reside at more distal areas, i.e., at perinuclear regions of the cell, are not sensed by the SP wave. Because each newly produced vesicle contains roughly the same number of ligand molecules, we assume that the Tfn-induced variation of the SPR reflectivity is ΔR = ASPRNSE/Nextracellular where ASPR is a normalization constant that is not yet predicted reliably by the model and should be determined empirically.
Fig. 4 A shows that the time dependence of the SPR reflectivity variation can be described by a first order kinetic process as predicted by Eq. 3. Exponential fit using Eq. 3 yields time constant k2 + k−1 = 0.65 min−1 for untreated cells. To find k−1, we used the widely accepted value of the rate constant, k2 = 0.35 min−1 (26,27). We also assumed that this rate constant, which accounts for the kinetics of Tfn transport in cellular regions remote from the plasma membrane (Fig. 7), is minimally affected by cholesterol depletion/enrichment of the plasma membrane. Under this assumption, our SPR data of untreated cells yielded k−1 = 0.3 min−1. This value is comparable to the range of values reported for the same step of Tfn-endocytosis in other cells (0.35–0.7 min−1 (26,27)). Using the same reasoning, k−1 = 1.5 min−1 and k−1 = 0.15 min−1 were obtained for cholesterol-enriched and depleted cells, respectively (Fig. 4 B, inset).
Equations 3 and 4 show that the rate constant k1 is a coefficient. That can be deduced from the magnitude of the SPR and fluorescence signals. Unlike the other rate constants (k−1,k2,k3), which appear in the exponent, k1 cannot be deduced from the time-dependence of the SPR and fluorescence signals. At present, we cannot find the absolute value of k1 from the SPR measurements alone, because the normalization constant ASPR is not yet predicted reliably by the model. However, the fluorescence measurements do not rely on any normalization constant; hence we can use them to determine the absolute value of k1 for untreated cells, which is 0.22 min−1 (see below). This yields ASPR = 0.085. Using this empirically derived normalization constant, we determined the values of k1 for cholesterol depleted/enriched cells from the SPR data in Fig. 4 A. These values are presented in the inset of Fig. 4 B. We observe that k1 is strongly affected by acute alterations in plasma membrane cholesterol level. This is not surprising in light of previously reported data in various cell systems, suggesting that clathrin-coated pits mediated endocytosis is inhibited by acute cholesterol depletion (17,21). Our results, however, provide what we believe is additional novel information. First, cholesterol enrichment of the plasma membrane increased the rate of endocytosis (k1). Second, k−1, is also strongly affected by cholesterol enrichment/depletion. These results are in line with the expectation that acute cholesterol depletion/enrichment primarily affects membrane transport events associated with the plasma membrane and with the organelles that closely communicate with it, such as SE. We further discuss the rate constants dependence on membrane cholesterol levels in the Supporting Material.
In our fluorescence studies, we measured the average fluorescence intensity ratio between the cell interior and the extracellular milieu. Because under our experimental conditions the cell fluorescence is contributed mostly by ligand accumulation in RE, we assumed that our fluorescence studies measure mainly NRE/Nextracellular. The rate constant k3 was derived through fitting the temporal dependence of the fluorescence data shown in Fig. 5 A by Eq. 4 and using the already known values k−1, k2 obtained from the SPR measurements (Fig. 4 B, inset). The rate constant k3 (Tfn recycling from RE to the plasma membrane) for untreated cells was found to be 0.07 min−1. This value is comparable to the range of values reported for the same step of Tfn recycling in other cells (0.06–0.08 min−1 (26,27)). The data presented in the inset of Fig. 5 B show that the value of k3 is roughly independent of membrane cholesterol levels. This is consistent with findings for other cell systems and suggests that acute cholesterol depletion/ enrichment has no impact on Tfn recycling (17,21). Together, our findings emphasize the advantages of using the two methods, which complement each other, for obtaining quantitative parameters describing faithfully the kinetics of complex biological processes, such as endocytosis and recycling.
Conclusions
Our study shows for the first time that the FTIR-SPR, likely due to its increased penetration depth, can monitor in a real time and label-free manner the dynamics of trafficking events associated with the plasma membrane (e.g., endocytosis), and with endosomes (e.g., recycling). Our study also motivates the future development of FTIR-SPR as a powerful and versatile spectroscopic method for measuring diverse cellular and membrane trafficking events, in health and disease.
Acknowledgments
We thank Prof. Ioav Cabantchik (The Hebrew University, Life Sciences, Givat Ram) and Prof. Ofer Mandelboim (the Hebrew University, Hadassah Medical School) for providing lissamine rhodamine-labeled apo-transferrin and human melanoma cells, respectively. We also thank Prof. Tomas Kirchhausen (Harvard Medical School) for insightful discussions.
This work was supported in part by the Israel Science Foundation (grant 1337/05), by Johnson & Johnson, and by the Nofar program (in collaboration with Bio-Rad, Haifa) of the Israeli Chief Scientist Office.
Supporting Material
References
- 1.Bareford L.M., Swaan P.W. Endocytic mechanisms for targeted drug delivery. Adv. Drug Deliv. Rev. 2007;59:748–758. doi: 10.1016/j.addr.2007.06.008. [DOI] [PMC free article] [PubMed] [Google Scholar]
- 2.Watson P., Jones A.T., Stephens D.J. Intracellular trafficking pathways and drug delivery: fluorescence imaging of living and fixed cells. Adv. Drug Deliv. Rev. 2005;57:43–61. doi: 10.1016/j.addr.2004.05.003. [DOI] [PubMed] [Google Scholar]
- 3.Qian Z.M., Li H., Sun H., Ho K. Targeted drug delivery via the transferrin receptor-mediated endocytosis pathway. Pharmacol. Rev. 2002;54:561–587. doi: 10.1124/pr.54.4.561. [DOI] [PubMed] [Google Scholar]
- 4.Girones N., Davis R.J. Comparison of the kinetics of cycling of the transferrin receptor in the presence or absence of bound diferric transferrin. Biochem. J. 1989;264:35–46. doi: 10.1042/bj2640035. [DOI] [PMC free article] [PubMed] [Google Scholar]
- 5.Okamoto C.T. From genetics to cellular physiology. Focus on “Regulation of transferrin-induced endocytosis by wild-type and C282Y-mutant HFE in transfected HeLa cells”. Am. J. Physiol. Cell Physiol. 2002;282:C971–C972. doi: 10.1152/ajpcell.00009.2002. [DOI] [PubMed] [Google Scholar]
- 6.Schwake L., Henkel A.W., Riedel H.D., Schlenker T., Both M. Regulation of transferrin-induced endocytosis by wild-type and C282Y-mutant HFE in transfected HeLa cells. Am. J. Physiol. Cell Physiol. 2002;282:C973–C979. doi: 10.1152/ajpcell.00415.2001. [DOI] [PubMed] [Google Scholar]
- 7.Schwake L., Henkel A.W., Riedel H.D., Stremmel W. Patch-clamp capacitance measurements: new insights into the endocytic uptake of transferrin. Blood Cells Mol. Dis. 2002;29:459–464. doi: 10.1006/bcmd.2002.0584. [DOI] [PubMed] [Google Scholar]
- 8.Ehrlich M., Boll W., Van Oijen A., Hariharan R., Chandran K. Endocytosis by random initiation and stabilization of clathrin-coated pits. Cell. 2004;118:591–605. doi: 10.1016/j.cell.2004.08.017. [DOI] [PubMed] [Google Scholar]
- 9.Ziblat R., Lirtsman V., Davidov D., Aroeti B. Infra-red surface plasmon resonance— a novel tool for real-time sensing of variations in living cells. Biophys. J. 2006;90:2592–2599. doi: 10.1529/biophysj.105.072090. [DOI] [PMC free article] [PubMed] [Google Scholar]
- 10.Knoll W. Interfaces and thin films as seen by bound electromagnetic waves. Annu. Rev. Phys. Chem. 1998;49:569–638. doi: 10.1146/annurev.physchem.49.1.569. [DOI] [PubMed] [Google Scholar]
- 11.Raether H. Springer Verlag; Berlin: 1988. Surface Plasmons on Smooth and Rough Surfaces and on Gratings (Springer Tracts in Modern Physics) [Google Scholar]
- 12.Phillips K.S., Cheng Q. Recent advances in surface plasmon resonance based techniques for bioanalysis. Anal. Bioanal. Chem. 2007;387:1831–1840. doi: 10.1007/s00216-006-1052-7. [DOI] [PubMed] [Google Scholar]
- 13.Chabot V., Cuerrier C.M., Escher C.E., Aimez V., Grandbois M. Biosensing based on surface plasmon resonance and living cells. Biosens. Bioelectron. 2009;24:1667–1673. doi: 10.1016/j.bios.2008.08.025. [DOI] [PubMed] [Google Scholar]
- 14.Lirtsman V., Golosovsky M., Davidov D. Infrared surface plasmon resonance technique for biological studies. J. Appl. Phys. 2008;103:014702–01470-5. [Google Scholar]
- 15.Golosovsky M., Lirtsman V., Yashunsky V., Davidov D., Aroeti B. Midinfrared surface-plasmon resonance: a novel biophysical tool for studying living cells. J. Appl. Phys. 2009;105 102036–102036-11. [Google Scholar]
- 16.Iacopetta B.J., Morgan E.H. The kinetics of transferrin endocytosis and iron uptake from transferrin in rabbit reticulocytes. J. Biol. Chem. 1983;258:9108–9115. [PubMed] [Google Scholar]
- 17.Leyt J., Melamed-Book N., Vaerman J.P., Cohen S., Weiss A.M. Cholesterol-sensitive modulation of transcytosis. Mol. Biol. Cell. 2007;18:2057–2071. doi: 10.1091/mbc.E06-08-0735. [DOI] [PMC free article] [PubMed] [Google Scholar]
- 18.Podbilewicz B., Mellman I. ATP and cytosol requirements for transferrin recycling in intact and disrupted MDCK cells. EMBO J. 1990;9:3477–3487. doi: 10.1002/j.1460-2075.1990.tb07556.x. [DOI] [PMC free article] [PubMed] [Google Scholar]
- 19.Sohn Y.S., Breuer W., Munnich A., Cabantchik Z.I. Redistribution of accumulated cell iron: a modality of chelation with therapeutic implications. Blood. 2008;111:1690–1699. doi: 10.1182/blood-2007-07-102335. [DOI] [PubMed] [Google Scholar]
- 20.Subtil A., Hemar A., Dautry-Varsat A. Rapid endocytosis of interleukin 2 receptors when clathrin-coated pit endocytosis is inhibited. J. Cell Sci. 1994;107:3461–3468. doi: 10.1242/jcs.107.12.3461. [DOI] [PubMed] [Google Scholar]
- 21.Subtil A., Gaidarov I., Kobylarz K., Lampson M.A., Keen J.H. Acute cholesterol depletion inhibits clathrin-coated pit budding. Proc. Natl. Acad. Sci. USA. 1999;96:6775–6780. doi: 10.1073/pnas.96.12.6775. [DOI] [PMC free article] [PubMed] [Google Scholar]
- 22.Palik E.D. Academic Press; London, UK: 1985. Handbook of Optical Constants of Solids. [Google Scholar]
- 23.Plant A.L., Brigham-Burke M., Petrella E.C., O'Shannessy D.J. Phospholipid/alkanethiol bilayers for cell-surface receptor studies by surface plasmon resonance. Anal. Biochem. 1995;226:342–348. doi: 10.1006/abio.1995.1234. [DOI] [PubMed] [Google Scholar]
- 24.Hansen S.H., Sandvig K., van Deurs B. The preendosomal compartment comprises distinct coated and noncoated endocytic vesicle populations. J. Cell Biol. 1991;113:731–741. doi: 10.1083/jcb.113.4.731. [DOI] [PMC free article] [PubMed] [Google Scholar]
- 25.Watts C. Rapid endocytosis of the transferrin receptor in the absence of bound transferrin. J. Cell Biol. 1985;100:633–637. doi: 10.1083/jcb.100.2.633. [DOI] [PMC free article] [PubMed] [Google Scholar]
- 26.Hao M., Lin S.X., Karylowski O.J., Wustner D., McGraw T.E. Vesicular and non-vesicular sterol transport in living cells. The endocytic recycling compartment is a major sterol storage organelle. J. Biol. Chem. 2002;277:609–617. doi: 10.1074/jbc.M108861200. [DOI] [PubMed] [Google Scholar]
- 27.Sheff D.R., Daro E.A., Hull M., Mellman I. The receptor recycling pathway contains two distinct populations of early endosomes with different sorting functions. J. Cell Biol. 1999;145:123–139. doi: 10.1083/jcb.145.1.123. [DOI] [PMC free article] [PubMed] [Google Scholar]
Associated Data
This section collects any data citations, data availability statements, or supplementary materials included in this article.