Abstract
Background
Chronic ethanol consumption is associated with a wide variety of immune abnormalities including changes in T cells, B cells, dendritic cells and Natural Killer (NK) cells. However, there is conflicting information as to the direction of such immune changes. The hypothesis that was tested in this report is that, for NK cells, the changes can vary as a function of the duration of alcohol ingestion.
Methods
Using the Meadows-Cook murine model of chronic alcohol ingestion, the changes in NK cell function and subset distribution were examined as a function of the duration of alcohol ingestion
Results
Acute Alcohol ingestion resulted in decreased number and cytotoxic function of NK cells with no effect on intracellular interferon gamma expression. These abnormalities normalized after 12–14 days of alcohol ingestion and there was an increase of NK cell number and cytotoxicity after eight weeks of continued ETOH ingestion.. Ten weeks of continued alcohol consumption results in a significant decrease in the Ly49H+ CD11b+ CD27− splenic NK cell subset; this difference continued to be significant at 30 weeks.
Conclusion
This report may explain some of the conflicting data in the literature that examined NK cell activity in alcoholic patients. It is apparent that various abnormalities can be seen in NK cell activity and subset distribution with the flux being a function of the duration of alcohol ingestion. The demonstration of a decrease in the Ly49H+ subset (which is known to be involved in resisting murine CMV infection) may explain the reported increase in susceptibility to some viral infections in chronic alcohol abuse. Another novel finding is that changes of some subsets of NK cells are not evident until at least ten weeks of continued ETOH consumption.
Introduction
It has been known for some time that alcoholic patients have an aberrant immune system manifested by an increased incidence of infections (bacterial, mycobacterial and viral), autoimmune diseases, and certain malignancies (Cook, 1998; Johnson and Williams, 1986; Mufti et al., 1989; Szabo and Mandrekar, 2009). The underlying immune abnormalities causing such diseases are not well characterized but abnormalities have been reported in both the innate and adaptive immune systems. We, and others, have shown that human alcoholics have persistently activated T cells and monocytes as well as a modulation of lymphocyte subset distribution (Cook et al., 1995; Cook et al., 1994; Haydon et al., 2002; Thiele et al., 2002; Uesugi et al., 2001). Natural Killer (NK) cells, an integral component of innate immunity, have a variable activity in human alcoholics depending on the presence of liver disease and on the extent of monocyte activation (Li et al., 1997). Since innate immunity is now believed to play an important role in the activation of adaptive immunity, understanding the global effects of ethanol (ETOH) on the immune system must take innate immunity into consideration. A detailed examination of such effects would be best done in an animal model. Numerous animal models of ethanol abuse have been reported but most of them suffer from significant drawbacks including the effect of the model on adrenal activation with resultant glucocorticoid secretion which in turn has significant effects on the immune system (Cook et al., 2007). We have utilized chronic 20% (w/v) ETOH in water administration to several mouse strains for prolonged periods of time and demonstrated that this method is convenient, sustainable for at least one year, feasible in several mouse strains, permits good weight gain and results in significant changes in a number of organs. Most importantly, these animals did not show any evidence of stress or adrenal discharge (Cook et al., 2007). This model has allowed us to approximate the human situation to a degree not feasible with the other models in that one can examine immunological changes as a function of the duration of alcohol ingestion rather than an approximation of binge drinking only. Many immune-associated alcohol adverse events in humans do not become apparent until after years of ingestion.
NK cells are large granular lymphocytes, which are capable of killing tumor cells spontaneously, i.e. with no need for prior sensitization; in addition to their lytic function, NK cells secrete interferon gamma (IFNγ) (Heusel and Ballas, 2003; Orange and Ballas, 2006). NK cells are also subject to regulation by various cytokines. Thus, for example, IL-2 can activate NK cells to increase their lytic activity per cell as well as to increase the spectrum of their susceptible targets cells: the so called lymphokine-activated killer phenomenon (Ballas, 2007; Gerosa et al., 2005; Zitvogel et al., 2006). In addition to regulation by cytokines, NK cell cytotoxic and cytokine-producing activities are subject to regulation by several venues. It is now well established that NK cells have numerous activating and inhibiting receptors on their surface. The best defined such receptors firmly establish that Class I MHC expression on a target cell leads to inhibition of NK cell activity. In contrast, certain viruses, CMV in particular, cause the expression of molecules, which, in certain mice, lead to activation of NK cells (e.g. via Ly49H), which eliminate the infection. Mouse strains incapable of expressing Ly49H are more susceptible to CMV infection (Yokoyama et al., 2004).
There is some suggestion in the literature that after 2–4 weeks of ETOH ingestion, in a rat model, NK cell activity is decreased (Boyadjieva et al., 2001). Hebert and Pruett (Hebert and Pruett, 2002), using a murine model of binge drinking, demonstrated that acute alcohol ingestion suppresses activation of NK cells primarily by suppressing the NK cell response to polyinosinic: polycytidylic acid activation. In a rat model, using 2 week alcohol ingestion (8.7%v/v), Dokur et al (Dokur et al., 2003) demonstrated a reduction of perforin, granzyme B and IFN-γ. Zhou and Meadows (Zhou and Meadows, 2003), using a mouse model (20% ETOH, wt/v for 4 weeks), demonstrated that enriched splenic NK cells exhibited reduced mRNA expression of perforin, granzyme A and granzyme B. Zhang and Meadows suggested that ETOH ingestion in mice leads to an increase of CD127+ NK cell subset, and a decrease in the CD11b+ subset, in the spleens of mice that received ETOH for 2 or six months (Zhang and Meadows, 2008) thus indicating the possibility of a differential susceptibility among peripheral NK cell s subsets to ETOH effects.
The complex effect of alcohol on NK cell activity extends to patients as well. Several investigators have measured fresh NK activity in alcoholics with the results ranging from severe depression of activity in patients with advanced alcoholic cirrhosis to little or no reduction of activity in alcoholic patients with no liver disease. We have examined NK cell activity in alcoholic patients and found this activity to be quite variable depending on the presence of liver disease. Patients without evidence of active liver disease (AWLD) tended to have normal NK cell number and killing activity. Patients with alcoholic liver disease (ALD) tended to have decreased NK cell number but there was variability in NK cell killing activity depending on the presence of monocytes. Monocytes were found to be either stimulatory or inhibitory also depending on the presence of liver disease (Cook et al., 1997a; Li et al., 1997).
There are two caveats that apply to most of the studies examining the effect of ETOH on NK cell activity. Firstly, most of the studies used an acute model of ETOH ingestion (quite often by gavage) that may introduce variables not associated with human alcohol ingestions. Secondly, little attention was paid to the potential variability of NK cell activity as a function of the duration of alcohol ingestion.
The studies in this report were undertaken to determine the temporal kinetics of NK cell changes in the chronic model of ETOH ingestion outlined above with particular attention paid to NK cell cytotoxicity, interferon expression and NK cell subset changes. Our results were most unexpected in that we found a reduction in NK cell cytotoxicity but not IFNγ expression which was apparent in the acute phase (up to 12 days) but then returned to baseline and was increased after four weeks. When we examined various NK cell subsets as determined by surface markers (CD27, CD11b and Ly49), we found significant changes in the distribution of NK cell subsets which became evident after around ten weeks of ingestion and were persistent after 30–40 weeks of ETOH ingestion.
Materials and Methods
Mice
Female C57BL/6 mice aged 6–7 weeks were purchased from the National Cancer Institute (Frederick, MD) and housed in barrier facilities at the University of Iowa. After one week of acclimation, ethanol (ETOH) was administered as previously described (Cook et al., 2007). Briefly, mice received 10% w/v ETOH as their sole source of drinking water for two days, followed by five days of 15% ETOH. Following this seven day ramp period, mice were placed on 20% ETOH and maintained at this concentration for the duration of the experiment. Initiation of 20% ETOH administration is considered day 0 and experimental time points are named accordingly. Age-matched control mice received deionized water from the same source as the ETOH diluent. It is worth noting that when the results refer to Week 1 or Week 4, they refer to the duration of alcohol ingestion and not the actual age of the mice. Each control and experimental group had at least five mice. Unless otherwise indicated, each experiment was repeated a minimum of three times. Data for changes in NK cell subsets are presented as the mean of several experiments (the number of experiments is represented as “n” in the figure legend with each experiment having at least five mice per experimental cohort).
All experiments were performed under institutional guidelines according to approved protocols.
Cell Culture and Chromium Release Assay
Splenocytes were treated with 0.83% ammonium chloride to lyse red blood cells. B cells were then depleted using paramagnetic beads conjugated to goat anti-mouse IgG and goat anti-mouse IgM antibodies (Qiagen, Valencia, CA). 5×10⁶ cells were cultured overnight in 24-well plates in RPMI 1640 supplemented with 5% heat-inactivated fetal calf serum. NK activity was stimulated during the overnight culture through the addition of 200 U/ml recombinant mouse IL-2 (eBioscience, San Diego, CA) or 10 µg/ml CpG A oligonucleotide 2336 (provided by Coley Pharmaceutical Group, Wellesley, MA). Cytotoxic activity was assessed using a standard 4-hour 51Cr release assay directed against YAC-1 targets (ATCC, Manassas, VA) as previously described (Ballas, 1986; Ballas, 2007). Briefly, various effector to target cell ratios were used (usually in doubling dilutions starting at 100:1 effector: target ratio; specific lysis was calculated for each ratio For calculation of lytic units, using least squares regression analysis, the number of effector cells needed to effect 30% lysis of the targets was calculated and designated as one lytic unit. The data presented as lytic units indicate the amount of lytic units per 1 × 10⁶ effector cells.
Antibodies and Flow Cytometry
Surface staining for flow cytometric analysis was performed as previously described (Shey and Ballas, 2008). The anti-CD3ε clone C363 was purified from hybridoma supernatant and conjugated to FITC or biotin in our laboratory. PK136 (αNK1.1) PE or APC, 5E6 (αLy49C/I) FITC, 4E5 (αLy49d) FITC, A1 (αLy49A) Biotin, XMG1.2 (αIFN-γ) PE and Streptavidin-PerCP were purchased from BD Biosciences (San Jose, CA). 14B11 (αLy49C/I/F/H) FITC, 3D10 (αLy49H) Biotin, 4D11 (αLy49G2) FITC, M1/70 (aCD11b) and M9.D6 (αTLR9) FITC were purchased from eBioscience (San Diego, CA). Intracellular cytokine staining of splenocytes was performed following a 4 hour stimulation with 10 ng/ml PMA and 200 ng/ml ionomycin (Sigma Chemicals, St. Louis, MO) in the presence of 2 µM GolgiStop (BDBiosciences, San Jose, CA). Fixation and permeabilization was performed using BD Cytofix/Cytoperm (BDBiosciences, San Jose, CA) according to the manufacturer’s instructions. Samples were analyzed on a BD LSR flow cytometer (BDBiosciences, San Jose, CA).
Changes in NK cell subsets were analyzed using two-way ANOVA to estimate and compare mean differences between EtOH and H20 groups. Pairwise comparisons were performed to test for changes in treatment differences over time. All statistical tests were two-sided and assessed for significance at the 0.05 level with the SAS 9.2 software package (Cary, NC).
RESULTS
Changes in NK cells lytic activity as a function of the duration of ETOH ingestion
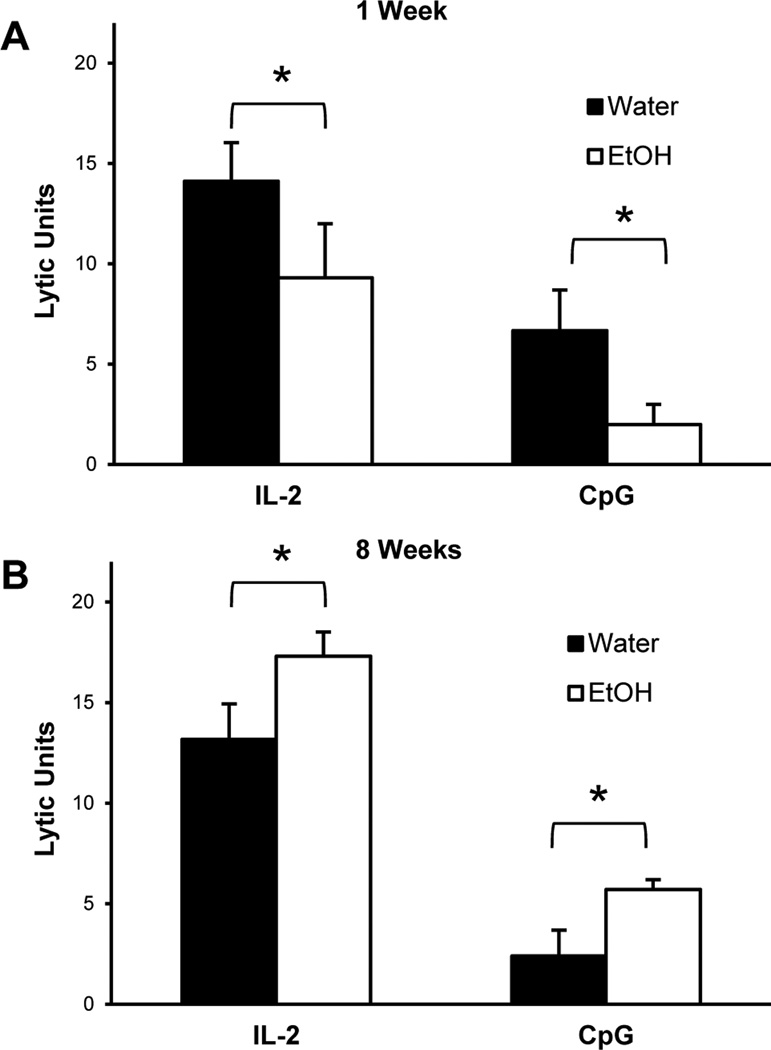
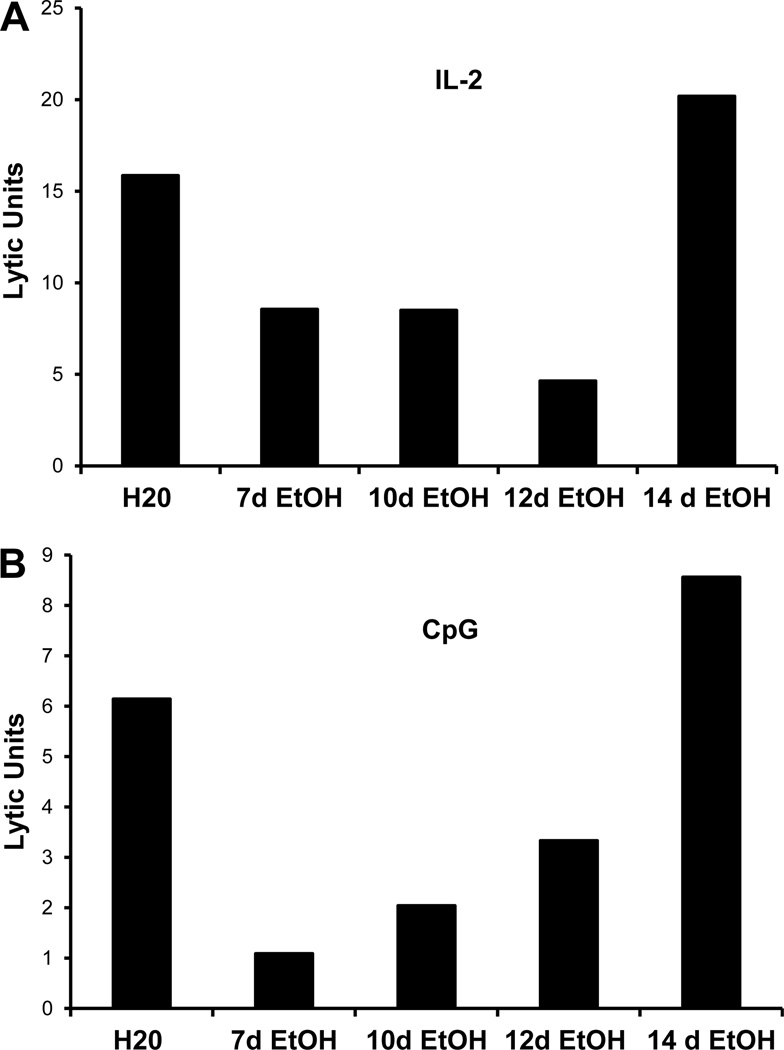
C57BL/6 (B6) mice were “ramped” to 20% ETOH over a period of one week. The day the mice started on 20% ETOH is marked as day 0. Splenocytes were obtained from B6 mice that were on ETOH and examined for their ability to kill YAC-1 target cells. We chose two stimuli to examine NK lytic activity: IL-2 and CpG-A. IL-2 activates NK killing activity directly while CpG requires dendritic cells for optimal activation of such activity (Ballas et al., 2001). As shown in Figure 1A, splenocytes obtained from mice that received 20% ETOH for one week had a significantly decreased NK killing activity in response to both IL-2 and CpG. However, when splenocytes were obtained from mice that received 20% ETOH for eight weeks, NK killing activity was significantly increased as compared to control mice regardless of whether they were stimulated with IL-2 or CpG (Figure 1B). This biphasic effect of ETOH on NK activity was reproduced in numerous experiments. Mice were examined for longer periods of time and the rebounded activity remained normal for up to 40 weeks (the maximum time point examined). In order to understand the mechanisms by which this biphasic effect is mediated, we first sought to determine the exact “inflection” point at which NK cell activity in ETOH mice recover. Splenocytes from B6 mice that received 20% ETOH at various points were examined. As shown in Figure 2, NK activity was decreased up to Day 12 after which there was a steady recovery; this appeared to be true for both IL-2 (Fig 2A) and CpG (Fig 2B) stimulation. The nadir of activity was around day 12 for the majority of the experiments.
Figure 1.
Lytic Activity is decreased in mice which have consumed ethanol for one week and increased in mice which have consumed ethanol for eight weeks. C57BL/6 mice were acclimated to ethanol for one week and maintained on 20% ethanol thereafter. Splenic NK lytic activity was determined by chromium release assay after overnight culture with 200 units/ml IL-2 or 10 micrograms/ml CpG A using the NK sensitive cell line YAC-1. The data on the Y-Axis indicate Lytic Units per 1 × 10⁶ effector cells. Lytic activity was significantly reduced (p < 0.0035 for IL2; p<0.0001 for CpG); data are average of 4 experiment with 5 mice in each experiment) in ethanol-consuming groups relative to water controls after one week of ethanol consumption (A). Lytic activity was significantly increased (p 0.0327 for IL2, 0.0041 for CpG) in ethanol-consuming groups relative to water controls after eight weeks of ethanol consumption (B).
Figure 2.
Decreased lytic activity is short-lived in ethanol-consuming mice. C57BL/6 mice were acclimated to ethanol for 1 week and maintained on 20% ethanol for the indicated number of days. Splenic NK lytic activity was determined by chromium release assay after overnight culture with 200 units/ml IL-2 (A) or 10 micrograms/ml CpG A (B) using the NK sensitive cell line YAC-1. For these experiments, splenocytes from the mice at each time point were pooled together hence no error bars are presented. The design of the experiment was such that all time points were assayed for lytic activity on the same day and with the same reagents. Lytic activity was decreased in ethanol-consuming groups relative to water controls through 12 days of consumption of 20% ethanol after which it returns to levels comparable to water controls. The data shown represent lytic units per 1 × 10⁶ effector cells.
Changes in NK cell numbers as a function of the duration of ETOH ingestion
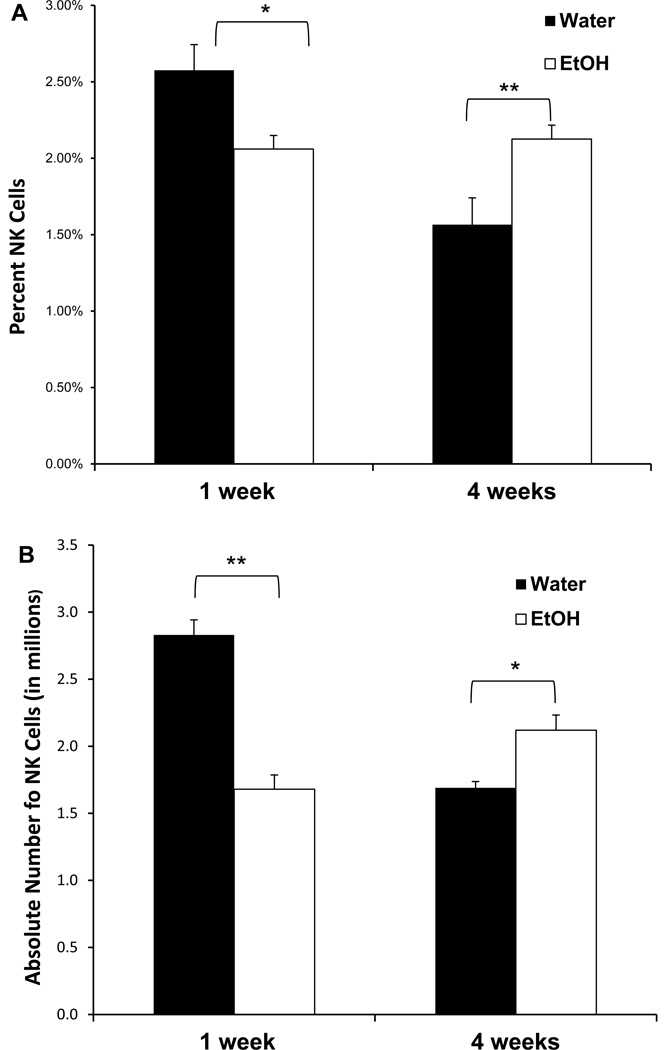
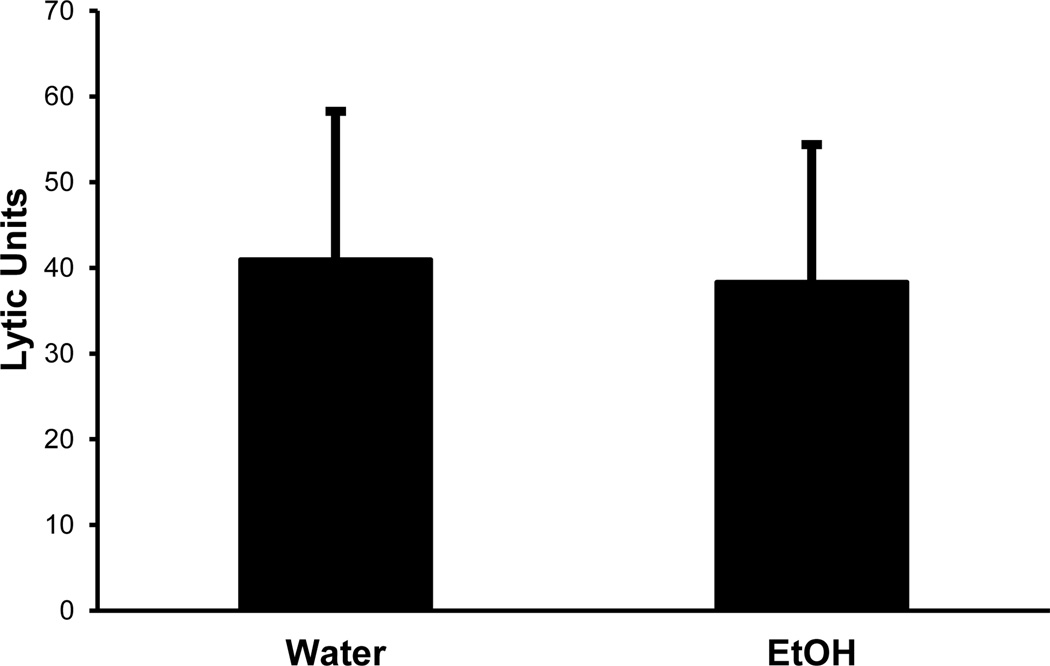
The observed decreased killing activity could be due to decreased numbers of NK cells or to decreased killing activity per cell. We first examined the numbers of NK cells by obtaining splenocytes at various time points and staining them for CD3 and NK1.1 (markers for T lymphocytes and NK cells, respectively). Software gates were then set to examine the percentage of CD3−NK1.1+ (the classical definition of NK markers) cells and calculating the absolute numbers per spleen. As shown in Figure 3A, there was a significantly decreased percentage of NK cells at one week of 20% ETOH ingestion which rebounded and was increased by four weeks (in several other experiments not shown, the recovery of the percentage of NK cells occurred in parallel to the lytic activity and was back to normal by two weeks). When the absolute numbers of NK cells per spleen were calculated, we found the same results as the percentages data (Fig 3B). It appeared therefore, that the decreased killing activity was indeed due to decreased numbers of NK cells rather than decreased activity per cell. In order to confirm this conclusion, NK cells were purified to >90% purity by positive selection with DX5-parmagnetic beads. The highly purified NK cells were then cultured (at 5×10⁶ cells/well) with IL-2 overnight after which their killing activity was examined. As shown in Figure 4, there was no significant difference in the killing activity between the control and the ETOH mice. Since purified NK cells do not respond to CpG in the absence of dendritic cells (Ballas et al., 2001), we did not examine the response of the sorted NK cells to the deoxyribonucleotides. However, in data not shown, we did examine the cytoplasmic expression of TLR9 (the ligand for CpG) in dendritic cells and found no difference between the control and the alcohol mice.
Figure 3.
Ethanol consumption results in a transient decrease followed by an increase in the percent and absolute number of splenic NK cells. C57BL/6 mice were acclimated to ethanol for 1 week and maintained on 20% ethanol for subsequent weeks. The percentage of NK1.1+ CD3− cells was determined by flow cytometry (A). Absolute number (in millions) of NK cells was calculated based upon the total recovery of cells per spleen (B). There was a significant reduction in the percentage of NK cells (p < 0.05, n=9) and in the absolute number of NK cells (p < 0.01, n=8) after one week of ethanol consumption. After four weeks of 20% ethanol consumption, the percentage of splenic NK cells was increased (p < 0.01, n=9) as was the absolute number of NK cells (p < 0.05, n=8).
Figure 4.
Lytic activity of purified NK cells in short-term ethanol-consuming mice is comparable to water controls on a per cell basis. After acclimation, mice were maintained on 20% ethanol for one week. NK cells were purified from spleen using positive selection. The cells were cultured overnight in the presence of 200 units/ml IL-2 and lytic activity was tested by chromium release using YAC-1 target cells. The purified NK cells from ethanol consuming mice were comparable to water controls in augmenting their lytic activity in response to IL-2
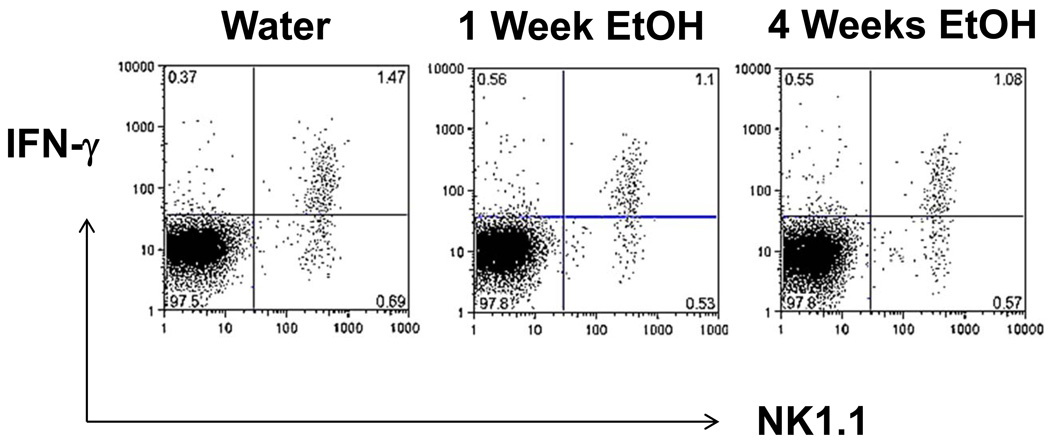
In addition to their lytic activity, NK cells are known to be potent producers of IFN-γ. It is well established in humans that distinct NK cell subsets mediate the killing activity vs the ability to secrete IFN-γ with the former subset being CD56dim while the latter subset is CD56bright (Orange and Ballas, 2006). We examined this directly by obtaining splenocytes from control mice or mice that have ingested 20% ETOH for one or four weeks. The splenocytes were stained for their surface markers (anti-CD3 and anti-NK1.1) after which they were permeabilized and their cytoplasms stained for IFN-γ. Software gates were then set to examine CD3− cells (in order to focus on NK cells and exclude NKT cells). As shown in Figure 5, there was no significant difference in the fraction of NK cells that had cytoplasmic IFN-γ at the one or four weeks’ time point. Interestingly, the ratio of IFN-γ+ to IFN-γ− NK cells was also identical for the control, one week or four weeks (around 2:1). We have shown above that the decreased NK killing activity is probably due to decreased numbers, and we have shown in Figure 5 that there is no significant difference in the percentage of NK cells that express IFN-γ. It appears, therefore, that there is a selective depletion of the cytotoxic fraction of NK cells up to 12 days of acute ETOH ingestion. In data not shown, the IFN-γ-expressing NK cell subset remained normal when mice were examined after 40 weeks of continuous ETOH ingestion.
Figure 5.
IFNγ expression in NK cells after ETOH ingestion. Splenocytes were obtained at the indicated time points, cultured for six hours with PMA/Ionomycin in the presence of monensin after which they were stained for surface expression of NK1.1 and CD3 followed by permeabilization and staining for intracellular IFNγ. The data presented indicate software gates of CD3 negative cells. These data are from a single experiment which is representative of repetitive experiments with the same result.
Changes in NK cell subsets
In order to pursue the possibility that there is a differential effect of ETOH ingestion on distinct NK subsets, we first examined the expression of CD127. CD127+ NK cells are believed to be generated in the thymus while CD127− cells are believed to be bone marrow-derived. Zhang and Meadows (Zhang and Meadows, 2008) have previously reported ETOH increased the CD127+ subset in the spleen, a finding which we reproduced (% CD127+ at 8 weeks was 20.4 ± 1.58 in ETOH and 15.0 ± 5.15 in Control with a P value of 0.049; data not shown).
More recently, NK cells have been divided into more detailed subsets depending on their expression of CD27, CD11b (Mac-1), and various allelic Ly49 receptors.
We examined several combinations of surface markers on NK cells obtained from control mice, from mice that received alcohol for one week, ten weeks or thirty weeks. It is important to note that we used a separate age-matched water control for each time point as age may have an influence on the distribution of NK subsets (Fang et al., 2010).
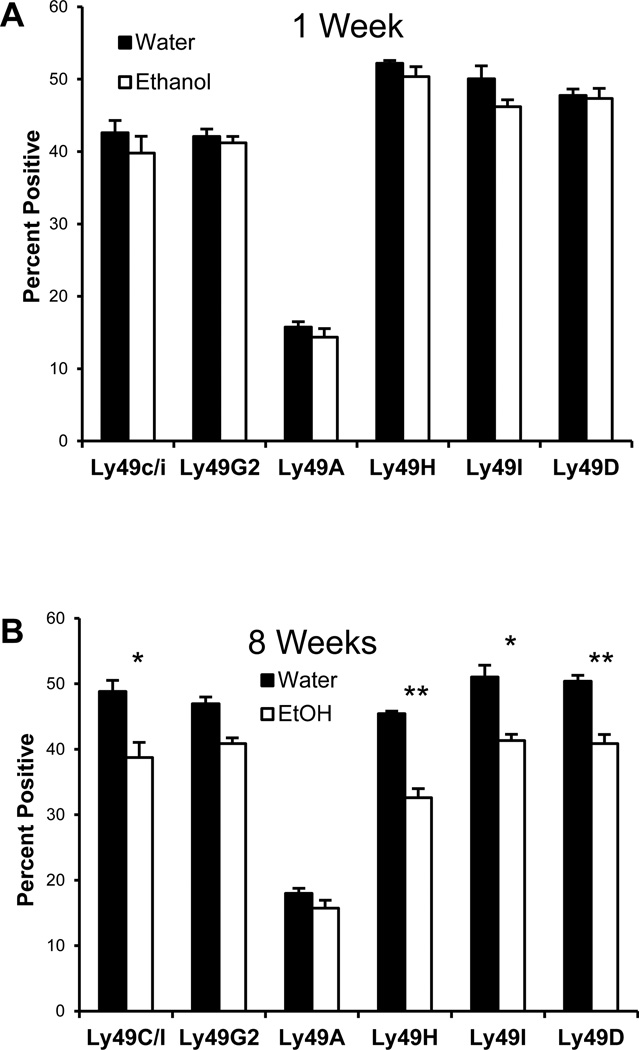
We examined the expression of various Ly49 receptors on NK cells. Mouse NK cell subsets may be defined based on the expression of the lectin-like receptors of the Ly49 family. In B6 mice, most of the Ly49 receptors are inhibitory (e.g. Ly49A, Ly49C) and recognize MHC class I ligands. Ly49H and Ly49D are activating receptors for which Both MHC and MHC-related ligands have been reported (Plougastel and Yokoyama, 2006). Cells were stained for CD3 and NK1.1 as well as the various Ly49 alleles. Software gates were set to analyze the CD3− NK1.1+ (NK cells) and histograms were plotted for Ly49. There was no difference in the expression of any of the LY49 alleles at week 1 (Figure 6A). At week 8, however, there was a significant decline in the Ly49C/I, Ly49H, Ly49I and Ly49D (Figure 6B). There was no difference in the Ly49A or Ly49G2 subset at either time point (Figure 6). In data not shown, this difference was no longer apparent by thirty weeks.
Figure 6.
Long term ethanol consumption results in phenotypic changes to NK cells. After acclimation, mice were maintained on ethanol for one or eight weeks, splenocytes were stained for Ly49C/I, Ly49D, Ly49G2 or Ly49I (FITC) or stained for Ly49H or Ly49A (biotin-streptavidin PerCP). Lymphocytes were gated on CD3− NK1.1+ NK cells and Ly49 expression was examined. There was no significant difference in any of these markers at one week. Mice which have consumed alcohol for 8 weeks demonstrate significantly reduced expression of nearly all Ly49 receptors except Ly49A and Ly49G2. The p values for Ly49C/I/F/H, Ly49D, Ly49H, Ly49I and Ly49C/I were 0.0054, 0.0355, 0.0060, 0.0326 and 0.0266 respectively.
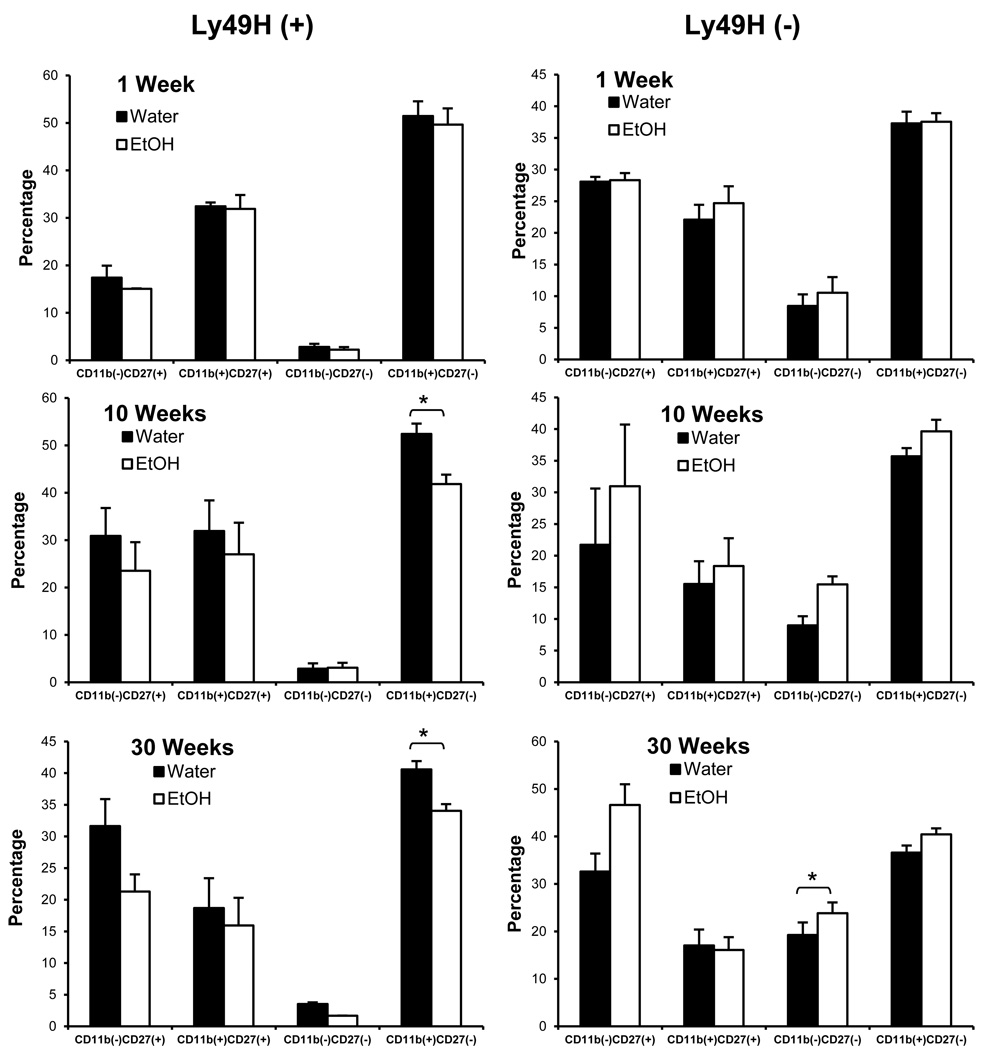
Since Ly49H has been implicated in the susceptibility to CMV infections (Bekiaris et al., 2008 {Arase, 2002 #357; Brown et al., 2001)}, we then focused on examining the Ly49H subsets at three time points: one week, ten weeks and thirty weeks. When the ETOH group was compared to the control group at each of these time points (Figure 7) we found that the ETOH induced a significant decline in the Ly49H+ CD11b+ CD27− subset which was apparent at 10 weeks and was sustained at thirty weeks. There was a statistically significant increase in the Ly49H− CD11b−CD27− subset in ETOH mice that was apparent only at thirty weeks. The changes in the Ly49H+ subsets were persistent at 40 weeks of continuous ETOH ingestion.
Figure 7.
ETOH consumption induces significant changes in NK cell subsets starting at week 10. C57BL/6 mice were maintained on water or acclimated to ethanol for 1 week and maintained on 20% ethanol for one week, ten weeks or thirty weeks. Splenocytes were harvested and stained for flow cytometry. NK cells were gated based upon NK1.1 (+) CD3 (−) expression. The percentage of NK cells in the Ly49H(+) CD11b(+) CD27(−) subset is significantly reduced relative to water controls after ten and thirty weeks of ethanol consumption (p 0.015 and 0.0244 for each of 10 and 30 wks ETOH compared to water controls). There is also a significant increase in the percentage of Ly49H(−) CD11b(−) CD27(−) NK cells in ethanol-consuming mice (p 0.0112) after thirty weeks.
DISCUSSION
There are numerous studies in the literature examining the effect of ETOH on the immune system. Several studies examined the effect on T cells, B cells or dendritic cells (Cook, 1998; Cook et al., 2007; Edsen-Moore et al., 2008; Gurung et al., 2009; Lau et al., 2007). The experiments in this manuscript were focussed on examining the effect of ETOH on NK cells. Several investigators have measured fresh NK activity in alcoholics with the results ranging from severe depression of activity in patients with advanced alcoholic cirrhosis to little or no reduction of activity in alcoholic patients with no liver disease. We have examined NK cell activity in alcoholic patients and found this activity to be quite variable depending on the presence of liver disease. Patients without evidence of active liver disease (AWLD) tended to have normal NK cell number and killing activity. Patients with alcoholic liver disease (ALD) tended to have decreased NK cell number but there was variability in NK cell killing activity depending on the presence of monocytes. Monocytes were found to be either stimulatory or inhibitory also depending on the presence of liver disease (Cook et al., 1997a; Li et al., 1997). Most of the studies in the literature do not address an important variable: the length of time for which patients or experimental animals consumed alcohol. Moreover, there are very few studies characterizing whether the patient populations can be subdivided into those who drink steadily, those who only binge drink and those that have a combination of both behaviors.
The data presented in this report address a novel variable not well characterized in the literature: the effect of ETOH on NK cell activity as a function of the duration of alcohol consumption. In this report, we presented data for NK cells in murine splenocytes. In data not shown, identical results were seen for hepatic NK cells (defined by being NK1.1 + CD3− to distinguish them from the more prevalent hepatic NKT cells). Our data clearly indicate that short term ETOH ingestion results in the selective depletion of the cytotoxic subset of NK cells. Moreover, this subset rebounds to normal after two weeks of continuous ETOH ingestion. We have presented data showing that this recovery is sustained in 8 week mice but we have data, not shown, showing that this recovery is sustained for all of the time points examined (we examined a maximum of 42 weeks). For the sake of clarity, it is important to point out that although we presented data at certain time points, the mice received continuous alcohol ingestion up to that point with no interruption. One can argue that the early decline of NK cell activity is due to the stress of induction of ETOH acclimatization and that we are looking at decreased NK cell activity as a result of adrenal discharge. We do not believe this to be the case because NK cells tend to increase with acute stress. Indeed, we have previously shown that healthy volunteers who drank ETOH acutely had elevated NK cell killing activity and that this elevation was directly proportional to the corticosteroid level (Cook et al., 1997b). Since NK cells are important in the defense against viral infection one would expect that, if our findings were biologically relevant, ETOH mice should have an increased susceptibility to viral infections. This seems to be the case for patients (Cook, 1998; Johnson and Williams, 1986; Mufti et al., 1989; Szabo and Mandrekar, 2009) and for a mouse model of influenza (Meyerholz et al., 2008).
NK homeostasis is tightly regulated by dendritic cells and by cytokines. We have employed stimulation with IL-2 and CpG to gain an insight into the potential mechanism of the decreased NK activity. IL-2 activates NK cells directly while CpG activates DC which secrete IFN-α which then activates NK cells (Ballas, 2007; Krug et al., 2001). Since purified NK cells responded normally to IL-2, we believe that the observed early ETOH effect is mediated by modulating DC responses. There is no clear consensus in the literature on the effect of ETOH on DC subsets, numbers and function. Heinz and Waltenbaugh (Heinz and Waltenbaugh, 2007), using the Lieber-Decarli model suggested that ETOH alters CD11c+CD8+ DC function thus affecting adaptive immune responses. There was no clear indication of the temporal effects, if any, in this model. Lau et al (Lau et al., 2007) showed that splenic DC exposed to alcohol in vitro exhibited impaired functional maturation following CpG stimulation. Edsen-Moore et al (Edsen-Moore et al., 2008) found that chronic ETOH ingestion increased thymic DC while decreasing splenic DC numbers. We have not examined the temporal effect on DC subsets and function as they relate to NK cell activity as of yet. However, chronic ETOH ingestion seems to have significant effects on phenotypic and functional T cell subsets including reduced total numbers, increased CD4/CD8 ratios and an increase in the memory: naïve phenotype ratio (Gurung et al., 2009; Young et al., 2008). Other studies suggested a decrease in Th1 immunity and an increased Th2 response in a murine model of parasitic infestation (Krolewiecki et al., 2001). In a model examining T cell responses to listeria monocytogenes, it was found that ETOH ingestion has little effect on antigen-specific CD4 cells but causes significant reduction in antigen-specific CD8 T cells (Gurung et al., 2009). Thus, it is possible that some of the NK changes are due to various altered T cell subsets.
Perhaps the most significant finding in this report is the dynamic change in NK cell subsets as a function of time. We did not find an effect of ETOH on the NK cell subset that expresses IFNγ either at one week or 40 weeks. Moreover, in data not shown, the ability of NK cells to secrete IFNγ was not altered. While the cytotoxic activity of NK cell was biphasic, the effect on NK cell subset distribution was late but sustained. The subset that seems most significantly and persistently decreased is the Ly49H subset. We examined various Ly49H subsets as determined by their co-expression of CD11b and CD27. Our data clearly indicate significant decrease in the Ly49H+CD11b+CD27− subset which starts after ten weeks of alcohol ingestion and is sustained at 30 weeks. There appears to be a corresponding significant increase in the Ly49H− CD11b− CD27− subset which is demonstrable after 30 weeks of ETOH ingestion. Ly49H+ NK cells are believed to be important in resisting CMV infection. There have been some reports suggesting that ETOH mice are more susceptible to viral infections including influenza virus (Meyerholz et al., 2008). Our results suggest that such susceptibility might vary as a function of the duration of alcohol ingestion. This variability is consistent with the variability in NK cell activity that we reported in patients whose NK activity varied as a function of the presence of liver disease and as a function of monocyte abnormality. Zhang and Meadows reported a decrease in the CD11b+ NK cell subset with ETOH ingestion but did not characterize that subset further (Zhang and Meadows, 2008). Interestingly, Fang et al (Fang et al., 2010) demonstrated an age-dependent susceptibility to mousepox viral infection which was associated with an age-associated decline in the CD11b−CD27+ NK cell subset. Fang et al (Fang et al., 2010), did not break this subset further into Ly49H+ or Ly49H− as we did. It is worth noting that we did notice an age-associated decline in the water control groups but the ETOH mice had a higher decline at each time point.
Our data were obtained in mice on steady and chronic alcohol ingestion. It remains to be seen as to whether the abnormalities seen in the first week and the abnormalities seen after ten weeks of steady consumption can be reproduced in a setting of binge drinking on a background of chronic ETOH ingestion. This is an important future venue of investigation.
In summary, the data presented in this report indicate several new findings:
Acute ETOH ingestion results in a transient and selective decrease of the cytotoxic NK cell subset in murine spleens while sparing the IFNγ-secreting subset
These changes first normalize then reverse with continued chronic alcohol consumption.
Chronic ETOH consumption results in a selective but significant decrease in the Ly49H+CD11b+CD27− NK cell subset starting at ten weeks after continuous ETOH ingestion.
Acknowledgments
We thank Dr. Jonathan Heusel for his critical review of this manuscript and Ms. Anna Button for her help in statistical analysis.
This work was supported by VA Merit Review and by NIH R01 AA014418
REFERENCES
- Ballas ZK. Lymphokine-activated killer (LAK) cells. I. Differential recovery of LAK, natural killer cells, and cytotoxic T lymphocytes after a sublethal dose of cyclophosphamide. J Immunol. 1986;137(7):2380–2384. [PubMed] [Google Scholar]
- Ballas ZK. Modulation of NK cell activity by CpG oligodeoxynucleotides. Immunol Res. 2007;39(1–3):15–21. doi: 10.1007/s12026-007-0066-3. [DOI] [PubMed] [Google Scholar]
- Ballas ZK, Krieg AM, Warren T, Rasmussen W, Davis HL, Waldschmidt M, Weiner GJ. Divergent therapeutic and immunologic effects of oligodeoxynucleotides with distinct CpG motifs. J Immunol. 2001;167(9):4878–4886. doi: 10.4049/jimmunol.167.9.4878. [DOI] [PubMed] [Google Scholar]
- Bekiaris V, Timoshenko O, Hou TZ, Toellner K, Shakib S, Gaspal F, McConnell FM, Parnell SM, Withers D, Buckley CD, Sweet C, Yokoyama WM, Anderson G, Lane PJ. Ly49H+ NK cells migrate to and protect splenic white pulp stroma from murine cytomegalovirus infection. J Immunol. 2008;180(10):6768–6776. doi: 10.4049/jimmunol.180.10.6768. [DOI] [PubMed] [Google Scholar]
- Boyadjieva N, Dokur M, Advis JP, Meadows GG, Sarkar DK. Chronic ethanol inhibits NK cell cytolytic activity: role of opioid peptide beta-endorphin. J Immunol. 2001;167(10):5645–5652. doi: 10.4049/jimmunol.167.10.5645. [DOI] [PubMed] [Google Scholar]
- Brown MG, Dokun AO, Heusel JW, Smith HR, Beckman DL, Blattenberger EA, Dubbelde CE, Stone LR, Scalzo AA, Yokoyama WM. Vital involvement of a natural killer cell activation receptor in resistance to viral infection. Science. 2001;292(5518):934–937. doi: 10.1126/science.1060042. [DOI] [PubMed] [Google Scholar]
- Cook RT. Alcohol abuse, alcoholism, and damage to the immune system--a review. Alcohol Clin Exp Res. 1998;22(9):1927–1942. [PubMed] [Google Scholar]
- Cook RT, Ballas ZK, Waldschmidt TJ, Vandersteen D, LaBrecque DR, Cook BL. Modulation of T-cell adhesion markers, and the CD45R and CD57 antigens in human alcoholics. Alcohol Clin Exp Res. 1995;19(3):555–563. doi: 10.1111/j.1530-0277.1995.tb01548.x. [DOI] [PubMed] [Google Scholar]
- Cook RT, Li F, Vandersteen D, Ballas ZK, Cook BL, LaBrecque DR. Ethanol and natural killer cells. I. Activity and immunophenotype in alcoholic humans. Alcohol Clin Exp Res. 1997a;21(6):974–980. [PubMed] [Google Scholar]
- Cook RT, Schlueter AJ, Coleman RA, Tygrett L, Ballas ZK, Jerrells TR, Nashelsky MB, Ray NB, Haugen TH, Waldschmidt TJ. Thymocytes, pre-B cells, and organ changes in a mouse model of chronic ethanol ingestion--absence of subset-specific glucocorticoid-induced immune cell loss. Alcohol Clin Exp Res. 2007;31(10):1746–1758. doi: 10.1111/j.1530-0277.2007.00478.x. [DOI] [PMC free article] [PubMed] [Google Scholar]
- Cook RT, Stapleton JT, Ballas ZK, Klinzman D. Effect of a single ethanol exposure on HIV replication in human lymphocytes. J Investig Med. 1997b;45(5):265–271. [PubMed] [Google Scholar]
- Cook RT, Waldschmidt TJ, Ballas ZK, Cook BL, Booth BM, Stewart BC, Garvey MJ. Fine T-cell subsets in alcoholics as determined by the expression of L-selectin, leukocyte common antigen, and beta-integrin. Alcohol Clin Exp Res. 1994;18(1):71–80. doi: 10.1111/j.1530-0277.1994.tb00883.x. [DOI] [PubMed] [Google Scholar]
- Dokur M, Boyadjieva NI, Sarkar DK. Reduction of perforin, granzyme B, and cytokine interferon gamma by ethanol in male Fischer 344 rats. Alcohol Clin Exp Res. 2003;27(4):670–676. doi: 10.1097/01.ALC.0000060528.53113.5C. [DOI] [PubMed] [Google Scholar]
- Edsen-Moore MR, Fan J, Ness KJ, Marietta JR, Cook RT, Schlueter AJ. Effects of chronic ethanol feeding on murine dendritic cell numbers, turnover rate, and dendropoiesis. Alcoholism, clinical and experimental research. 2008;32(7):1309–1320. doi: 10.1111/j.1530-0277.2008.00699.x. [DOI] [PMC free article] [PubMed] [Google Scholar]
- Fang M, Roscoe F, Sigal LJ. Age-dependent susceptibility to a viral disease due to decreased natural killer cell numbers and trafficking. The Journal of experimental medicine. 2010;207(11):2369–2381. doi: 10.1084/jem.20100282. [DOI] [PMC free article] [PubMed] [Google Scholar]
- Gerosa F, Gobbi A, Zorzi P, Burg S, Briere F, Carra G, Trinchieri G. The reciprocal interaction of NK cells with plasmacytoid or myeloid dendritic cells profoundly affects innate resistance functions. J Immunol. 2005;174(2):727–734. doi: 10.4049/jimmunol.174.2.727. [DOI] [PubMed] [Google Scholar]
- Gurung P, Young BM, Coleman RA, Wiechert S, Turner LE, Ray NB, Waldschmidt TJ, Legge KL, Cook RT. Chronic ethanol induces inhibition of antigen-specific CD8+ but not CD4+ immunodominant T cell responses following Listeria monocytogenes inoculation. J Leukoc Biol. 2009;85(1):34–43. doi: 10.1189/jlb.0208101. [DOI] [PMC free article] [PubMed] [Google Scholar]
- Haydon G, Lalor PF, Hubscher SG, Adams DH. Lymphocyte recruitment to the liver in alcoholic liver disease. Alcohol. 2002;27(1):29–36. doi: 10.1016/s0741-8329(02)00208-2. [DOI] [PubMed] [Google Scholar]
- Hebert P, Pruett SB. Ethanol suppresses polyinosinic:polycytidylic acid-induced activation of natural killer cells primarily by acting on natural killer cells, not through effects on other cell types. Alcohol. 2002;28(2):75–81. doi: 10.1016/s0741-8329(02)00242-2. [DOI] [PubMed] [Google Scholar]
- Heinz R, Waltenbaugh C. Ethanol consumption modifies dendritic cell antigen presentation in mice. Alcoholism, clinical and experimental research. 2007;31(10):1759–1771. doi: 10.1111/j.1530-0277.2007.00479.x. [DOI] [PubMed] [Google Scholar]
- Heusel JW, Ballas ZK. Natural killer cells: emerging concepts in immunity to infection and implications for assessment of immunodeficiency. Curr Opin Pediatr. 2003;15(6):586–593. doi: 10.1097/00008480-200312000-00008. [DOI] [PubMed] [Google Scholar]
- Johnson RD, Williams R. Immune responses in alcoholic liver disease. Alcohol Clin Exp Res. 1986;10(5):471–486. doi: 10.1111/j.1530-0277.1986.tb05126.x. [DOI] [PubMed] [Google Scholar]
- Krolewiecki AJ, Leon S, Scott PA, Nolan TJ, Schad GA, Abraham D. Effect of chronic ethanol consumption on protective T-helper 1 and T-helper 2 immune responses against the parasites Leishmania major and Strongyloides stercoralis in mice. Alcohol Clin Exp Res. 2001;25(4):571–578. [PubMed] [Google Scholar]
- Krug A, Rothenfusser S, Hornung V, Jahrsdorfer B, Blackwell S, Ballas ZK, Endres S, Krieg AM, Hartmann G. Identification of CpG oligonucleotide sequences with high induction of IFN-alpha/beta in plasmacytoid dendritic cells. Eur J Immunol. 2001;31(7):2154–2163. doi: 10.1002/1521-4141(200107)31:7<2154::aid-immu2154>3.0.co;2-u. [DOI] [PubMed] [Google Scholar]
- Lau AH, Thomson AW, Colvin BL. Chronic ethanol exposure affects in vivo migration of hepatic dendritic cells to secondary lymphoid tissue. Human immunology. 2007;68(7):577–585. doi: 10.1016/j.humimm.2007.03.008. [DOI] [PubMed] [Google Scholar]
- Li F, Cook RT, Alber C, Rasmussen W, Stapleton JT, Ballas ZK. Ethanol and natural killer cells. II. Stimulation of human natural killer activity by ethanol in vitro. Alcohol Clin Exp Res. 1997;21(6):981–987. [PubMed] [Google Scholar]
- Meyerholz DK, Edsen-Moore M, McGill J, Coleman RA, Cook RT, Legge KL. Chronic alcohol consumption increases the severity of murine influenza virus infections. J Immunol. 2008;181(1):641–648. doi: 10.4049/jimmunol.181.1.641. [DOI] [PMC free article] [PubMed] [Google Scholar]
- Mufti SI, Darban HR, Watson RR. Alcohol, cancer, and immunomodulation. Crit Rev Oncol Hematol. 1989;9(3):243–261. doi: 10.1016/s1040-8428(89)80003-4. [DOI] [PubMed] [Google Scholar]
- Orange JS, Ballas ZK. Natural killer cells in human health and disease. Clin Immunol. 2006;118(1):1–10. doi: 10.1016/j.clim.2005.10.011. [DOI] [PubMed] [Google Scholar]
- Plougastel BF, Yokoyama WM. Extending missing-self? Functional interactions between lectin-like NKrp1 receptors on NK cells with lectin-like ligands. Current topics in microbiology and immunology. 2006;298:77–89. doi: 10.1007/3-540-27743-9_4. [DOI] [PubMed] [Google Scholar]
- Shey MR, Ballas ZK. Assessment of natural killer (NK) and NKT cells in murine spleens and livers. Methods in molecular biology. 2008;447:259–276. doi: 10.1007/978-1-59745-242-7_18. [DOI] [PubMed] [Google Scholar]
- Szabo G, Mandrekar P. A recent perspective on alcohol, immunity, and host defense. Alcoholism, clinical and experimental research. 2009;33(2):220–232. doi: 10.1111/j.1530-0277.2008.00842.x. [DOI] [PMC free article] [PubMed] [Google Scholar]
- Thiele GM, Szabo G, Kovacs EJ, Bautista AP, Sosa L, Jerrells TR. Modulation of immunity and viral-host interactions by alcohol. Alcohol Clin Exp Res. 2002;26(12):1897–1908. [PubMed] [Google Scholar]
- Uesugi T, Froh M, Arteel GE, Bradford BU, Thurman RG. Toll-like receptor 4 is involved in the mechanism of early alcohol-induced liver injury in mice. Hepatology. 2001;34(1):101–108. doi: 10.1053/jhep.2001.25350. [DOI] [PubMed] [Google Scholar]
- Yokoyama WM, Kim S, French AR. The dynamic life of natural killer cells. Annu Rev Immunol. 2004;22:405–429. doi: 10.1146/annurev.immunol.22.012703.104711. [DOI] [PubMed] [Google Scholar]
- Young BM, Wiechert S, Coleman RA, Gurung P, Cook RT. Polyclonal and antigen-specific responses of T cells and T cell subsets. Methods Mol Biol. 2008;447:277–294. doi: 10.1007/978-1-59745-242-7_19. [DOI] [PubMed] [Google Scholar]
- Zhang H, Meadows GG. Chronic alcohol consumption perturbs the balance between thymus-derived and bone marrow-derived natural killer cells in the spleen. J Leukoc Biol. 2008;83(1):41–47. doi: 10.1189/jlb.0707472. [DOI] [PubMed] [Google Scholar]
- Zhou J, Meadows GG. Alcohol consumption decreases IL-2-induced NF-kappaB activity in enriched NK cells from C57BL/6 mice. Toxicol Sci. 2003;73(1):72–79. doi: 10.1093/toxsci/kfg047. [DOI] [PubMed] [Google Scholar]
- Zitvogel L, Terme M, Borg C, Trinchieri G. Dendritic cell-NK cell cross-talk: regulation and physiopathology. Curr Top Microbiol Immunol. 2006;298:157–174. doi: 10.1007/3-540-27743-9_8. [DOI] [PubMed] [Google Scholar]


