Abstract
GM2 ganglioside in the brain increased during ethanol-induced acute apoptotic neurodegeneration in 7-day-old mice. A small but a significant increase observed 2 h after ethanol exposure was followed by a marked increase around 24 h. Subcellular fractionation of the brain 24 h after ethanol treatment indicated that GM2 increased in synaptic and non-synaptic mitochondrial fractions as well as in a lysosome-enriched fraction characteristic to the ethanol-exposed brain. Immunohistochemical staining of GM2 in the ethanol-treated brain showed strong punctate staining mainly in activated microglia, in which it partially overlapped with staining for LAMP1, a late endosomal/lysosomal marker. Also, there was weaker neuronal staining, which partially co-localized with complex IV, a mitochondrial marker, and was augmented in cleaved caspase-3-positive neurons. In contrast, the control brain showed only faint and diffuse GM2 staining in neurons. Incubation of isolated brain mitochondria with GM2 in vitro induced cytochrome c release in a manner similar to that of GD3 ganglioside. Because ethanol is known to trigger mitochondria-mediated apoptosis with cytochrome c release and caspase-3 activation in the 7-day–old mouse brain, the GM2 elevation in mitochondria may be relevant to neuroapoptosis. Subsequently, activated microglia accumulated GM2, indicating a close relationship between GM2 and ethanol-induced neurodegeneration.
Keywords: GM2 ganglioside, ethanol, mitochondria, lysosome, activated microglia, apoptotic neurodegeneration
Introduction
Rodents exposed to ethanol during sensitive periods of brain development manifest neuropathological conditions comparable to those of human fetal alcohol spectrum disorders (FASD). Specifically, ethanol triggers apoptotic neurodegeneration in the newborn rodent brain during the period of rapid synaptogenesis that is equivalent to the last trimester of pregnancy in humans (Ikonomidou et al. 2000; Olney et al. 2002). Such ethanol-induced neuronal loss in rodents may partially explain the pathophysiology of FASD-like conditions (Wozniak et al. 2004; Guerri et al. 2009; Farber et al. 2010; Wilson et al. 2011). It has been shown that acute ethanol treatment in postnatal day 7 (P7) mice induces mitochondria-mediated apoptosis in the brain, involving Bax activation, cytochrome c release, and caspase-3 activation (Carloni et al. 2004; Young et al. 2003; Han et al. 2006). The caspase-3 activation, which occurs strongly 6–8 h after ethanol exposure, is followed by neurodegeneration detected by silver staining around 16–24 h (Olney et al. 2002; Saito et al. 2007b).
We previously have demonstrated that such ethanol-induced apoptotic neurodegeneration is accompanied by increases in brain lipids—ceramide, triglyceride, cholesterol ester, and N-acylphosphatidylethanolamine (Saito et al. 2007a). Among them, de novo ceramide synthesis appears to be critical for ethanol-induced apoptotic pathway because ceramide elevation correlates with the severity of caspase-3 activation, and inhibitors of serine palmitoyltransferase, a rate-limiting enzyme for sphingolipid synthesis, attenuated ethanol-induced apoptosis in the P7 brain (Saito et al. 2010a). However, other ceramide metabolites may also be involved in such ethanol-induced apoptosis. In the present study, we focused on the effects of ethanol on gangliosides, which are synthesized from ceramide by sequential glycosylation in the Golgi apparatus. Gangliosides, which are particularly abundant in the nervous system, have many biological functions as antigens, mediators of cell adhesion, and modulators of signal transduction (Ledeen and Wu 2002; Hakomori 2003). Gangliosides are also involved in apoptotic pathways. Specifically, involvement of GD3 in CD95/Fas–mediated apoptosis in lymphocytes has been extensively studied (Malorni et al. 2007). Although the majority of gangliosides are found in glycosphingolipid-enriched microdomains (lipid rafts) in the plasma membrane (Hakomori 2003), GD3 accumulates within mitochondria of cells undergoing apoptosis (Rippo et al. 2000), and direct interaction of GD3 with mitochondria induces cytochrome c release and caspase-3 activation (Garcia-Ruiz et al. 2002).
We report here that ethanol treatment in P7 mice specifically increased GM2 ganglioside in the brain. While GM2 is normally a minor ganglioside, it is transiently elevated during a restricted period in brain development (Zervas and Walkley 1999) and significantly elevated in the brain in GM2 gangliosidosis and other lysosomal storage disorders such as Niemann-Pick C disease and mucopolysaccharidoses where it shows vesicular organellar accumulation (Constantopoulos et al. 1978; Hara et al. 1984; Zervas et al. 2001). In addition, accumulation of GM2 has been observed in neurodegenerative diseases, such as Alzheimer disease and Angelman-like syndrome (Piccinini et al. 2010; Stromme et al. 2011). However, the potential relationship between GM2 accumulation and neurodegeneration has not been elucidated. The present study indicates that GM2 accumulation in mitochondria and late endosomes/lysosomes may be involved in ethanol-induced apoptotic neurodegeneration in the developing brain.
Materials and Methods
Animals
C57BL/6By mice were maintained at the Animal Facility of Nathan S. Kline Institute for Psychiatric Research. All procedures followed guidelines consistent with those developed by the National Institute of Health and the Institutional Animal Care and Use Committee of Nathan S. Kline Institute.
Experimental Procedure
An ethanol treatment paradigm that induces robust neurodegeneration in P7 mice (Olney et al. 2002; Saito et al. 2007b) was followed. Each mouse in a litter was assigned to the saline or ethanol group. The mice were injected subcutaneously with saline or ethanol (2.5 g/kg, 20% solution in sterile saline) twice at 0 h and 2 h. For experiments, which include 1 h and 2 h time points, ethanol (5.0 g/kg, 20% solution in sterile saline) was injected once. This one time injection paradigm achieves blood ethanol levels similar to that of two time injections described above, leading to robust apoptotic neurodegeneration (Ieraci and Herrera 2006). Mice were kept with dams until brains were removed and processed for ganglioside analyses, subcellular fractionation, immunohistochemical staining, and immunoblotting, as described below. Four to ten animals were used for each data point.
Ganglioside analysis
Ganglioside analysis was performed as described previously (Saito et al. 2007a). Briefly, brains or subcellular fractions were placed immediately in ice-cold chloroform/methanol (1:1) solution, and kept for 3 days at 4°C for brains and for 5 min on ice for subcellular fractions to extract total lipids. Then, the upper phase obtained by the Folch partitioning of the total lipid fraction was applied to a C18 Sep-Pak cartridge. The ganglioside fraction eluted by methanol was dried, dissolved in chloroform/methanol (1:1), and applied to a high-performance thin layer chromatography (HPTLC) plate, which was developed by chloroform/methanol/0.25% KCl (5:4:1) (Ledeen and Yu 1982). Then, the plates were stained with an orcinol reagent. The stained HPTLC plates including a GM2 standard purified from Tay-Sachs brains were scanned with the Odyssey infrared imaging system (LI-COR Biosciences, Lincoln, NE, USA) and analyzed by Multi Gauge ver.2.0 (Fujifilm USA Medical Systems, Stamford, CT, USA). Alternatively, GM2 was detected by a TLC overlay method (Ariga and Yu 2000) using mouse monoclonal anti-GM2 antibody. The anti-GM2 antibody, shown highly specific to this glycolipid (Natoli et al. 1986; Zervas and Walkley 1999), was produced as a supernatant from hybridoma clone 10–11 cells (Micsenyi et al. 2009). Anti-GM2 antibody bound to HPTLC sheets was visualized using Avidin-Biotin Complex (ABC) reagents (Vectastain ABC Kit, Vector Labs, Burlingame, CA, USA) and a peroxidase substrate (DAB) kit (Vector Labs) following the manufacturer’s instructions.
Subcellular fractionation
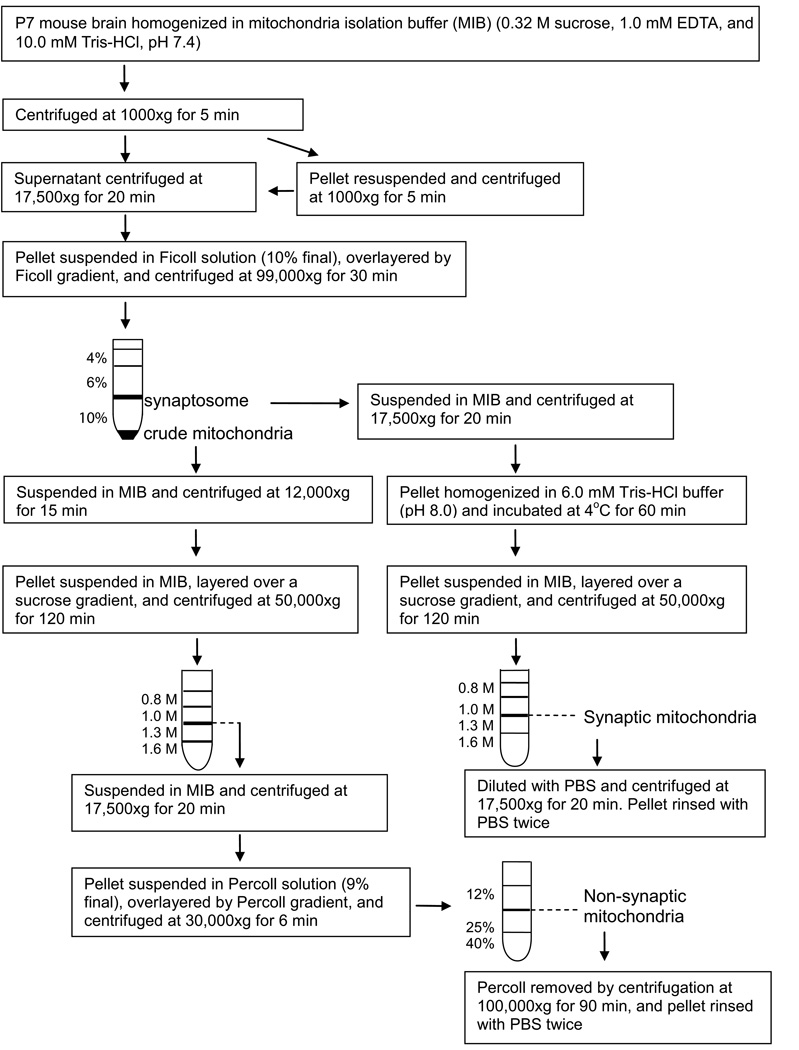
Mitochondria-enriched fractions were prepared from P7 brains harvested 24 h after the first saline/ethanol injection using Percoll density gradient as described before (Rajapakse et al. 2001) except that the same Percoll gradient procedure was repeated twice. In addition, a band with a density heavier than the expected mitochondrial band on the Percoll density gradient was also collected. Non-synaptic and synaptic mitochondria were isolated as described in the method of Kiebish et al. (2008) with some modifications. Major changes were that synaptosomal and mitochondrial fractions were separated using 4/6/10% Ficoll gradient established for the neonatal rat brain (Keelan et al. 1996), and that both synaptic and non-synaptic mitochondria fractions were isolated from bands between 1.0 M and 1.3 M on the sucrose density gradient instead of bands between 1.3 M and 1.6M originally described for adult mitochondrial purification, because among four bands obtained after the sucrose density gradient centrifugation, the band between 1.0 M and 1.3 M was most enriched in VDAC (a mitochondrial protein) in both non-synaptic and synaptic preparations. This finding agrees with the report by Rajapakse et al. (2001) showing that mitochondria from the neonatal rat brain have lower density than those from the adult brain. Also, the non-synaptic mitochondria fraction thus obtained by the sucrose gradient was further purified by the Percoll density gradient centrifugation as described (Rajapakse et al. 2001).
Immunohistochemistry
Two to 48 hours after the first ethanol injection, mice anesthetized with an intraperitoneal injection of 60 mg/kg sodium pentobarbital solution (3 mg/ml in sterile saline) were perfusion-fixed with a solution containing 4% paraformaldehyde and 4% sucrose in cacodylate buffer (pH 7.2), and the heads were further kept in the perfusion solution at 4°C overnight. Then, brains were removed, transferred to phosphate buffered saline solution, and kept at 4°C for 2–5 days until sectioned with a vibratome into 50 µm thick sections. The free-floating sections were dual-immunofluorescence-labeled using primary antibodies against GM2 (a mouse monoclonal antibody from hybridoma clone 10–11), cleaved caspase-3 (Asp175) (Cell Signaling Technology, Danvers, MA, USA), LAMP1 (Cell Signaling Technology), VDAC (voltage-dependent anion channel, Cell Signaling Technology), Complex IV (Cell Signaling Technology), Iba-1 (Wako Chemicals, Richmond, VA, USA), and secondary antibodies conjugated with Alexa Fluor 488 and Alexa Fluor 594 (Invitrogen, Carlsbad, CA, USA) as described previously (Saito et al. 2007b) with modifications as follows. Brain sections were heated in 10 mM sodium citrate buffer (pH 6.0) for 5 min for unmasking antigens and treated with 10% methanol in Tris-buffered saline (TBS, pH 7.4) for 10 min and with 0.2% Tween 20 in TBS for 5 min. After blocking in TBS with 5% bovine serum albumin (BSA) for 30 min, sections were incubated at 4°C overnight with anti-GM2 antibody in TBS containing 2% BSA. Then, sections were treated with another primary antibody in TBS with 2% BSA for 2 h, rinsed, and incubated with secondary antibodies conjugated with Alexa Fluor 488 or Alexa Fluor 594 in TBS containing 1% normal goat serum and 0.2% BSA for 1 h. All photomicrographs were taken through a 10X, 40X, or 100X objective with a Nikon Eclipse TE2000 inverted microscope attached to a digital camera DXM1200F.
Electron microscopy
For conventional electron microscopy (EM), isolated subcellular fractions were fixed in a mixture of 2% glutaraldehyde and 4% paraformaldehyde in 0.1M sodium cacodylate buffer (pH 7.2). Pellets of the fractions were post fixed in 1% osmium tetroxide and processed for electron microscopy as described previously (Yu et al. 2005). Images were captured using Philips CM10 electron microscope equipped with a digital camera (Hamamatsu; model C4742-95) using the Advantage charge-coupled device camera system software (Advanced Microscopy Techniques).
Immunoblotting
Samples (30 µg protein each) from different subcellular fractions were boiled in SDS-sample buffer, separated on 10% or 15% SDS-PAGE, and blotted onto nitrocellulose membranes. The membranes were then blocked with Odyssey blocking buffer (LI-COR Biosciences) with 0.1% Tween 20 and probed with primary antibodies against VDAC (Cell Signaling Technology), LAMP1 (Cell Signaling Technology), β-glucosidase (Cell Signaling Technology), cathepsin D (a kind gift from Dr. Mohan Panaiyur, Nathan Kline Institute), Rab5 (Cell Signaling Technology), Rab7 (Cell Signaling Technology), LC3B (Cell Signaling Technology), PSD95 (Cell Signaling Technology), flotillin (BD Transduction laboratories, San Diego, CA, USA), BiP78 (Cell Signaling Technology), GM130 (Cell Signaling Technology), and Na+-K+-ATPase antibody (Cell Signaling Technology), as described previously (Saito et al. 2007a). Antigens were detected by the Odyssey infrared imaging system using fluorescence-labeled secondary antibodies, IR dye 680 conjugated goat anti-rabbit IgG (Invitrogen) and IR dye 800 conjugated goat anti-mouse IgG (Rockland Immunochemicals, Gilbertsville, PA, USA). The amount of protein was measured by a BCA method (Pierce, Rockford, IL, USA).
Cytochrome c release assay from isolated mitochondria
Mitochondria-enriched fraction (230 µg protein) was incubated for 1 h at 37°C with 300 µM of various gangliosides [GM2 (purified from Tay-Sachs brains), GM1 (Fidia Research Laboratories, Abano Terve, Italy), GD3 (purified from cream of bovine milk by the method of Jennermann and Wiegandt 1994)] in 100 µl buffer containing 200 mM sucrose, 10 mM Tris-MOPS (pH 7.4), 5 mM Tris-succinate, 1 mM Tris-phosphate, 2 µM rotenone, and 10 µM Tris-EDTA, as described by Rippo et al. (2000). The reaction mixture was centrifuged at 15,000×g and the supernatant (S) was analyzed by immunoblotting using anti-cytochrome c antibody (Cell Signaling Technology). Levels of VDAC in the precipitates (P) were measured as mitochondrial loading controls.
Statistics
Values in Figures are expressed as mean ± Standard Error of Mean (SEM) obtained from 4–10 samples. Statistical analysis of the data was performed by two-tailed Student’s t test and ANOVA with Bonferroni’s post hoc test using the SPSS 11.0 program. A p value of <0.05 was considered significant.
Results
GM2 elevation in the brain of P7 mice exposed to ethanol
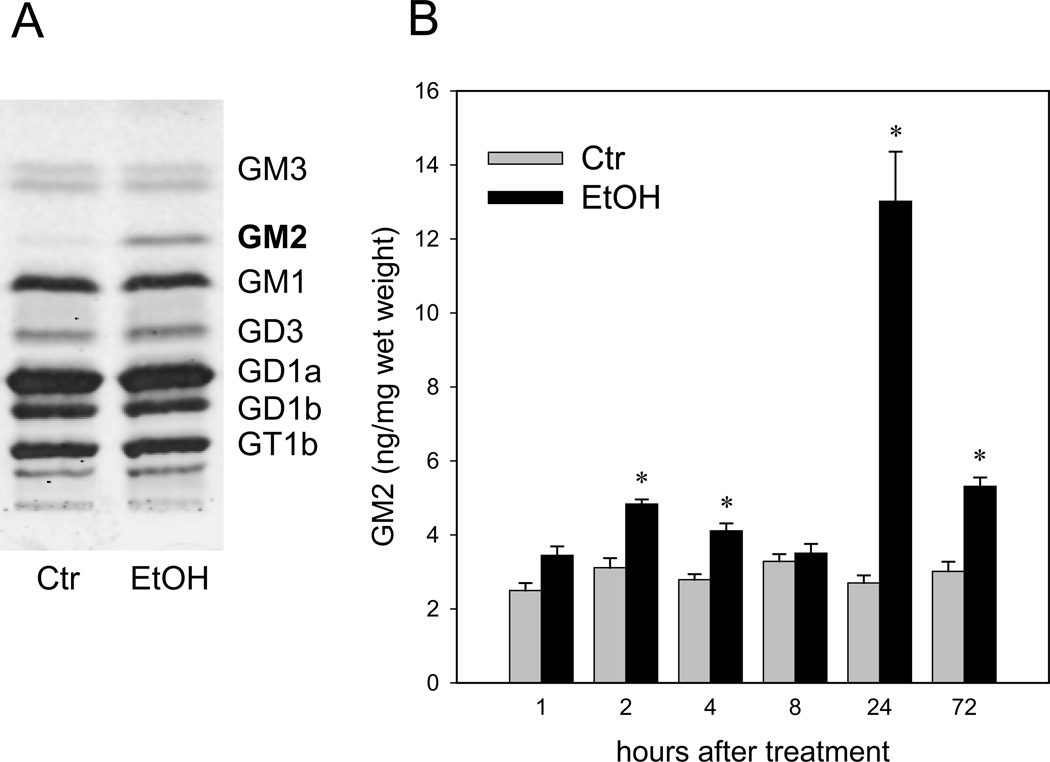
Under the ethanol-treatment conditions that induce wide-spread apoptotic neurodegeneration within a day in the P7 brain (Olney et al. 2002; Saito et al. 2007b), the effects of ethanol on brain gangliosides were examined. As shown in Figure 1A, the level of GM2 increased dramatically 24 h after ethanol (EtOH) exposure, although GM2 was a minor ganglioside in the control (Ctr) brain. The levels of major gangliosides, such as GD1a, GD1b, and GM1, were unchanged. Time course studies of GM2 content in the brain (Figure 1B) indicated that a small transient increase around 2 h after ethanol treatment was followed by a robust increase around 24 h, and a smaller but a significant increase persisted 72 h after ethanol exposure.
Figure 1.
Elevation of GM2 ganglioside in the P7 mouse brain exposed to ethanol. A: Gangliosides isolated from the brain of mice sacrificed 24 h after the saline (Ctr) or ethanol (EtOH, 5.0 mg/kg, once) injection were analyzed on HPTLC. In a representative picture shown here, gangliosides from 20 mg (wet weight) brain samples were separated in each lane. B: Gangliosides isolated from mice sacrificed 1 to 72 h after saline (Ctr) or ethanol (EtOH, 5.0 g/kg, once) injection were separated by HPTLC as shown in A and quantified as described in Materials and Methods. Values, presented as ng/mg wet weight, are mean ± SEM for four to six animals. *Significantly (P< 0.001) different between the ethanol and control groups by Student’s t-test after Bonferroni’s correction.
Subcellular fractionation studies of GM2 distribution in the P7 brain
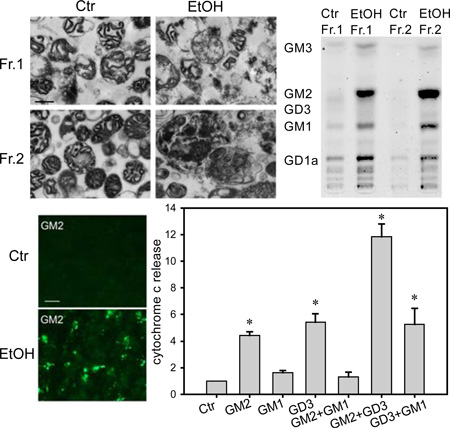
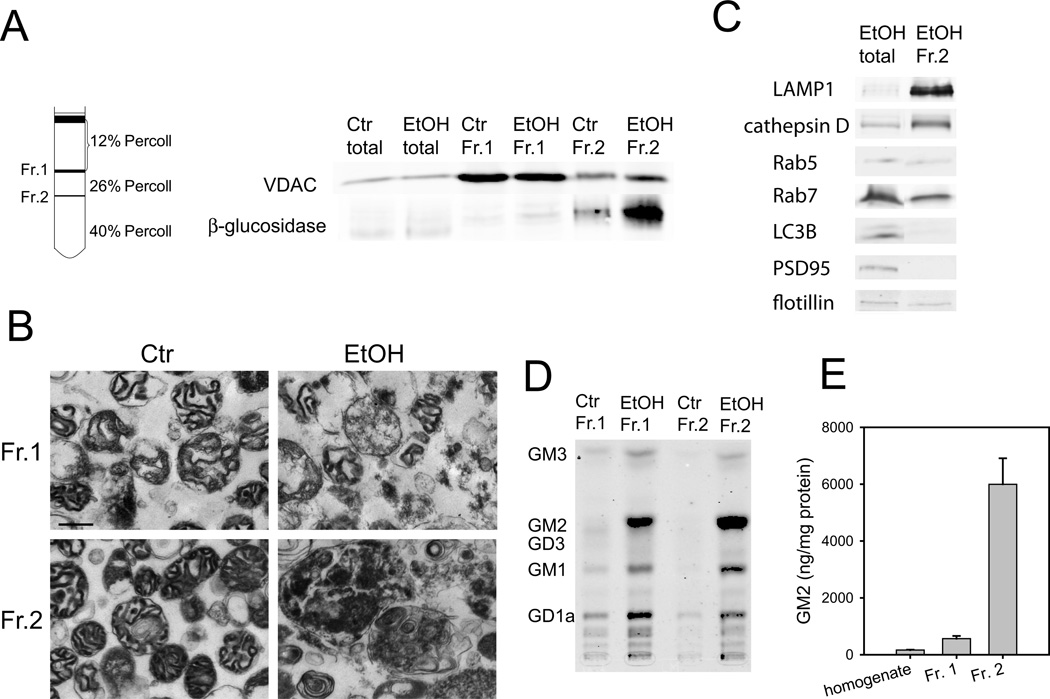
It has been shown that sphingolipids, such as ceramide, GD3, and GM1, increase in mitochondria during apoptosis and are involved in the mitochondria-mediated apoptotic pathway (Rippo et al. 2000; Birbes et al. 2002; Sano et al. 2009). Because ethanol is known to induce mitochondria-dependent apoptosis in the P7 mouse brain, we examined whether GM2 elevation occurs in mitochondria. The mitochondria-enriched fraction was isolated using the Percoll gradient centrifugation according to the method of Rajapakse et al. (2001) with a slight modification as described in Materials and Methods. In agreement with the previous study for the P7 rat brain (Rajapakse et al. 2001), VDAC, a mitochondrial marker, was enriched in a major band (fraction 1, Fr. 1) with the Percoll density between 12 and 26% in both control and ethanol-treated brains (Figure 2A). Protein yields of fraction 1 were similar between control and ethanol samples: the ratio of ethanol to control samples was 1.06 ± 0.02 (mean ± SEM, n=5). In addition, a minor band (fraction 2, Fr. 2) with the Percoll density between 26–40%, where adult brain mitochondria are known to be localized (Rajapakse et al. 2001), was slightly enriched in VDAC and β-glucosidase (a lysosomal marker) in the control brain. However, fraction 2 from ethanol samples, was remarkably enriched in β-glucosidase, while the concentration of VDAC was less than that of fraction 1 (Figure 2A). Also, the protein yield of fraction 2 from ethanol samples was much higher than that from control samples [the ratio of ethanol to control: 3.61 ± 0.08 (mean ± SEM, n=5)]. In agreement with these subcellular marker studies, electron microscopic examination (Figure 2B) indicated that fraction 1 from both control and ethanol-treated brains and fraction 2 from control brains were enriched in mitochondria, although mitochondria isolated from ethanol-treated brains appeared to be damaged. In contrast, fraction 2 from ethanol-treated brains was enriched in large lysosome-like structures filled with membranous and vesicular inclusions. As shown in Figure 2C, fraction 2 from ethanol-treated brain was also enriched in other lysosomal markers, LAMP1 and cathepsin D. Levels of LC3B (an autophagosome marker), and PSD95 (a synaptic marker) were lower than, and levels of Rab5 (an early endosomal marker), Rab7 (a late endosomal marker), and flotillin (a lipid raft marker) were similar to those of total homogenates.
Figure 2.
GM2 in mitochondria-enriched and lysosome-enriched fractions. A: Homogenates of P7 mouse brains taken 24 h after saline or ethanol treatment were fractionated on Percoll density gradient as described in Materials and Methods. Total homogenate (total), fraction 1 (Fr. 1), and fraction 2 (Fr. 2) (30 µg protein each) were analyzed by immunoblots using anti-VDAC and anti-β-glucosidase antibody. B: Fr. 1 and Fr. 2 isolated from control and ethanol-treated brains were examined by electron microscopy. The bar indicates 500 nm. C: The cell organelle marker distribution was further analyzed for Fr. 2 from the ethanol-treated brain using markers for lysosome (LAMP1, cathepsin D), early endosome (Rab5), late endosome (Rab7), autophagosome (LC3B), synaptic marker (PSD95), and lipid rafts (flotillin). 50 µg protein for total homogenate and 20 µg protein for Fr. 2 were analyzed. D: Gangliosides of Fr.1 and Fr. 2 isolated from control (Ctr) and ethanol (EtOH) brains were analyzed by HPTLC. The protein amounts used for Fr. 1 (Ctr), Fr. 1 (EtOH), Fr. 2 (Ctr), and Fr. 2 (EtOH) were 270 µg, 297 µg, 30 µg, and 110 µg, respectively. E: Levels of GM2 (mean ± SEM, ng/mg protein) in homogenates, Fr. 1, and Fr. 2 from the ethanol-treated brain were quantified using four sets of HPTLC analyses, such as the one shown in D.
Next, we examined ganglioside patterns of fraction 1 and 2 from the control and ethanol-exposed brain. Figure 2D shows a HPTLC pattern of gangliosides isolated from each fraction, using 270 µg, 297 µg, 30 µg, and 110 µg protein for Fr. 1 (Ctr), Fr. 1 (EtOH), Fr. 2 (Ctr), and Fr. 2 (EtOH), respectively. The result indicates that GM2 was highly accumulated in both fraction 1 and fraction 2 from ethanol-treated brains. GM2, a minor ganglioside in the total brain (Figure 1A), was the most abundant in these fractions. As shown in Figure 2E, amounts of GM2 in total homogenate, fraction 1, and fraction 2 of ethanol-treated brains were 164.1±13.3, 563.3±95.6, and 5,997±913 (mean ± SEM) ng/mg protein, respectively, while GM2 in fraction 1 and 2 of control brains was undetectable. There were slight increases in other gangliosides in these fractions. The order of increases, GM2>GM1>GD1a, in fraction 2 (lysosome-like structure) may indicate GM2 as a degradation product of higher glycosylated gangliosides, while the ganglioside pattern of fraction 1, which was similar to that of the whole brain except for the enrichment in GM2, may suggest minor contamination of membrane fractions, such as lipid rafts, in fraction 1 of ethanol samples.
These results indicate that ethanol-induced accumulation of GM2 occurred in a mitochondria-enriched fraction as well as in a late endosome/lysosome-enriched fraction. The large lysosome-like structures with membranous and vesicular inclusions in the latter fraction appeared to be specifically increased by ethanol treatment (Figure 2D), although amounts of lysosomal proteins in total brain homogenates were not significantly different between saline- and ethanol-treated brains: ratios of ethanol samples divided by control samples were 1.05±0.13, 1.23±0.07, and 1.19±0.07 for LAMP1, β-glucosidase, and cathepsin D, respectively.
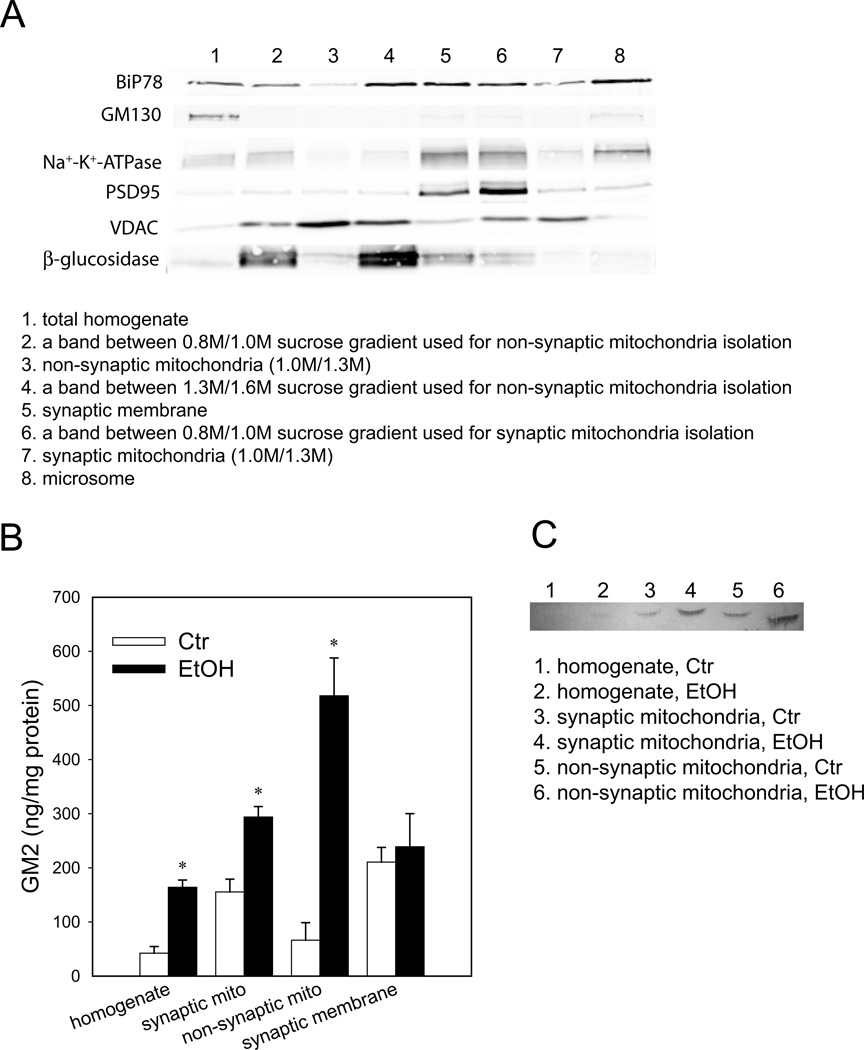
It was noticed that fraction 1, although enriched in mitochondria, contained low levels of maker proteins for synaptosomes and lysosomes (data not shown). Therefore, synaptic and non-synaptic mitochondria fractions were purified more rigorously using a method of Kiebish et al. (2008) with modification as described in Figure 3. The mitochondrial fractions thus purified showed little contamination from other subcellular organelle markers: BiP78 (endoplasmic reticulum), GM130 (Golgi apparatus), Na+-K+-ATPase (plasma membrane), PSD95 (synaptic membrane), and β-glucosidase (lysosome) (Figure 4A). As shown in Figure 4B, GM2 also increased in these purified synaptic and non-synaptic mitochondrial fractions from ethanol-treated brains, although the possible cross-contamination between these two fractions cannot be excluded. There was no increase in GM2 in the synaptic membrane. The ethanol-induced GM2 elevation in mitochondrial fractions was also detected by a TLC overlay method using a mouse monoclonal anti-GM2 antibody (Figure 4C).
Figure 3.
Protocol for isolation of synaptic and non-synaptic mitochondria from the P7 mouse brain. Synaptic and non-synaptic mitochondria were isolated from the P7 mouse brain using the method of Kiebish et al. (2008) with modification as described in Materials and Methods. Major changes were: 1) synaptosomal and mitochondrial fractions were separated using 4/6/10% Ficoll gradient, 2) both synaptic and non-synaptic mitochondria were isolated from the interface of 1.0 M and 1.3 M sucrose gradient, and 3) non-synaptic mitochondria fraction was further purified using the Percoll gradient as described in Materials and Methods.
Figure 4.
Elevation of GM2 in purified mitochondria from the ethanol-treated brain. A: Distribution of subcellular organelle markers in several fractions including purified non-synaptic and synaptic mitochondria, synaptic membranes, and microsomes was analyzed by immunoblots. 30 µg protein was loaded in each lane. B: Amounts of GM2 were measured in total homogenate, purified synaptic and non-synaptic mitochondria, and synaptic membranes from control and ethanol-treated brains as described in Materials and Methods. Values, presented as ng/mg protein, are mean ± SEM for 4 samples. *Ethanol significantly increased the amounts of GM2 in homogenate (p=0.0003), synaptic mitochondria (p=0.0013), and non-synaptic mitochondria (p=0.0025), when assessed by Student’s t-test. C: GM2 in homogenate and purified mitochondria fractions from control (Ctr) and ethanol (EtOH)-treated brains were analyzed by TLC overlay method as described in Materials and Methods. Each fraction containing 100 µg protein was loaded on HPTLC.
Immunohistochemical studies indicating GM2 accumulation in microglia
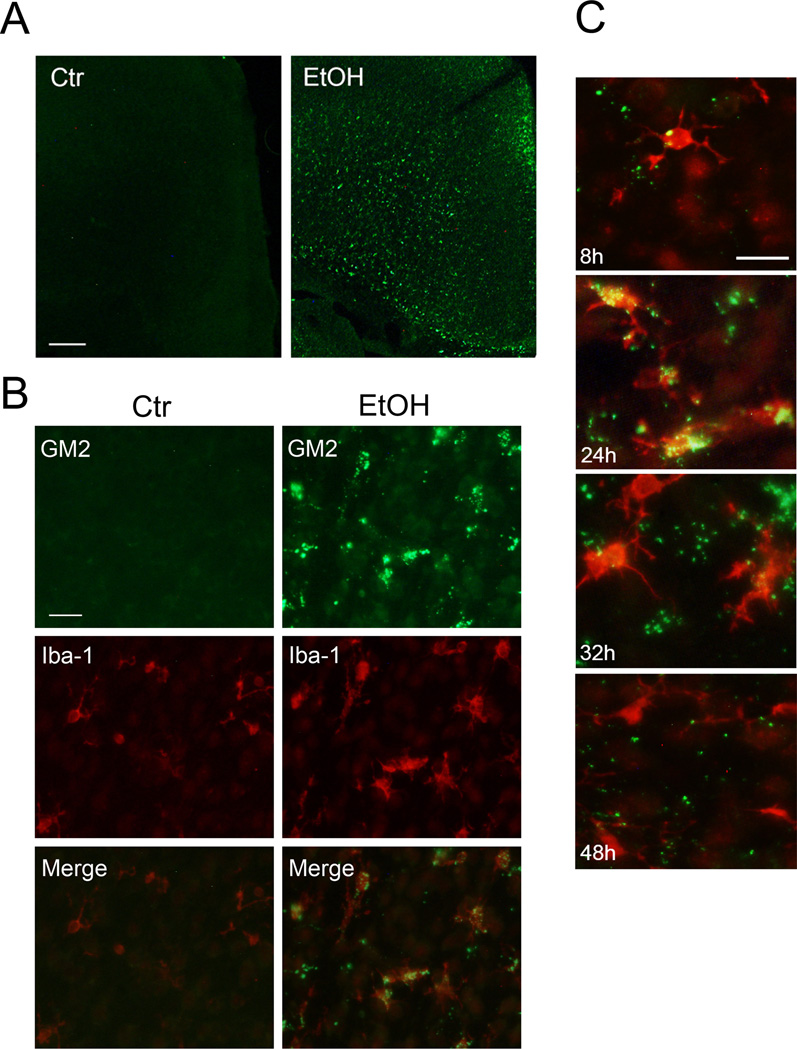
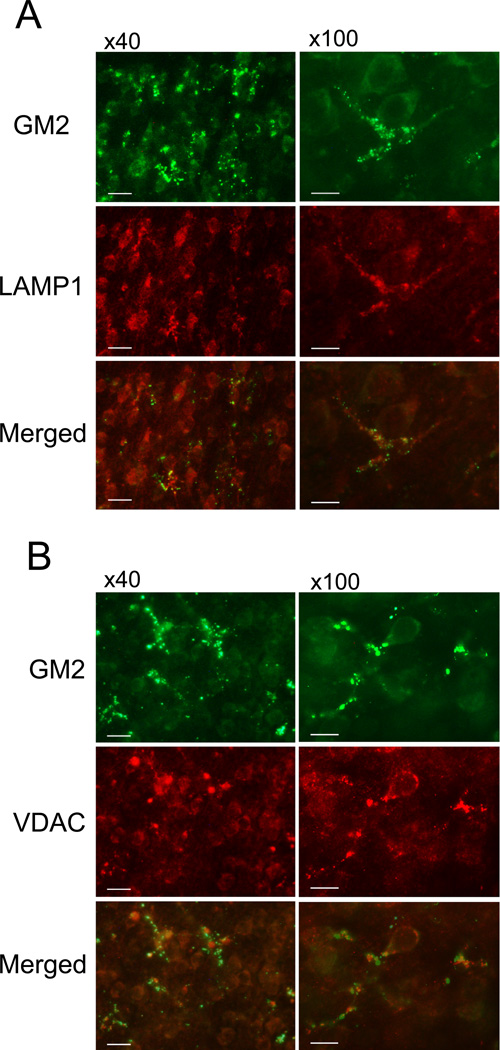
Ethanol-induced elevation in GM2 expression in the P7 brain was also demonstrated by immunofluorescence labeling of brain sections using anti-GM2 antibody. One day after ethanol exposure, GM2 staining was observed throughout the ethanol-treated brain while the staining was hardly detected in the control brain (Figures 5A, B). GM2 staining was particularly strong in the cingulum and the cingulate/retrosplenial cortex regions. Figure 5A shows the cingulate cortex region. Although some staining was observed in neurons as judged by morphology, aggregates of punctate GM2 staining were generally overlapped with microglia recognized by anti-Iba-1 antibody (Figure 5B). These microglia containing GM2 appeared to be activated morphologically in comparison to the microglia in control brains (Figure 5B), which had smaller cell bodies and thinner processes, resembling the primitive ramified microglia (Kadowaki et al. 2007). Our previous studies (Saito et al. 2010b) have shown that 4 h after ethanol exposure, microglia exhibited thicker processes, and 16–24 h after ethanol exposure, cells became brain macrophage-like with a few short processes and appeared to engulf degenerating neurons. Figure 5C indicates that localization of GM2 in microglia also occurred strongly 24 h after ethanol treatment. However, GM2 was hardly detected in the microglia that morphologically appeared to be resting microglia and became predominant around 48 h after ethanol treatment, while some punctate GM2 staining was still observed outside of the microglia. Figure 6A indicates that, 24 h after ethanol treatment, GM2 in microglia was partially co-localized with LAMP1, a lysosomal/phagosomal/late endosomal marker. This observation, combined with results shown in Figure 2, suggest that GM2 was localized in late endosomes/phagolysosomes in the activated microglia. Also, some of the aggregates of GM2 staining were partially co-localized with VDAC, a mitochondrial protein (Figure 6B). Based on analyses of isolated subcellular fractions (Figures 2, 4), GM2 was probably present in both mitochondria and lysosomes/late endosomes/phagolysosomes fractions.
Figure 5.
GM2 expression in microglia in the ethanol-treated brain. A: One day after saline (Ctr) or ethanol (EtOH) treatment, brains were perfusion-fixed, and the coronal sections were immunostained using anti-GM2 antibody. The representative image shows the cingulate cortex region. The bar indicates 200 µm. B: Brain sections described in A were dual-labeled using anti-GM2 antibody and anti-Iba-1 antibody. The bar indicates 20 µm. C: Brains were perfusion-fixed 8 h, 24 h, 36 h, and 48 h after ethanol treatment, and the sections were dual-labeled using anti-GM2 antibody and anti-Iba-1 antibody. The bar indicates 20 µm.
Figure 6.
Partial co-localization of GM2/LAMP1 and GM2/VDAC. Brains were perfusion-fixed 24 h after ethanol treatment, and the sections were dual-labeled with anti-GM2 antibody and anti-LAMP1 antibody (A) or dual-labeled with anti-GM2 antibody and anti-VDAC antibody (B). 40X and 100X objectives were used for the left panel and the right panel, respectively. The bar in the left panel indicates 20 µm, and the bar in the right panel indicates 10 µm.
GM2 elevation in activated caspase-3 positive neurons and subcellular localization of neuronal GM2
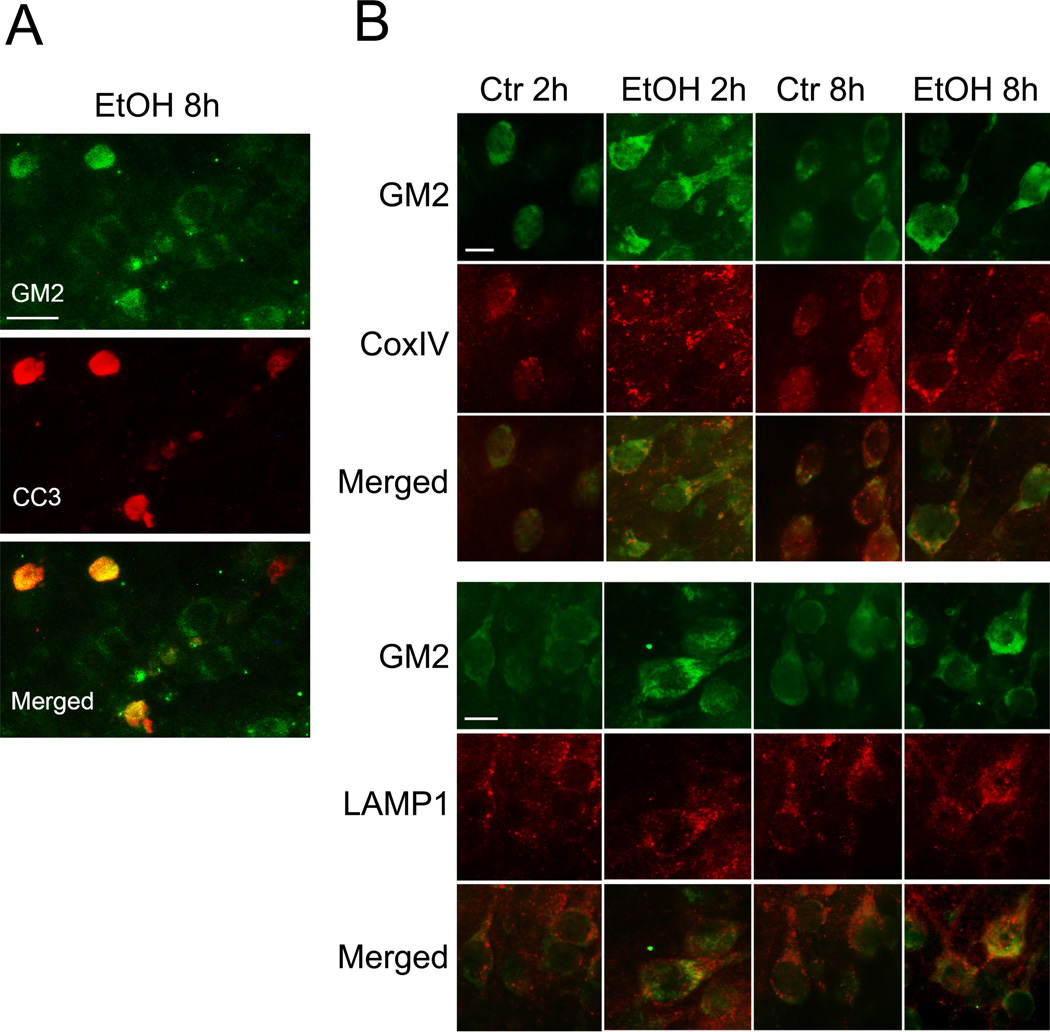
Eight hours after ethanol exposure, when neuronal caspase-3 activation is maximum (Olney et al. 2002; Saito et al. 2007b) and phagocytic microglia are still few (Saito et al. 2010b), GM2 staining observed was mostly in neurons judged by the morphology (Figures 7A,B). As shown in Figure 7A, the intensity of GM2 staining increased in some of the cleaved (activated) caspase-3 (CC3)-positive cells. These apoptotic cells are likely to be neurons because our previous studies have demonstrated that ethanol-induced caspase-3 activation in the P7 mouse brain occurs mostly in neurons (Saito et al. 2007b). Enhanced GM2 staining was also observed in some neurons 2 h after ethanol treatment (Figure 7B). Such enhanced GM2 staining observed 2 h and 8 h after ethanol treatment was partially co-localized with complex IV (Cox IV), a mitochondrial marker (Figure 7B). Also, partial co-localization of GM2 with LAMP1 staining was observed in some neurons that showed enhanced GM2 expression (Figure 7B).
Figure 7.
Enhanced GM2 expression in neurons. A: Brains were perfusion-fixed 8 h after ethanol treatment, and the sections were dual-labeled with anti-GM2 antibody and anti-cleaved caspase-3 (CC3) antibody. The bar indicates 20 µm. B: Brains were perfusion-fixed 2 h and 8 h after ethanol treatment, and the sections were dual-labeled with anti-GM2 antibody and anti-complex IV (CoxIV) antibody, or dual-labeled with anti-GM2 antibody and anti-LAMP1 antibody. The bar indicates 10 µm.
GM2-induced cytochrome c release from isolated mitochondria
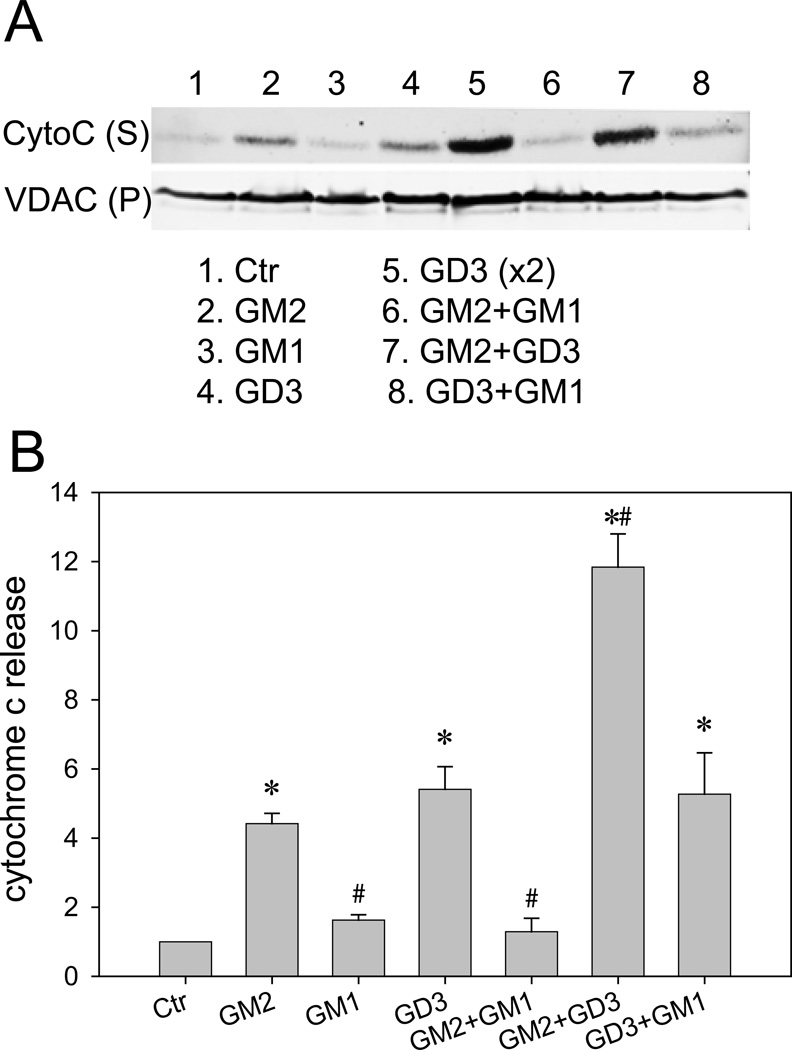
The above studies indicating the elevation of GM2 in apoptotic neurons and the partial localization of GM2 in mitochondria raise the possibility that GM2 in mitochondria may be involved in ethanol-induced apoptosis. Using mitochondria isolated from P7 mouse brains by the method of Rajapakse et al. (2001) (Fraction 1 in Figure 2A), the effects of GM2 on cytochrome c release from mitochondria were tested using the conditions described by Rippo et al. (2000). As shown in Figure 8A, fraction 1 was incubated with GM2, GM1, GD3, or the combination of these gangliosides. After 1 h incubation at 37°C, the reaction mixture was centrifuged, and the release of cytochrome c into the supernatant (S) was analyzed by Western blots. The amounts of mitochondria in the precipitate (P) were similar judged by the levels of VDAC. Figure 8B shows quantitative results obtained from four sets of Western blots. Results indicate that GM2 induced cytochrome c release from mitochondria. Also, GD3 induced cytochrome c release in agreement with previous studies (Scorrano et al. 1999; Rippo et al. 2000; Inoki et al. 2000; Garcia-Ruiz et al. 2002; Malorni et al. 2007). While GM1 itself did not induce significant changes, it inhibited cytochrome c release triggered by GM2 but not by GD3 (Figure 8B). Thus, our experiments suggest that GM2 elevation in mitochondria by ethanol induces cytochrome c release from mitochondria.
Figure 8.
The effects of GM2 on cytochrome c release from isolated mitochondria. Mitochondria-enriched fraction isolated from P7 mouse brain was incubated with GM2, GM1, GD3 or the combination of these gangliosides as described in Materials and Methods. After the reaction, the reaction mixture was centrifuged and the supernatant (S) was analyzed by immunoblotting using anti-cytochrome c antibody. Levels of VDAC in the precipitates (P) were measured as mitochondrial loading controls. A: A representative Western blot shows the effects of GM2 (300 µM), GM1 (300 µM), GD3 (300 µM), GD3(x2) (600 µM), GM2+GM1 (300 µM each), GM2+GD3 (300 µM each), and GD3+GM1 (300 µM each) on cytochrome c release from mitochondria. B: Levels of released cytochrome c were quantified using four sets of Western blots. Values, presented as the ratio of the ganglioside-treated sample to the control sample, are mean ± SEM. *Significantly different from the control, and #significantly different from GM2-treated samples by ANOVA with Bonferroni’s post hoc test.
Discussion
The present study demonstrated that ethanol exposure in P7 mice, which induces robust neurodegeneration, simultaneously increased GM2 ganglioside in the brain (Figure 1). The elevation of GM2 was observed initially in apoptotic neurons (Figure 7) and later in activated microglia (Figure 5). Collective results suggested that GM2 was present in both mitochondria and lysosomes/phagolysosomes in neurons and activated microglia in the ethanol-exposed brain, although GM2 expression was stronger in activated microglia than that in neurons. Combined with in vitro experiments indicating GM2-induced cytochrome c release from isolated mitochondria (Figure 8), the involvement of GM2 in ethanol-induced apoptotic neurodegeneration was implicated.
Although GM2 was very low in the normal brain compared to more complex gangliosides, such as GD1a and GT1b, ethanol specifically increased the level of GM2 in the P7 mouse brain (Figure 1A). The accumulation of GM2 has been also reported in several neurodegenerative diseases (Constantopoulos et al. 1978; Hara et al. 1984; Zervas et al. 200; Piccinini et al. 2010; Stromme et al. 2011). Although roles of the accumulated GM2 are largely unknown, neuroapoptosis is observed in GM2 gangliosidosis that accumulates high levels of GM2 in the brain (Huang et al. 1997), and the reduction in brain levels of GM2 appears to delay the onset of neurological dysfunction in Sandhoff disease and Niemann-Pick disease (Jeyakumar et al. 1999; Zervas et al. 2001). Also, GM2 may cause neurological dysfunction through ectopic dendrites formation observed in several neuronal storage diseases (Walkley 2003). Ethanol-induced GM2 elevation observed in our present study may be relevant to the accumulation of GM2 in these diseases, although ethanol triggers acute neurodegeneration in contrast to the chronic nature of these diseases.
Our study indicated that ethanol-induced robust elevation in GM2 occurred in activated microglia 24 h after ethanol treatment (Figure 5C). Activated microglia are known for playing a role in phagocytic clearance of dead neurons/apoptotic bodies (Stolzing and Grune 2004; Sokolowski and Mandell 2011). It is highly probable that GM2 derived from phagocytosed degenerating neurons accumulates in lysosomes/phagosomes of activated microglia, because: 1) strong GM2 staining was localized in activated microglia 24 h after ethanol exposure (Figure 5C), when robust neurodegeneration is observed by silver staining (Olney et al. 2002; Saito et al. 2007a), and activated microglia are vigorously engulfing degenerating neurons (Saito et al. 2010b), 2) GM2 was co-localized with LAMP1, a late endosomal/lysosome/phagolysosome marker, in microglia (Figure 6), 3) subcellular fractionation studies indicated that 24 h after ethanol exposure GM2 was highly accumulated in a lysosome-enriched fraction, which was predominantly found in ethanol-treated brains (Figure 2), and 4) resting microglia (identified by the morphology) did not show GM2 accumulation (Figure 5C). The accumulated GM2 in microglia may be derived from GM2 increased in apoptotic neurons (Figure 7) and also from higher glycosylated gangliosides (GD1a, GT1b, etc.) abundant in these neurons. However, the possibility that activated microglia produce GM2 by do novo synthesis or as a metabolite of their own gangliosides cannot be ruled out. Although GM2 was not detected in seemingly resting microglia 48 h after ethanol treatment (Figure 5C), GM2 staining was still observed outside of microglia. The localization of such GM2 staining remains to be elucidated. The cause of accumulation of GM2 in microglia is unclear. In lysosomal storage diseases such as Sandhoff disease and Niemann-Pick disease, it has been indicated that accumulated GM2 in neurons are localized mainly in lysosomes/late endosomes because of defective lysosomal degradation and/or defective trafficking of gangliosides from endosomes to the Golgi apparatus (Marks and Pagano 2002; Vitner et al. 2010) or from late endosomes to lysosomes (Tancini et al. 2009; Lloyd-Evans and Platt 2010). Ethanol has been shown to induce perturbation in endocytic processes of sphingolipids (Tomas et al. 2004; Ravasi et al. 2002), which may be related to the observed GM2 accumulation in a late endosome/lysosome/phagolysosome fraction of the brain. Such accumulated GM2 may affect microglial cell fate and the related inflammatory processes, because GM2 is known to promote T cell apoptosis and to lead to immune dysfunction (Molotkovskaya et al. 2000; Biswas et al. 2009).
In addition to GM2 accumulation in microglia, GM2 immunoreactivity was increased in neurons (and possibly in other cell types). Activated caspase-3 positive neurons showed particularly higher expression of GM2 (Figure 7A). Such GM2 appears to be partially localized in mitochondria as well as in lysosomes/late endosomes (Figure 7B). However, co-localization of GM2 with these organelles in neurons remains to be confirmed using different methods, such as immunoelectron microscopy. Although subcellular fractionation studies at 24 h after ethanol treatment indicated that GM2 was enriched in mitochondria and lysosomes/late endosomes (Figures 2, 4), similar studies using brains taken at earlier time points (within 8 h), when activated microglia are still few (Saito et al. 2010b), may be necessary to examine neuronal subcellular localization of GM2. Relevant here as well are our previous studies showing that ethanol induces GM2 elevation in cultured neurons (Saito et al. 2005). The subcellular localization studies of the increased GM2 in these neurons may be important.
Ethanol-induced elevation of neuronal GM2 in the P7 brain at early time points may be caused by enhanced GM2 synthesis, because ethanol increases lipogenesis and de novo ceramide synthesis (Saito et al. 2005, 2007a, 2010a). The preferential increase in GM2 among various neuronal gangliosides may be caused by perturbed glycosyltransferase activities and/or fatty acid compositions caused by ethanol treatment (Duffy et al. 1991; Berrettini et al. 2004; Garige et al. 2006). Also, it is possible that GM2 accumulates as degradative products in endosomal systems due to perturbed endocytic and sorting processes of sphingolipids by ethanol (Ravasi et al. 2002; Tomas et al. 2004). Finally, GM2 would be transported to mitochondria from other subcellular organelles, such as the Golgi network, endosomal systems, and lipid rafts, which may slow down its synthetic or degradative processing. While most of the gangliosides are localized in lipid rafts, trafficking of gangliosides and their subcellular localization can be altered under cellular stress/pathological conditions. For example, in an animal model of GM1 gangliosidosis, GM1, which is primarily accumulated in lysosomes, is also elevated in the lipid rafts of mitochondria-associated ER membranes (MAM), causing mitochondria-mediated apoptosis in neuronal cells (Sano et al. 2009). Also, an intracellular movement of gangliosides toward mitochondria is observed during apoptosis triggered by the activation of death receptors (Rippo et al. 2000), and direct interaction of GD3 with mitochondria induces cytochrome c release and caspase-3 activation (Garcia-Ruiz et al. 2002). Our in vitro mitochondrial studies indicated that GM2 as well as GD3 increased cytochrome c release from mitochondria isolated from P7 mouse brains (Fig. 8). It has been shown that ethanol-induced neurodegeneration in the developing brain involves mitochondria-mediated apoptosis that is associated with cytochrome c release and caspase-3 activation (Olney et al. 2002; Young et al. 2003). Therefore, GM2 elevation in mitochondria and the enhanced cytochrome c release from mitochondria by GM2 suggest the involvement of GM2 in ethanol-induced mitochondrial apoptosis. Although GD3 may also be involved, ethanol hardly increased GD3 in the mitochondrial fraction (Figure 2). In contrast to our results, Inoki et al. (2000) have reported that monosialogangliosides including GM2 do not induce cytochrome c release from isolated adult rat liver mitochondria, while disialogangliosides including GD3 induce cytochrome c release. Such discrepancy may be caused by differences in experimental conditions used in these studies, such as differences in the origins of isolated mitochondria and the concentrations of gangliosides. For example, developmental stages of isolated mitochondria may influence the results, because mitochondria in the neonatal brain show unique characteristics, such as higher Ca2+ storage capacity, compared to those in the adult brain (Schonfeld and Reiser 2007; Novgorodov et al. 2011). Interestingly, GM1, which attenuates ethanol-induced apoptosis in the P7 mouse brain (Saito et al. 2007b) and in cultured neurons (Saito et al. 1999), inhibited cytochrome c release induced by GM2 (Figure 8). Combined with our previous studies indicating a role of ceramide in ethanol-induced neuroapoptosis (Saito et al. 2010a) and the protective effect of GM1 against the apoptosis (Saito et al. 1999, 2007b), the present study, suggesting the involvement of GM2 in this process, implies that the balance of these sphingolipids in cells, specifically in mitochondria, may be an important factor in determining cell death versus survival.
Acknowledgements
This work was supported by NIH/NIAAA R01 AA015355 to M.S.
Abbreviations
- FASD
fetal alcohol spectrum disorders
- P7
postnatal day 7
- HPTLC
high-performance thin layer chromatography
- VDAC
voltage-dependent anion channel
Footnotes
The authors have no conflict of interest to disclose.
References
- Ariga T, Yu RK. Ganglioside analysis by high-performance thin layer chromatography. Methods Enzymol. 2000;312:115–134. doi: 10.1016/s0076-6879(00)12903-9. [DOI] [PubMed] [Google Scholar]
- Berrettini M, Fedeli D, Falcioni G, Bevilacqua C, Massi M, Polidori C. Hippocampal and striated skeletal muscle changes in fatty acid composition induced by ethanol in alcohol-preferring rats. Toxicology. 2004;199:161–168. doi: 10.1016/j.tox.2004.02.023. [DOI] [PubMed] [Google Scholar]
- Birbes H, El Bawab S, Obeid LM, Hannun YA. Mitochondria and ceramide: intertwined roles in regulation of apoptosis. Advan Enzyme Regul. 2002;42:113–129. doi: 10.1016/s0065-2571(01)00026-7. [DOI] [PubMed] [Google Scholar]
- Biswas S, Biswas K, Richmond A, Ko J, Ghosh S, Simmons M, Rayman P, Rini B, Gill I, Tannenbaum CS, Finke JH. Elevated levels of select gangliosides in T cells from renal cell carcinoma patients is associated with T cell dysfunction. J Immunol. 2009;183:5050–5058. doi: 10.4049/jimmunol.0900259. [DOI] [PMC free article] [PubMed] [Google Scholar]
- Carloni S, Mazzoni E, Balduini W. Caspase-3 and calpain activities after acute and repeated ethanol administration during the rat brain growth spurt. J Neurochem. 2004;89:197–203. doi: 10.1111/j.1471-4159.2004.02341.x. [DOI] [PubMed] [Google Scholar]
- Constantopoulos G, Eiben RM, Schafer IA. Neurochemistry of the mucopolysaccharidoses: brain glycosaminoglycans, lipids and lysosomal enzymes in mucopolysaccharidosis type III B (alpha-N-acetylglucosaminidase deficiency) J Neurochem. 1978;31:1215–1222. doi: 10.1111/j.1471-4159.1978.tb06245.x. [DOI] [PubMed] [Google Scholar]
- Duffy O, Menez JF, Floch HH, Leonard BE. Changes in whole brain membranes of rats following pre- and post-natal exposure to ethanol. Alcohol Alcohol. 1991;26:605–613. doi: 10.1093/oxfordjournals.alcalc.a045164. [DOI] [PubMed] [Google Scholar]
- Farber NB, Creeley CE, Olney JW. Alcohol-induced neuroapoptosis in the fetal macaque brain. Neurobiol Dis. 2010;40:200–206. doi: 10.1016/j.nbd.2010.05.025. [DOI] [PMC free article] [PubMed] [Google Scholar]
- Garcia-Ruiz C, Colell A, Morales A, Calvo M, Enrich C, Fernandez-Checa JC. Trafficking of ganglioside GD3 to mitochondria by tumor necrosis factor-alpha. J Biol Chem. 2002;277:36443–36448. doi: 10.1074/jbc.M206021200. [DOI] [PubMed] [Google Scholar]
- Garige M, Azuine MA, Lakshman MR. Chronic ethanol consumption down-regulates CMP-NeuAc:GM3 alpha 2,8-sialyltransferase (ST8Sia-1) gene in the rat brain. Neurochem Int. 2006;49:312–318. doi: 10.1016/j.neuint.2006.02.001. [DOI] [PubMed] [Google Scholar]
- Guerri C, Bazinet A, Riley EP. Fetal alcohol spectrum disorders and alterations in brain and behaviour. Alcohol Alcohol. 2009;44:108–114. doi: 10.1093/alcalc/agn105. [DOI] [PMC free article] [PubMed] [Google Scholar]
- Hakomori S. Structure, organization, and function of glycosphingolipids in membrane. Curr Opin Hematol. 2003;10:16–24. doi: 10.1097/00062752-200301000-00004. [DOI] [PubMed] [Google Scholar]
- Han JY, Jeong JY, Lee YK, Roh GS, Kim HJ, Kang SS, Cho GJ, Choi WS. Suppression of survival kinases and activation of JNK mediate ethanol-induced cell death in the developing rat brain. Neurosci Lett. 2006;398:113–117. doi: 10.1016/j.neulet.2005.12.065. [DOI] [PubMed] [Google Scholar]
- Hara A, Kitazawa N, Taketomi T. Abnormalities of glycosphingolipids in mucopolysaccharidosis type III B. J Lipid Res. 1984;25:175–184. [PubMed] [Google Scholar]
- Huang JQ, Trasler JM, Igdoura S, Michaud J, Hanai N, Gravel RA. Apoptotic cell death in mouse models of GM2 gangliosidosis and observations on human Tay-Sachs and Sandhoff diseases. Hum Mol Gent. 1997;6:1879–1885. doi: 10.1093/hmg/6.11.1879. [DOI] [PubMed] [Google Scholar]
- Ieraci A, Herrera DG. Nicotinamide protects against ethanol-induced apoptotic neurodegeneration in the developing mouse brain. PLoS Med. 2006;3(4):e101. doi: 10.1371/journal.pmed.0030101. [DOI] [PMC free article] [PubMed] [Google Scholar]
- Ikonomidou C, Bittigau P, Ishimaru MJ, Wozniak DF, Koch C, Genz K, Price MT, Stefovska V, Horster F, Tenkova T, Dikranian K, Olney JW. Ethanol-induced apoptotic neurodegeneration and fetal alcohol syndrome. Science. 2000;287:1056–1060. doi: 10.1126/science.287.5455.1056. 0. [DOI] [PubMed] [Google Scholar]
- Inoki Y, Miura T, Kajimoto T, Kawase M, Kawase Y, Yoshida Y, Tsuji S, Kinouchi T, Endo H, Kagawa Y, Hamamoto T. Ganglioside GD3 and its mimetics induce cytochrome c release from mitochondria. Biochem Biophys Res Commun. 2000;276:1210–1216. doi: 10.1006/bbrc.2000.3601. [DOI] [PubMed] [Google Scholar]
- Jennemann R, Wiegandt H. A rapid method for the preparation of ganglioside Glac2 (GD3) Lipids. 1994;29:365–368. doi: 10.1007/BF02537191. [DOI] [PubMed] [Google Scholar]
- Jeyakumar M, Butters TD, Cortina-Borja M, Hunnam V, Proia RL, Perry VH, Dwek RA, Platt FM. Delayed symptom onset and increased life expectancy in Sandhoff disease mice treated with N-butyldeoxynojirimycin. Proc Natl Acad Sci USA. 1999;96:6388–6393. doi: 10.1073/pnas.96.11.6388. [DOI] [PMC free article] [PubMed] [Google Scholar]
- Kadowaki T, Nakadate K, Sakakibara S, Hirata K, Ueda S. Expression of Iba1 protein in microglial cells of zitter mutant rat. Neurosci Lett. 2007;411:26–31. doi: 10.1016/j.neulet.2006.07.079. [DOI] [PubMed] [Google Scholar]
- Keelan J, Bates TE, Clark JB. Intrasynaptosomal free calcium concentration during rat brain development: effects of hypoxia, aglycaemia, and ischaemia. J Neurochem. 1996;66:2460–2467. doi: 10.1046/j.1471-4159.1996.66062460.x. [DOI] [PubMed] [Google Scholar]
- Kiebish MA, Han X, Cheng H, Lunceford A, Clarke CF, Moon H, Chuang JH, Seyfried TN. Lipidomic analysis and electron transport chain activities in C57BL/6J mouse brain mitochondria. J Neurochem. 2008;106:299–312. doi: 10.1111/j.1471-4159.2008.05383.x. [DOI] [PMC free article] [PubMed] [Google Scholar]
- Ledeen RW, Yu RK. Gangliosides: structure, isolation, and analysis, in Methods in Enzymology. In: Ginsburg V, editor. Vol. 83. New York: Academic Press; 1982. pp. 139–191. [DOI] [PubMed] [Google Scholar]
- Ledeen RW, Wu G. Ganglioside function in calcium homeostasis and signaling. Neurochem Res. 2002;27:637–647. doi: 10.1023/a:1020224016830. [DOI] [PubMed] [Google Scholar]
- Lloyd-Evans E, Platt FM. Lipids on trial: the search for the offending metabolite in Niemann-Pick type C disease. Traffic. 2010;11:419–428. doi: 10.1111/j.1600-0854.2010.01032.x. [DOI] [PubMed] [Google Scholar]
- Malorni W, Giammarioli AM, Garofalo T, Sorice M. Dynamics of lipid raft components during lymphocyte apoptosis: the paradigmatic role of GD3. Apoptosis. 2007;12:941–949. doi: 10.1007/s10495-007-0757-1. [DOI] [PubMed] [Google Scholar]
- Marks D, Pagano RE. Endocytosis and sorting of glycosphingolipids in sphingolipid storage disease. Trends Cell Biol. 2002;12:605–613. doi: 10.1016/s0962-8924(02)02399-1. [DOI] [PubMed] [Google Scholar]
- Micsenyi MC, Dobrenis K, Stephney G, Pickel J, Vanier MT, Slaugenhaupt SA, Walkley SU. Neuropathology of the Mcoln1−/− knockout mouse model of mucolipidosis type IV. J Neuropathol Exp Neurol. 2009;68:125–135. doi: 10.1097/NEN.0b013e3181942cf0. [DOI] [PMC free article] [PubMed] [Google Scholar]
- Molotkovskaya IM, Kholodenko RV, Zelenova NA, Sapozhnikov AM, Mikhalev II, Molotkovsky JG. Gangliosides induce cell apoptosis in the cytotoxic line CTLL-2, but not in the promyelocyte leukemia cell line HL-60. Membr Cell Biol. 2000;13:811–822. [PubMed] [Google Scholar]
- Natoli EJ, Livingston PO, Pukel CS, Lloyd KO, Wiegandt H, Szalay J, Oettgen HF, Old LJ. A murine monoclonal antibody detecting N-acetyl- and N-glycolyl-GM2: Characterization of cell surface reactivity. Cancer Res. 1986;46:4116–4120. [PubMed] [Google Scholar]
- Novgorodov SA, Chudakova DA, Wheeler BW, Bielawski J, Kindy MS, Obeid LM, Gudz TI. Developmentally regulated ceramide synthase 6 increases mitochondrial Ca2+ loading capacity and promotes apoptosis. J Biol Chem. 2011;286:4644–4658. doi: 10.1074/jbc.M110.164392. [DOI] [PMC free article] [PubMed] [Google Scholar]
- Olney JW, Tenkova T, Dikranian K, Qin YQ, Labruyere J, Ikonomidou C. Ethanol-induced apoptotic neurodegeneration in the developing C57BL/6 mouse brain. Brain Res Dev Brain Res. 2002;133:115–126. doi: 10.1016/s0165-3806(02)00279-1. [DOI] [PubMed] [Google Scholar]
- Piccinini M, Scandroglio F, Prioni S, Buccinna B, Loberto N, Aureli M, Chigorno V, Lupino E, DeMarco G, Lomartire A, Rinaudo MT, Sonnino S, Prinetti A. Deregulated sphingolipid metabolism and membrane organization in neurodegenerative disorders. Mol Neurobiol. 2010;41:314–340. doi: 10.1007/s12035-009-8096-6. [DOI] [PubMed] [Google Scholar]
- Rajapakse N, Shimizu K, Payne M, Busija D. Isolation and characterization of intact mitochondria from neonatal rat brain. Brain Res Brain Res Protoc. 2001;8:176–183. doi: 10.1016/s1385-299x(01)00108-8. [DOI] [PubMed] [Google Scholar]
- Ravasi D, Ferraretto A, Omodeo-sale MF, Tettamanti G, Pitto M, Masserini M. Ethanol-induced increase of sphingosine recycling for ganglioside biosynthesis: a study performed on cerebellar granule cells in culture. J Neurosci Res. 2002;69:80–85. doi: 10.1002/jnr.10274. [DOI] [PubMed] [Google Scholar]
- Rippo MR, Malisan F, Ravagnan L, Tomassini B, Condo I, Costantini P, Susin SA, Rufini A, Todaro M, Kroemer G, Testi R. GD3 ganglioside directly targets mitochondria in a bcl-2-controlled fashion. FASEB J. 2000;14:2047–2054. doi: 10.1096/fj.99-1028com. [DOI] [PubMed] [Google Scholar]
- Saito M, Saito M, Berg MJ, Guidotti A, Marks N. Gangliosides attenuate ethanol-induced apoptosis in rat cerebellar granule neurons. Neurochem Res. 1999;24:1107–1115. doi: 10.1023/a:1020704218574. [DOI] [PubMed] [Google Scholar]
- Saito M, Saito M, Cooper TB, Vadasz C. Ethanol-induced changes in the content of triglycerides, ceramides, and glucosylceramides in cultured neurons. Alcohol Clin Exp Res. 2005;29:1374–1383. doi: 10.1097/01.alc.0000175011.22307.61. [DOI] [PubMed] [Google Scholar]
- Saito M, Chakraborty G, Mao RF, Wang R, Cooper TB, Vadasz C, Saito M. Ethanol alters lipid profiles and phosphorylation status of AMP-activated protein kinase in the neonatal mouse brain. J Neurochem. 2007a;103:1208–1218. doi: 10.1111/j.1471-4159.2007.04836.x. [DOI] [PubMed] [Google Scholar]
- Saito M, Mao RF, Wang R, Vadasz C, Saito M. Effects of gangliosides on ethanol-induced neurodegeneration in the developing mouse brain. Alcohol Clin Exp Res. 2007b;31:665–674. doi: 10.1111/j.1530-0277.2007.00351.x. [DOI] [PubMed] [Google Scholar]
- Saito M, Chakraborty G, Hegde M, Ohsie J, Paik SM, Vadasz C, Saito M. Involvement of ceramide in ethanol-induced apoptotic neurodegeneration in the neonatal mouse brain. J Neurochem. 2010a;115:168–177. doi: 10.1111/j.1471-4159.2010.06913.x. [DOI] [PMC free article] [PubMed] [Google Scholar]
- Saito M, Chakraborty G, Mao RF, Paik SM, Vadasz C, Saito M. Tau phosphorylation and cleavage in ethanol-induced neurodegeneration in the developing mouse brain. Neurochem Res. 2010b;35:651–659. doi: 10.1007/s11064-009-0116-4. [DOI] [PMC free article] [PubMed] [Google Scholar]
- Sano R, Annunziata I, Patterson A, Moshiach S, Gomero E, Opferman J, Forte M, d’Azzo A. GM1-ganglioside accumulation at the mitochondria-associated ER membranes links ER stress to Ca2+-dependent mitochondrial apoptosis. Mol Cell. 2009;36:500–511. doi: 10.1016/j.molcel.2009.10.021. [DOI] [PMC free article] [PubMed] [Google Scholar]
- Schönfeld P, Reiser G. Ca2+ storage capacity of rat brain mitochondria declines during the postnatal development without change in ROS production capacity. Antioxid Redox Signal. 2007;9:191–199. doi: 10.1089/ars.2007.9.191. [DOI] [PubMed] [Google Scholar]
- Scorrano L, Petronilli V, Di Lisa F, Bernardi P. Commitment to apoptosis by GD3 ganglioside depends on opening of the mitochondrial permeability transition pore. J Biol Chem. 1999;274:22581–22585. doi: 10.1074/jbc.274.32.22581. [DOI] [PubMed] [Google Scholar]
- Sokolowski JD, Mandell JW. Phagocytic clearance in neurodegeneration. Am J Pathol. 2011;178:1416–1428. doi: 10.1016/j.ajpath.2010.12.051. [DOI] [PMC free article] [PubMed] [Google Scholar]
- Stolzing A, Grune T. Neuronal apoptotic bodies: phagocytosis and degradation by primary microglial cells. FASEB J. 2004;18:743–745. doi: 10.1096/fj.03-0374fje. [DOI] [PubMed] [Google Scholar]
- Stromme P, Dobrenis K, Sillitoe RV, Gulinello M, Ali NF, Davidson C, Micsenyi MC, Stephney G, Ellevog L, Klungland A, Walkley S. X-linked Angelman-like syndrome caused by Slc9a6 knockout in mice exhibits evidence of endosomal-lysosomal dysfunction. Brain. 2011;134:3369–3383. doi: 10.1093/brain/awr250. [DOI] [PMC free article] [PubMed] [Google Scholar]
- Tancini B, Magini A, Latterini L, Urbanelli L, Ciccarone V, Elisei F, Emiliani C. Occurrence of an anomalous endocytic compartment in fibroblasts from Sandhoff disease patients. Mol Cell Biochem. 2009;335:273–282. doi: 10.1007/s11010-009-0277-0. [DOI] [PubMed] [Google Scholar]
- Tomas M, Duran JM, Lazaro-Dieguez F, Babia T, Renau-Piqueras J, Egea G. Fluorescent analogues of plasma membrane sphingolipids are sorted to different intracellular compartments in astrocytes; Harmful effects of chronic ethanol exposure on sphingolipid trafficking and metabolism. FEBS Lett. 2004;563:59–65. doi: 10.1016/S0014-5793(04)00245-5. [DOI] [PubMed] [Google Scholar]
- Vitner EB, Platt FM, Futerman AH. Common and uncommon pathogenic cascades in lysosomal storage diseases. J Biol Chem. 2010;285:20423–20427. doi: 10.1074/jbc.R110.134452. [DOI] [PMC free article] [PubMed] [Google Scholar]
- Walkley SU. Neurobiology and cellular pathogenesis of glycolipid storage diseases. Philos Trans R Soc Lond B Biol Sci. 2003;358:893–904. doi: 10.1098/rstb.2003.1276. [DOI] [PMC free article] [PubMed] [Google Scholar]
- Wilson DA, Peterson J, Basavaraj BS, Saito M. Local and regional network function in behaviorally relevant cortical circuits of adult mice following postnatal alcohol exposure. Alcohol Clin Exp Res. 2011;35:1974–1984. doi: 10.1111/j.1530-0277.2011.01549.x. [DOI] [PMC free article] [PubMed] [Google Scholar]
- Wozniak DF, Hartman RE, Boyle MP, Vogt SK, Brooks AR, Tenkova T, Young C, Olney JW, Muglia LJ. Apoptotic neurodegeneration induced by ethanol in neonatal mice is associated with profound learning/memory deficits in juveniles followed by progressive functional recovery in adults. Neurobiol Dis. 2004;17:403–414. doi: 10.1016/j.nbd.2004.08.006. [DOI] [PubMed] [Google Scholar]
- Young C, Klocke BJ, Tenkova T, Choi J, Labruyere J, Qin YQ, Holtzman DM, Roth KA, Olney JW. Ethanol-induced neuronal apoptosis in vivo requires BAX in the developing mouse brain. Cell Death Differ. 2003;10:1148–1155. doi: 10.1038/sj.cdd.4401277. [DOI] [PubMed] [Google Scholar]
- Yu WH, Cuervo AM, Kumar A, Peterhoff CM, Schmidt SD, Lee JH, Mohan PS, Mercken M, Farmery MR, Tjernberg LO, Jiang Y, Duff K, Uchiyama Y, Naslund J, Mathews PM, Cataldo AM, Nixon RA. Macroautophagy- A novel Beta-amyloid peptide generating pathway activated in Alzheimer’s disease. J Cell Biol. 2005;171:87–98. doi: 10.1083/jcb.200505082. [DOI] [PMC free article] [PubMed] [Google Scholar]
- Zervas M, Somers KL, Thrall MA, Walkley SU. Critical role for glycosphingolipids in Niemann-Pick disease type C. Curr Biol. 2001;11:1283–1287. doi: 10.1016/s0960-9822(01)00396-7. [DOI] [PubMed] [Google Scholar]
- Zervas M, Walkley SU. Ferret pyramidal cell dendritogenesis: changes in morphology and ganglioside expression during cortical development. J Comp Neurol. 1999;413:429–448. doi: 10.1002/(sici)1096-9861(19991025)413:3<429::aid-cne6>3.0.co;2-7. [DOI] [PubMed] [Google Scholar]


