Abstract
Purpose
To assess the usefulness of magnetic resonance imaging (MRI) with spin-echo echo-planar diffusion-weighted imaging (SE-EPI-DWI) in differentiation between vertebral osteoporotic fractures and pathological neoplastic fractures.
Materials and methods
Thirty-three patients with both osteoporotic or neoplastic vertebral fractures diagnosed with X-ray or TC were studied with MRI exam, (1.5 T unit) with DWI sequences. DWI sequences were qualitatively analyzed. Apparent diffusion coefficient (ADC) values were also determined and compared to the definitive histologic diagnosis.
Results
DWI of neoplastic lesions showed hyperintensity signal in 22 out of 23 cases. Mean ADC value of neoplastic fractures was 1.241 ± 0.4 × 10⁻³ mm2/s; mean ADC value of osteoporotic fractures was 0.646 ± 0.368 × 10⁻³ mm2/s. Neoplastic fractures showed ADC values significantly higher than osteoporotic ones (p < 0.001). DWI imaging and histology showed a significant correlation.
Conclusion
DWI provides reliable information to support MRI diagnosis of neoplastic versus osteoporotic fractures. ADC value appears as a useful adjunctive parameter.
Keywords: DWI, Vertebral fractures, MRI imaging, ADC values
Introduction
Vertebral fractures may be detected on radiographs, computed tomography or radionuclide studies, but in today’s clinical environment, the specific discrimination between benign and malignant vertebral compression fractures relies heavily on MR imaging features. Since most bony metastases are hematogenous in origin, the axial skeleton is the most common site of skeletal metastases initially due to abundant vascularization and red bone marrow [1]. However, osteoporotic compression fractures are also a common occurrence in the spine and can be confused with metastatic compression fracture in the acute phase. Since the prognosis and management differs in these two entities, accurate diagnosis is important.
The primary objective of this study was to evaluate the specificity and sensitivity of diffusion-weighted MR imaging (DWI) in the differentiation and characterization between benign and malignant vertebral compression fractures comparing the results of imaging to histology.
Materials and methods
Between January 2010 and October 2010, we retrospectively reviewed 33 patients (10 males, 23 females; mean age 60 ± 11 years) with vertebral fractures diagnosed with X-ray or TC. Patients with the history of vertebral compression fracture of more than 6 weeks, patients who were not MR compatible and those with sclerotic lesions were excluded from the study.
The 33 patients underwent biopsy and were divided into two groups: 23 patients (10 males; 13 females) with malignant tumoral fracture and 10 patients (3 males; 7 females) with non tumoral, osteoporotic fracture.
The patients were imaged using the conventional T1 WI, T2 WI, short Tau Inversion Recovery and spin-echo echo-planar diffusion-weighted (SE-EPI-DWI) sequences [2] using a spinal phased array coil on a 1.5 Tesla super conducting MR System (Avanto, Siemens Medical Solution, Forchein, Germany), gradient strength 45 mT/m, slew rate 200 T/m/ms.
Lesions were studied at baseline with the following sequences: sagittal T1-SE (TR 500 ms, TE 13 ms, matrix 380, FOV 320, thickness 4 mm) sagittal STIR (TR 4,800 ms, TE 89 ms, NEX 2, matrix 380, FOV 320, thickness 4 mm), sagittal T2-TSE (TR 4,100 ms, TE 102 ms, matrix 380, FOV 320, thickness 4 mm) and single-shot (SS)-SE-EPI-DWI with a value b of 800 s/mm2.
Post-processing was performed on a dedicated workstation (Leonardo, Siemens Medical Solution, Forchein, Germany).
The images obtained were analyzed both qualitatively and quantitatively. For qualitative evaluation, the images were analyzed and categorized by two experienced radiologists (AZ, GP) independently and then in a consensus review.
The signal intensities of the fractured vertebra were visually compared with that of the presumed normal vertebra on all the sequences (T1 WI, T2 WI, STIR and DWI) and categorized as hypointense, isointense or hyperintense relative to the areas of presumed normal marrow.
Statistical evaluation of the qualitative analysis between the two groups was performed using the Mann–Whitney U test.
For the quantitative assessment, statistical analysis was obtained by mathematically calculating the apparent diffusion coefficient (ADC). ADC maps are automatically generated by the workstation based on three b values according to the formula ADC = ln(S0/S1)(b1−b0), where S0 and S1 are the signal intensity before and after application of diffusion gradients, and b1 and b0 are the different b values applied. The ADC is a numerical value calculated by manually placing a region of interest (ROI) over the solid portion of tumor. The size of the ROI used occupied at least three quarters of the area of abnormal or normal signal intensity but excluding the end-plates, cortical margins, disc spaces or adjacent normal or abnormal marrow.
Statistical analysis was performed with Microsoft Excel (Microsoft version 15) and MedCalc Statistical Software (version 8.1.0.0).
The histologic findings for each patient were compared with imaging findings.
Results
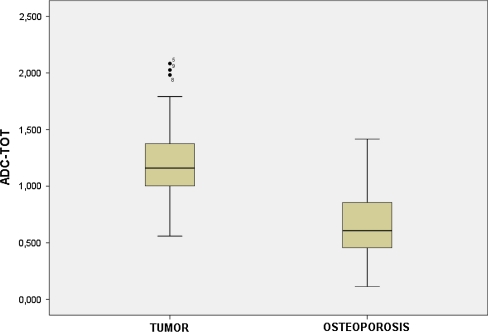
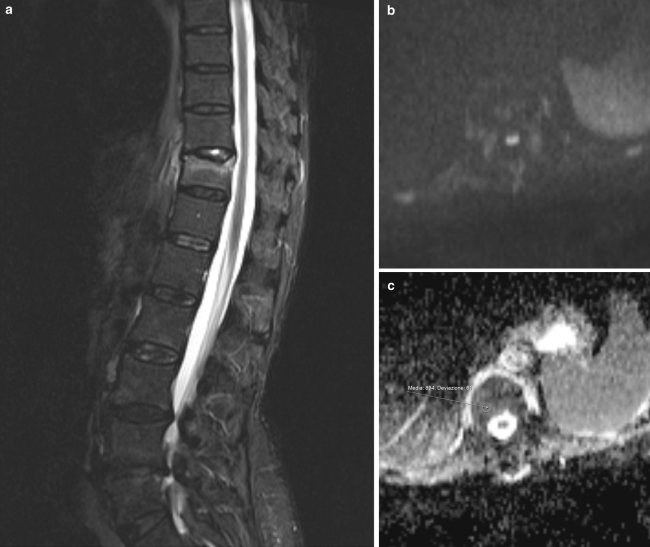
Qualitative analysis of DWI MR imaging: the signal intensity of the osteoporotic vertebral fractures on the DWI was low in 90% (9/10) of lesions (Fig. 1), and isointense in 10% (1/10) of lesions. In the malignant group, the fractured vertebral bodies were hyperintense in 95.6% (22/23) of lesions (Fig. 2) and hypointense in 4% (1/23) of cases. In comparison with the histologic findings, the sensitivity and specificity of DWI was 95.6 and 90%, respectively. The positive predictive value of high signal on DWI for malignant fractures was 95.6% (22/23) (Table 1).
Fig. 1.
Difference in ADC measurement between tumor fractures group and osteoporotic fractures group
Fig. 2.
a Sagittal STIR sequence of porotic fracture. Deformity of the endplate of T11, with edema of the vertebral body. b Axial DWI of T11, no hyperintensity of signal is noticed at b1000, indicating no evidence of neoplastic tissue. c ADC map at the same level
Table 1.
Differences between the tumor fractures group and the osteoporotic fracture group
| Tumor group (n = 23) | Osteoporotic group (n = 10) | P level | |
|---|---|---|---|
| Age | 56 ± 9 | 70 ± 9 | 0.256 |
| Sex (male/female) | 10/13 | 3/7 | 0.466 |
| ADC alterated signal | 1.24122 ± 0.405 | 0.64660 ± 0.357 | 0.001 |
| ADC normal bone | 0.47091 ± 0.222 | 0.263 ± 0.204 | 0.021 |
Significant p < 0.05
Quantitative analysis of DWI MR imaging: the mean ADC were calculated for each lesion. The mean ADC value for the malignant fractures was 1.241 × 10⁻³ mm2/s (range 0.56–2.1). For the osteoporotic fractures, the mean ADC value was 0.646 × 10⁻³ mm2/s (range 0.11–1.42). Normal bone mean ADC value was 0.47 × 10⁻³ mm2/s (range 0.02–0.84).
Discussion
Benign vertebral lesions occur in approximately one-third of cancer patients [2] while metastatic vertebral lesions account for 39% of bony metastases in patients with primary neoplasm [3]. Differentiation between malignant and benign vertebral compression fracture is a common problem in management of the patients: establishing the correct diagnosis is of great importance in determining treatment, surgical approach, and prognosis [4, 5].
Although MR imaging using conventional T1 WI and T2 WI has proved helpful in differentiating between benign and malignant causes of vertebral collapse, confident diagnosis is not always possible. Morphologic signs such as the degree and pattern of bone marrow replacement, multiplicity of lesions, paravertebral soft- tissue masses, infiltration of posterior elements of the vertebrae [6, 7] and the presence of a fracture line in osteoporotic fractures (as a linear hypointensity in the middle of the compressed vertebral body or adjacent to a compressed endplate) usually seen on T2 [8, 9] are common signs used for assessing the cause of the fracture. Despite the use of these features, there is still considerable overlap in the signal changes from acute to sub-acute fractures from malignant fractures as was also found in this study [10, 11].
Over the last decade, DWI MR imaging [12–14] of the vertebral body [15] has received considerable attention and has been successfully implemented for the differentiation of benign and malignant fracture edema (due to tumor infiltration) [16, 17].
In DWI, the MRI signal intensity is sensitive to the self-diffusion, (the stochastic Brownian motion of water molecules), which is influenced by the microscopic structure and organization of biological tissues. Technically this sensitivity is obtained by the insertion of a gradient pair [18] before image acquisition. Thus, diffusion-weighted images provide an additional contrast that is especially useful for the differentiation of normal and abnormal tissue.
This contrast can be assessed qualitatively by acquiring diffusion-weighted image data and localizing abnormal tissue as a region of decreased (increased) signal intensity caused by a higher (lower) diffusion than in normal tissue. However, this differentiation depends on the exact measurement setup, i.e., sequence choice, strength of diffusion weighting, etc. Alternatively, two or more images with different diffusion weightings can be acquired and the ADC as a quantitative measure of diffusion can be determined from the signal attenuation at varying diffusion weightings. The strength of the diffusion weighting depends on the amplitude and duration of the diffusion gradient and is given in terms of the b-value (s/mm2).
The most successful application of DWI of the bone marrow is the differentiation of benign osteoporotic and malignant vertebral compression fractures, which has first been demonstrated by Baur et al. [19] in 1998. Benign osteoporotic fractures appear hypointense or isointense in DWI, while malignant fractures appear hyperintense. Several similar studies were performed [20–24] most of these being compatible with these results. However, two studies showed that sclerotic metastases and treated metastases may also appear hypointense [22, 25]. In the case of sclerosis, this can be explained by the absence of water protons. This is why we excluded patient with sclerotic metastases.
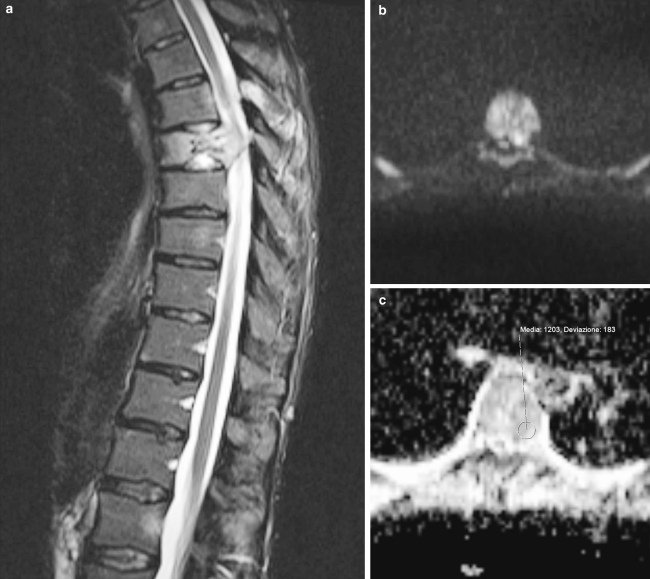
Our findings are in accordance with the literature, showing high signal in 22 out of 23 neoplastic fractures and hypointensitive signal in 9 out of 10 porotic fractures. Only 1 patient with porotic fracture showed isointensitive signal (Fig. 3).
Fig. 3.
a Sagittal STIR image of T6 fracture: notice the vertebral deformity and the high signal intensity indicating the presence of water within the vertebral body. b, c Axial DW imaging at the same level (T6) showing high intensity signal at b1000, suggestive of neoplastic infiltration, and ADC map at the same level
Several studies applied quantitative DWI to normal and pathological vertebral bone marrow (vBM) [20–22, 24].
Typical values of the ADC in normal bone marrow are in the range of 0.2–0.5 × 10⁻³ mm2/s [19]. Pathological bone marrow exhibits much higher diffusivities, ranging from about 0.7 to 1.0 × 10⁻³ mm2/s in metastases as well as malignant fractures, and from about 1.0 to 2.0 × 10⁻³ mm2/s in osteoporotic or traumatic fractures [26].
In our study, we found ADC values ranging from 0.56 to 2.1 × 10⁻³ mm2/s (mean 1,241) in malignant fracture. The higher ADC value was observed in one case of pathologic fracture on a non small cell lung cancer metastasis.
Although the measured ADC may be indicative for benign or malignant lesions, a considerable overlap has been described in several studies [19].
In our experience, according to the literature, we found very useful the qualitative evaluation of DWI images in differentiation between osteoporotic and malignant fractures.
ADC measures may be useful if associated to the qualitative analysis of the images.
Conflict of interest
None.
References
- 1.Malawer MM, Delaney T (1993) Treatment of metastatic cancer to bone. In: VTD, Vincent T, Hellman S et al (eds) Cancer: principle and practice of oncology. Lippincott, Philadelphia, pp 2225–2245
- 2.Fornasier VL, Czitrom AA. Collapsed vertebrae: a review of 659 autopsies. Clin Orthop Relat Res. 1978;131:261–265. [PubMed] [Google Scholar]
- 3.Ratanatharathorn V, Powers WE. Epidural spinal cord compression from metastatic tumor: diagnosis and guidelines for management. Cancer Treat Rev. 1991;18(1):55–71. doi: 10.1016/0305-7372(91)90004-J. [DOI] [PubMed] [Google Scholar]
- 4.Frager D, Elkin C, Swerdlow M, et al. Subacute osteoporotic compression fracture: misleading magnetic resonance appearance. Skeletal Radiol. 1988;17(2):123–126. doi: 10.1007/BF00365140. [DOI] [PubMed] [Google Scholar]
- 5.Yuh WT, Zachar CK, Barloon TJ, et al. Vertebral compression fractures: distinction between benign and malignant causes with MR imaging. Radiology. 1989;172(1):215–218. doi: 10.1148/radiology.172.1.2740506. [DOI] [PubMed] [Google Scholar]
- 6.An HS, Andreshak TG, Nguyen C, et al. Can we distinguish between benign versus malignant compression fractures of the spine by magnetic resonance imaging? Spine. 1995;20(16):1776–1782. doi: 10.1097/00007632-199508150-00005. [DOI] [PubMed] [Google Scholar]
- 7.Baker LL, Goodman SB, Perkash I, et al. Benign versus pathologic compression fractures of vertebral bodies: assessment with conventional spin-echo, chemical-shift, and STIR MR imaging. Radiology. 1990;174(2):495–502. doi: 10.1148/radiology.174.2.2296658. [DOI] [PubMed] [Google Scholar]
- 8.Palmer WE, Suri R, Kattapuram SV (1999) Benign versus malignant vertebral collapse: value of a fracture line on MR images. Radiology (Suppl):213–293
- 9.Baur A, Stabler A, Arbogast S, et al. Acute osteoporotic and neoplastic vertebral compression fractures: fluid sign at MR imaging. Radiology. 2002;225(3):730–735. doi: 10.1148/radiol.2253011413. [DOI] [PubMed] [Google Scholar]
- 10.Tan SB, Kozak JA, Mawad ME. The limitations of magnetic resonance imaging in the diagnosis of pathologic vertebral fractures. Spine. 1991;16(8):919–923. doi: 10.1097/00007632-199108000-00009. [DOI] [PubMed] [Google Scholar]
- 11.Rupp RE, Ebraheim NA, Coombs RJ. Magnetic resonance imaging differentiation of compression spine fractures or vertebral lesions caused by osteoporosis or tumor. Spine. 1995;20(23):2499–2503. doi: 10.1097/00007632-199512000-00007. [DOI] [PubMed] [Google Scholar]
- 12.Bihan DJ, Turner R. Diffusion and perfusion. In: Stark DD, Bradley WG Jr, editors. Magnetic resonance imaging. 2. St Louis: Mosby-Year Book; 1992. pp. 335–371. [Google Scholar]
- 13.Bihan D, Douek P, Argyropoulou M, et al. Diffusion and perfusion magnetic resonance imaging in brain tumors. Top Magn Reson Imaging. 1993;5(1):25–31. [PubMed] [Google Scholar]
- 14.Turner R, Bihan D, Maier J, et al. Echo-planar imaging of intravoxel incoherent motion. Radiology. 1990;177(2):407–414. doi: 10.1148/radiology.177.2.2217777. [DOI] [PubMed] [Google Scholar]
- 15.Bammer R, Fazekas F. Diffusion imaging of the human spinal cord and the vertebral column. Top Magn Reson Imaging. 2003;14(6):461–476. doi: 10.1097/00002142-200312000-00004. [DOI] [PubMed] [Google Scholar]
- 16.Baur A, Stabler A, Bruning R, et al. Diffusion-weighted MR imaging of bone marrow: differentiation of benign versus pathologic compression fractures. Radiology. 1998;207(2):349–356. doi: 10.1148/radiology.207.2.9577479. [DOI] [PubMed] [Google Scholar]
- 17.Spuentrup E, Buecker A, Adam G, et al. Diffusion-weighted MR imaging for differentiation of benign fracture edema and tumor infiltration of the vertebral body. AJR Am J Roentgenol. 2001;176(2):351–358. doi: 10.2214/ajr.176.2.1760351. [DOI] [PubMed] [Google Scholar]
- 18.Stejskal EO, Tanner JE. Spin diffusion measurements: spin echoes in the presence of a time-dependent field gradient. J Chem Phys. 1965;42(1):288–292. doi: 10.1063/1.1695690. [DOI] [Google Scholar]
- 19.Baur A, Stäbler A, Brüning R, et al. Diffusion-weighted MR imaging of bone marrow: differentiation of benign versus pathologic compression fractures. Radiology. 1998;207(2):349–356. doi: 10.1148/radiology.207.2.9577479. [DOI] [PubMed] [Google Scholar]
- 20.Castillo M, Arbelaez A, Smith JK, et al. Diffusion-weighted MR imaging offers no advantage over routine noncontrast MR imaging in the detection of vertebral metastases. AJNR Am J Neuroradiol. 2000;21(5):948–953. [PMC free article] [PubMed] [Google Scholar]
- 21.Spuentrup E, Bruecker A, Adam G, et al. Diffusion-weighted MR imaging for differentiation of benign fracture edema and tumor infiltration of the vertebral body. AJR Am J Roentgenol. 2001;176(2):351–358. doi: 10.2214/ajr.176.2.1760351. [DOI] [PubMed] [Google Scholar]
- 22.Baur A, Huber A, Dürr HK, et al. Differentiation of benign osteoporotic and neoplastic vertebral compression fractures with a diffusion-weighted, steady-state free precession sequence. Rofo. 2002;174(1):70–75. doi: 10.1055/s-2002-19534. [DOI] [PubMed] [Google Scholar]
- 23.Abanoz R, Hakyemez B, Parlak M. Diffusion-weighted imaging of acute vertebral compression: differential diagnosis of benign versus malignant pathologic fractures. Tani Girisim Radyol. 2003;9(2):176–183. [PubMed] [Google Scholar]
- 24.Hackländer T, Scharwächter C, Golz R, et al. Value of diffusion-weighted imaging for diagnosing vertebral metastases due to prostate cancer in comparison to other primary tumors. Rofo Fortschr Röntgenstr. 2006;178:416–424. doi: 10.1055/s-2006-926566. [DOI] [PubMed] [Google Scholar]
- 25.Byun WM, Shin SO, Chang Y, et al. Diffusion-weighted MR imaging of metastatic disease of the spine: assessment of response to therapy. AJNR Am J Neuroradiol. 2002;23(6):906–912. [PMC free article] [PubMed] [Google Scholar]
- 26.Dietrich O, Biffar A, Reiser MF, et al. Diffusion-weighted imaging of bone marrow. Semin Musculoskelet Radiol. 2009;13(2):134–144. doi: 10.1055/s-0029-1220884. [DOI] [PubMed] [Google Scholar]


