
Fig. 2.
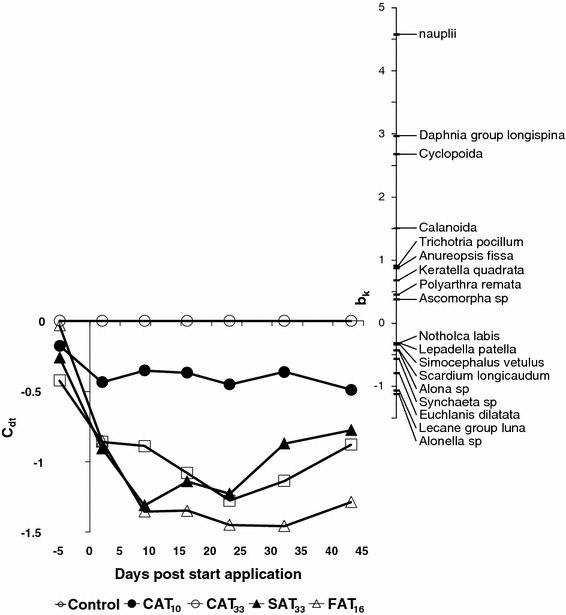
Principal response curves resulting from the analysis of the zooplankton dataset, indicating the effects of different azoxystrobin treatments. Nineteen percent of all variance could be attributed to the sampling date; this is displayed on the horizontal axis. Twenty-six percent of all variance could be attributed to treatment level, 35% of which is displayed on the vertical axis. The lines represent the development of the treatments in time. The species weight (bk) can be interpreted as the affinity of a taxon with the Principal Response Curves (cdt). Taxa with a species weight between 0.25 and −0.25 are not shown. A Monte Carlo permutation test indicated that the diagram displays a significant amount of the variance explained by the treatment (p = 0.004)