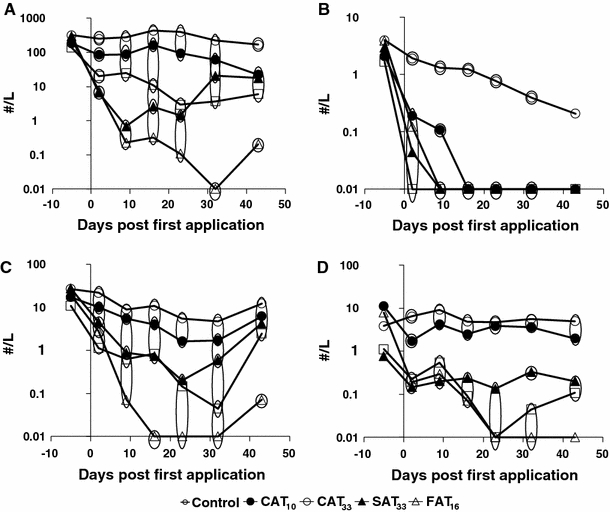
Fig. 3.

Zooplankton population dynamics, in numbers per litre (geometric mean), of taxa showing consistent responses to azoxystrobin treatments. Nauplii (a), Calanoida (b), Cyclopoida (c) and Daphnia gr. longispina (d). Significant differences are indicated by the circles. Treatments present in the same circle did not differ significantly from each other, while those not sharing the same circle did differ significantly (Duncan test, p < 0.05). The value 0.01 denotes 0 numbers in the samples
