

Abstract
Systemic injection of lipopolysaccharide (LPS) is a widely used model of immune/inflammatory challenge, which can invoke a host of CNS responses, including activation of the hypothalamic-pituitary-adrenal (HPA) axis. Inducible vascular prostaglandin E2 (PGE2) synthesis by endothelial (ECs) and/or perivascular cells (PVCs) (a macrophage-derived vascular cell type) is implicated in the engagement of HPA and other CNS responses, by virtue of their capacity to express cyclooxygenase-2 (COX-2) and microsomal PGE2 synthase-1. Evidence from genetic and pharmacologic studies also supports a role for the constitutively expressed COX-1 in inflammation-induced activation of the HPA axis, although histochemical evidence to support relevant localization(s) and regulation of COX-1 expression is lacking. The present experiments fill this void in showing that COX-1 immunoreactivity (IR) and mRNA are detectable in identified PVCs and parenchymal microglia under basal conditions and is robustly expressed in these and ECs 1–3 h after intravenous injection of LPS (2 μg/kg). Confocal and electron microscopic analyses indicate distinct cellular/subcellular localizations of COX-1-IR in the three cell types. Interestingly, COX-1 expression is enhanced in ECs of brain PVC-depleted rats, supporting an anti-inflammatory role of the latter cell type. Functional involvement of COX-1 is indicated by the observation that central, but not systemic, pretreatment with the selective COX-1 inhibitor SC-560 attenuated the early phase of LPS-induced increases in adrenocorticotropin and corticosterone secretion. These findings support an involvement of COX-1 in bidirectional interplay between ECs and PVCs in initiating vascular PGE2 and downstream HPA response to proinflammatory challenges.
Introduction
Interplay between the immune and neuroendocrine systems has been extensively documented (for review, see Black, 2002). Inflammatory/immune stimuli, such as systemic administration of lipopolysaccharide (LPS) (or endotoxin) or the proinflammatory cytokine interleukin-1β (IL-1β) activate the hypothalamic-pituitary-adrenal (HPA) axis (Dinarello, 1984, 1991; Besedovsky et al., 1986; Sapolsky et al., 1987) and other acute phase responses, including lethargy, somnolence, fever, and anorexia, referred to collectively as sickness behavior (Hart, 1988; Konsman et al., 2002). Several studies have supported the local release of prostaglandin E2 (PGE2) as a dominant effector of this activation (Ericsson et al., 1997; Scammell et al., 1998; Schiltz and Sawchenko, 2002). Two cell types of the cerebral vasculature, endothelial cells (ECs) and perivascular cells (PVCs) (a subset of brain resident macrophages) have been implicated in the transduction of circulating immune signals presented by IL-1β or LPS (Schiltz and Sawchenko, 2002). PGE2 released from the vasculature acts in a paracrine manner to stimulate nearby catecholamine neurons (medullary neurons that express PGE2 receptors) that project to the paraventricular nucleus of hypothalamus (PVH), activating neurosecretory neurons that release corticotropin-releasing factor (CRF) and govern HPA secretory responses (Ericsson et al., 1994, 1997; Li et al., 1996; Schiltz and Sawchenko, 2007).
Prostaglandins are generated via a complex multienzymatic pathway (Murakami et al., 2002). Arachidonic acid (AA), formed from membrane phospholipids by the action of phospholipase A2, is the principal substrate for cyclooxygenases (COXs), which catalyze the rate-limiting conversion of AA to prostaglandin H2 (PGH2). Tissue-specific prostaglandin synthases convert PGH2 into different prostanoids. Microsomal PGE2 synthase-1 (mPGES-1) is the dominant and best-studied terminal PGE2 synthase in brain. As in the case with COX-2, mPGES-1 is upregulated in brain ECs by immune stimuli (Yamagata et al., 2001), and its activity is related to acute phase responses (Jakobsson et al., 1999; Forsberg et al., 2000). Nevertheless, there remain unresolved issues concerning the mechanisms, regulation, and functional significance of immune challenge-induced cerebrovascular prostanoid production.
One of the more contentious debates centers on the involvement of inducible (COX-2) versus constitutively expressed COX-1 isoforms in generating cerebrovascular PGE2 production and initiating downstream HPA responses to proinflammatory challenges. COX-2 induction is readily demonstrable in ECs and/or PVCs after such challenges, and its expression correlates with several acute phase endpoints across a range of experimental conditions. However, the time required for de novo enzyme synthesis poses stern questions as to the relevance of prostanoids generated in this manner in initiating rapid acute phase responses. Recent evidence from genetic and pharmacologic studies support a role for COX-1, in showing attenuated LPS-induced neuroinflammatory (Choi et al., 2009) and HPA (Elander et al., 2009) responses in COX-1 null mice and febrile responses by pretreatment with a selective COX-1 inhibitor (Zhang et al., 2003). Attaching a significance to these findings is limited by the fact that neither basal nor challenge-induced expression of cerebrovascular COX-1 has been reported. The present study aimed to fill this void and provide additional evidence for COX-1 functional involvement in immune challenge-induced HPA activation.
Materials and Methods
Animals.
Adult male Sprague Dawley albino rats (260–340 g) were used in most experiments. They were housed individually in a temperature-controlled room on a 12 h light/dark cycle with food and water available ad libitum and were adapted to handling for at least 5 d before any manipulation. COX-1-deficient and littermate wild-type mice, generously provided by Dr. Robert Langenbach (National Institutes of Health/National Institute of Environmental Health Sciences, Research Triangle Park, NC) (Langenbach et al., 1995), were bred from heterozygote matings and used for experimentation immediately on arrival in our laboratory. All experimental protocols were approved by the Institutional Animal Care and Use Committee of The Salk Institute.
Intravenous administration of IL-1β and LPS.
The procedures for implanting catheters and intravenous infusions in rats have been described previously (Ericsson et al., 1994). Briefly, indwelling jugular catheters (polyethylene PE 50) containing sterile, heparin–saline (50 U/ml) were implanted under isoflurane anesthesia. The sealed catheter was positioned with its internal SILASTIC (Dow Corning) tip at the atrium and was exteriorized at an interscapular position. After 2 d recovery, awake and freely moving rats (n = 5 per group) were removed briefly from their home cage, injected with 2 μg/kg recombinant rat IL-1β (generously provided by Dr. Ron Hart, Rutgers University, Piscataway, NJ) or its vehicle (1 ml/kg, 0.01% BSA, 0.01% ascorbic acid, 10 mm Tris-HCl, and 36 mm sodium phosphate buffer, pH 7.4) and returned to their home cages. In similar experiments, groups of rats were injected with lipopolysaccharide at 2 μg/kg (serotype 055:B5; Sigma) or sterile saline (1 ml/kg). Another set of animals (n = 5 per treatment) was similarly prepared to receive intravenous injections of the COX-1-selective inhibitor SC-560 (10 mg/kg), the COX-2-selective inhibitor NS-398 (5 mg/kg), or vehicle (10% ethanol in 0.04 m PBS, pH 7.4), 15 min before intravenous administration of IL-1β or LPS. Doses of SC-560 and NS-398 were within the ranges at which these drugs selectively interfere with COX-1-dependent (gastric mucosal prostanoid production) versus COX-2-dependent (inflammatory) mechanisms, in vivo (Arai et al., 1993; Futaki et al., 1993; Masferrer et al., 1999).
Intraventricular injections.
Groups of rats (n = 5) were anesthetized with ketamine/xylazine/acepromazine (25:5:1 mg/kg, s.c.) and stereotaxically implanted with 26 gauge guide cannulae (Plastics One) terminating within a lateral ventricle. The cannulae were affixed to the skull with dental acrylic adhering to jewelers screws partially driven into the skull and were sealed with dummy stylets cut to terminate flush with the tip of the cannula. Seven to 10 d later, and 2 d after implantation of jugular catheters, the stylets were removed and replaced with 30 gauge injection cannulae that extended 1.0 mm beyond the tip of the guide. Rats were given intracerebroventricular injections of SC-560 (50 μg in 5 μl), NS-398 (25 μg in 5 μl), or vehicle (10% ethanol in 0.04 m PBS, pH 7.4) through the injection cannula connected to a 50 μl Hamilton syringe with PE 50 tubing. Five minutes after central injection, IL-1 (2 μg/kg), LPS (2 μg/kg), or their respective vehicles was administered intravenously. One to 3 h later, the animals were anesthetized and perfused for histology.
Liposome preparation and delivery.
Liposomes were prepared following the protocol described by N. Van Rooijen, Vrije Universiteit Medical Center, Amsterdam, The Netherlands (Van Rooijen and Sanders, 1994). Briefly, these are polylamellar phosphatidylcholine/cholesterol membranes that encapsulate clodronate (used at a concentration of 250 mg/ml), are mannosylated to facilitate receptor-mediated uptake, and labeled with the carbocyanine dye DiI (D282; Invitrogen) to enable detection of cells that have incorporated them. For intracerebroventricular injection, rats were anesthetized with ketamine/xylazine/acepromazine (25:5:1 mg/kg, s.c.) and mounted in a stereotaxic frame. Control (encapsulating PBS) or clodronate liposomes were gently shaken to resuspend them, equilibrated to room temperature, and injected in a volume of 50 μl over 10 min into a lateral ventricle using a 26 gauge needle mounted onto stereotaxic arm and attached via polyethylene tubing to a 1000 μl gastight syringe (Bee Stinger; BAS). Rats were allowed 5–7 d to recover before testing, the point at which depletion of brain macrophages is maximal and before any substantial repopulation from bone marrow-derived progenitors (Van Rooijen and Sanders, 1994; Polfliet et al., 2001).
Perfusion and histology.
At appropriate time points, rats were anesthetized and perfused via the ascending aorta with 4% paraformaldehyde in 0.1 m borate buffer, pH 9.5, and the brains were removed, postfixed for 3 h, and cryoprotected overnight. Regularly spaced series of 30-μm-thick coronal sections were collected in cryoprotectant solution and stored at −20°C until processing.
Immunohistochemistry.
COX-1 was localized using a monoclonal antibody (catalog #160110; Cayman Chemical) raised against COX-1 purified from ovine seminal vesicles. Immunolabeling for COX-1 immunoreactivity (IR) was initially performed on free-floating sections using a conventional avidin–biotin immunoperoxidase procedure (Sawchenko et al., 1990). Sections were incubated with the primary antiserum at a dilution of 1:1000 for COX-1 at 4°C for 48 h. The primary antiserum was localized using Vectastain Elite reagents (Vector Laboratories), and the reaction product was developed on ice using a nickel-enhanced glucose oxidase method (Shu et al., 1988). The specificity of the antisera was evaluated in Western blots (see below) and by direct colabeling for COX-1 mRNA. In addition, labeling was compared in COX-1 null mutant mice and wild-type littermates injected with sterile saline or LPS (100 μg/kg, i.p.).
To identify the cell type(s) displaying COX-1-like immunoreactivity, a dual-immunofluorescence protocol was used. Sections were incubated with antisera for COX-1 and either the anti-ionized calcium binding adaptor molecule 1 (Iba-1), used here as marker for parenchymal microglia and PVCs, or von Willebrand factor, a marker for ECs. Iba-1 was localized using a rabbit polyclonal antiserum generated against a synthetic peptide, PTGPPAKKAISELP (catalog #019-19741; Wako Bioproducts). The serum recognizes a single band of appropriate relative molecular weight (∼17 kDa) in Western blots, and immunolocalization in normal brain includes cells of typical microglial morphology, as well as PVCs and meningeal macrophages (Imai and Kohsaka, 2002). von Willebrand factor was localized using a rabbit polyclonal antiserum generated to localize human von Willebrand factor (A0082, lot 128; Dakopatts). According to the specifications of the manufacturer, this antiserum recognizes von Willebrand factor/factor VIII complexes in a range of species, including rat, and yields a single precipitate corresponding to von Willebrand factor in crossed electrophoresis of human plasma. In brain tissue sections, it supported discrete and continuous labeling of the vasculature, consistent with endothelial localization.
The respective primary antisera were incubated for 48 h at 4°C. Subsequently, the sections were incubated for 1–2 h at room temperature with Alexa 555-conjugated donkey anti-rabbit IgG (1:200; Invitrogen) and Alexa 488-conjugated donkey anti-mouse IgG (1:200; Invitrogen) to localize von Willebrand factor and Iba-1 or COX-1, respectively. Control experiments included incubation of tissue sections from control and challenged animals with each antiserum singly and then with both secondary antisera to ensure that the latter did not cross-react with the inappropriate primary antiserum or with each other. Imaging was performed using a Leica SP2 TCS AOBS spectral confocal microscope.
Fos protein was detected by immunoperoxidase labeling using a rabbit polyclonal antiserum raised against a synthetic peptide corresponding to 4–17 residues of human Fos protein (catalog #Ab-5; Oncogene Science). Staining in normal and immune-challenged rats was eliminated by preadsorbing the antiserum overnight with 30 μm synthetic immunogen.
Cell counts.
Quantitative assessment of the effects of LPS and/or clodronate liposome treatment on vascular COX-1 expression was performed by assessing the density (number of cells per unit vascular area) in a regularly spaced series of sections through the hypothalamus at the level of the paraventricular nucleus of rats challenged with intravenous injection of 2 μg/kg LPS or vehicle 7 d after having received intracerebroventricular injection of liposomes encapsulating PBS (control) or clodronate (n = 4 per group). This involved imaging two to three randomly selected 0.58 mm2 fields per section in a complete series, counting the number of profiles identified on morphological grounds (see Results) as corresponding to perivascular or endothelial cells, and tracing the perimeter of vessels to allow areal calculations using NIH ImageJ software (version 1.42; http://rsb.info.nih.gov/ij/).
In addition, material from groups (n = 4) of COX-1 knock-out and littermate wild-type mice challenged with intraperitoneal injection of 10 or 100 μg/kg LPS or saline and perfused 3 h later was used for analysis of cellular activation (Fos induction) profiles in select CNS cell groups. Counts of the number of Fos-immunoreactive cells were generated in regularly spaced series of sections through cell groups of interest and were corrected for double counting error (Abercrombie, 1946).
Hybridization histochemistry.
Techniques for probe synthesis, hybridization, and autoradiographic localization of mRNA signal were adapted from Simmons et al. (1989). In situ hybridization was performed using 35S-labeled sense (control) and antisense cRNA probes labeled to similar specific activities from a 2.8 kb COX-1 cDNA encompassing the entire coding sequence (GenBank accession number BC081816), from the Mammalian Genome Consortium and distributed by Invitrogen (clone identification number 7129757). Identity of the cloned cDNA was confirmed by partial DNA sequencing. Sections were mounted onto poly-l-lysine-coated slides and dried under vacuum overnight. They were postfixed with 10% paraformaldehyde for 30 min at room temperature, digested with 10 μg/ml proteinase K for 15 min at 37°C, and acetylated for 10 min. Probes were labeled to specific activities of 1–3 × 10⁹ dpm/μg and applied to the slides at concentrations of ∼107 cpm/ml, overnight at 56°C in a solution containing 50% formamide, 0.3 m NaCl, 10 mm Tris, 1 mm EDTA, 0.05% tRNA, 10 mm dithiothreitol, 1× Denhardt's solution, and 10% dextran sulfate, after which they were treated with 20 μg/ml ribonuclease A for 30 min at 37°C and washed in 15 mm NaCl/1.5 mm sodium citrate with 50% formamide at 70°C. Slides were then dehydrated and exposed to x-ray films (Kodak Biomax MR; Eastman Kodak) for 18 h. They were coated with Kodak NTB-2 liquid emulsion and exposed at 4°C for 3–4 weeks, as determined by the strength of signal on film. Slides were developed with Kodak D-19 and fixed with Kodak rapid fixer.
Electron microscopy.
Rats previously implanted with jugular catheters received intravenous injections of saline (n = 2) or LPS (100 μg/kg; n = 3) as described above were perfused 3 h later with saline, followed by 3.75% acrolein and 2% paraformaldehyde in 0.1 m phosphate buffer, pH 7.0. Vibratome sections, 50 μm thick, were taken from comparable regions of hypothalamus and medulla. Sections were fixed in 1% osmium tetroxide with 1.5% potassium ferricyanide, dehydrated with ethanol and propylene oxide, and infiltrated with Spurr's resin. The sections were embedded, thin sectioned, and counterstained with uranyl acetate and lead citrate. The material was examined in a JEOL 100 CX II transmission electron microscope.
Western blot analysis.
Rats prefitted with jugular catheters were rapidly anesthetized 0–3 h after intravenous injections of saline (n = 2) or LPS (2 μg/kg; n = 3) and briefly perfused transcardially with saline. Hypothalamus and medulla were dissected, collected, snap frozen, and stored at −80°C until analysis. Dissected blocks of hypothalamus and medulla were homogenized in lysis buffer (25 mm Tris-HCl, pH 7.8, 150 mm NaCl, and 1 mm EDTA). Before homogenization, protease inhibitors PMSF, NaF (1 mm), aprotinin, leupeptin, and pepstatin (1 μg/ml each) were added. The homogenates were centrifuged at 14,000 × g for 20 min. Protein concentrations were determined using a BCA Protein Assay kit (Pierce Chemical). Proteins were then boiled in sample buffer containing SDS, basal Eagle's medium, and glycerol at 95°C for 5 min. Ten micrograms of protein were then separated by 12% SDS-PAGE. Proteins were transferred to nitrocellulose membrane (0.2 μm; Bio-Rad) and incubated in primary antibodies diluted in 5% milk in PBS with 0.1% Tween 20 overnight at 4°C. COX-1 primary antibody was detected with anti-mouse horseradish peroxidase-linked secondary antibodies (1:1000; Calbiochem) and developed with an enhanced chemiluminescence Western blot detection kit (Supersignal West Pico; Pierce Chemical).
Stress hormone assays.
Separate groups of animals (n = 5) were implanted with indwelling jugular catheters as above 2 d before LPS or IL-1β injections. Blood samples (300 μl) were taken before intravenous injection of IL-1 or LPS, at 30 min and then hourly through 3 h after injection. They were collected into chilled EDTA-containing tubes and centrifuged; plasma was stored at −20°C until assay. ACTH was measured using a two-site immunoradiometric assay obtained in kit form (DiaSorin), with intra-assay and interassay coefficients of variation of 3 and 9%, respectively, and a sensitivity of 5 pg/ml. Plasma corticosterone was measured without extraction, using an antiserum raised in rabbits against a corticosterone–BSA conjugate and [125I]corticosterone–BSA as tracer (MP Biomedicals). The sensitivity of the assay was 0.8 μg/dl; intra-assay and interassay coefficients of variation were 5 and 10%, respectively.
PGE2 assays.
Tissue PGE2 levels were measured by enzyme immunoassay (EIA) using reagents in kit form (Prostaglandin E2 EIA Kit–Monoclonal; Cayman Chemical). Rats (n = 5 per treatment) were rapidly anesthetized and briefly perfused transcardially with saline to minimize confounding effects of circulating PGE2 sources. Hypothalamus and medulla were dissected, collected, snap frozen, and stored at −80°C until analysis. Samples were sonicated in 300 μl of homogenization buffer (0.1 m phosphate buffer, pH 7.4, 1 mm EDTA, and 10 μm indomethacin to prevent ex vivo synthesis of PGs), purified by incubation in ethanol at 4× sample volume for 5 min at 4°C, and then centrifuged at 3000 × g for 10 min. They were acidified with glacial acetic acid to pH 3.5, and PGE2 was extracted using SPE (C-18) columns rinsed with methanol and water. After application of samples, columns were washed with water and hexane, and PGE2 was eluted with ethyl acetate. Samples were then evaporated to dryness under nitrogen and resuspended in EIA buffer. Levels of PGE2 were measured in a 96-well plate and read at 405 nm. The sensitivity of the assay was 15 pg/ml; intra-assay and interassay coefficients of variation were 6.6 and 15.5%, respectively, at 62.5 pg/ml.
Statistics.
Data in text and figures are expressed as mean ± SEM. They were analyzed by ANOVA, followed by the Newman–Keuls test for individual pairwise comparisons. p ≤ 0.05 was considered statistically significant.
Results
Validation of a COX-1 antibody
As described below, COX-1-IR was detected in unmanipulated rats in a vascular cell type (PVCs) and parenchymal microglia, and in these as well as ECs, of LPS-challenged animals (n = 5 per group). Western blot analyses of tissue extracts from hypothalamus or medulla of intact and LPS-challenged rats revealed a single major band at ∼70 kDa, corresponding to the predicted size of COX-1 protein. Total COX-1 protein levels did not vary markedly across experimental conditions in these samples (Fig. 1). Western blots performed on extracts from the brains of wild-type mice revealed a single major band migrating at ∼70 kDa, consistent with previous characterizations of COX-1 in mouse brain (Bosetti et al., 2004), which was not detected in similar extracts from COX-1-deficient mice. In addition, COX-1 immunostaining of both parenchymal and vascular cells was detectable in the brains of wild-type mice but not in COX-1 null mutants, under either basal or LPS-stimulated conditions. Staining for the inducible COX-2 isoform of the same LPS-challenged mice was not qualitatively affected by COX-1 deficiency (Fig. 1).
Figure 1.
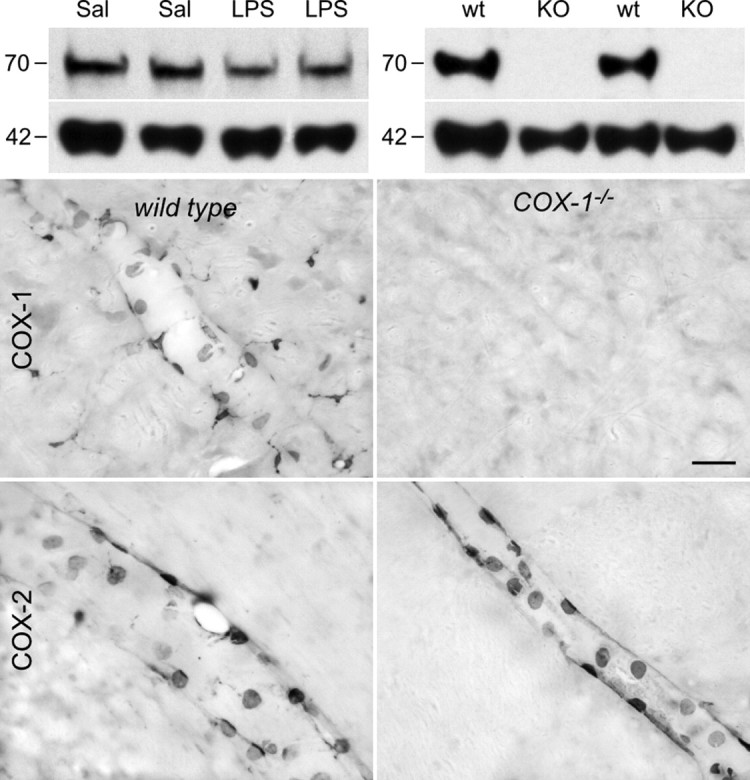
COX-1 antibody validation. Top, Western blots of brain extracts from rats (left) and mice (right) probed with a monoclonal antibody against COX-1 protein. Hypothalamic extracts from rats killed 2 h after intravenous injection of saline (Sal) or LPS (2 μg/kg, i.v.) show a single major band migrating at ∼70 kDa, corresponding to the molecular weight of COX-1 monomer. Cortical (left two bands) and hypothalamic (right) extracts from wild-type (wt) mice also display a single band at 70 kDa that is not detected in COX-1 knock-out mice (KO). Both blots were reprobed with β-actin (bottom) to provide a loading control. Bottom, Bright-field micrographs showing COX-1-IR (top row) and COX-2-IR (bottom row) in wild-type mice (wt; left) and COX-1-deficient mice (COX-1−/−; right) killed 3 h after LPS injection (100 μg/kg, i.p.). Wild-type mice display COX-1-IR in vascular and parenchymal cells, whereas no labeling is observed in knock-out mice. Both genotypes display qualitatively similar labeling for COX-2 in vascular cells only. These findings indicate that the COX-1 antiserum does not cross-react with the structurally related COX-2 enzyme. Scale bar, (bottom 4 panels) 50 μm.
Additional support for the specificity of immunolocalization was derived from rat brains prepared for hybridization histochemical localization of COX-1 mRNA (Fig. 2). In material from unmanipulated or saline-injected animals, grain clusters indicative of positive hybridization signals were seen over blood vessels, with more numerous smaller ones, presumably corresponding to microglia (see below), distributed evenly throughout the brain parenchyma. Frank increases in the apparent number of labeled vascular cells were seen in rats killed 1 h after an LPS challenge (2 μg/kg, i.v.). Although parenchymal labeling was more salient (grain clusters appearing more concentrated) in LPS-treated animals, because microglia are known to undergo morphological changes in response to LPS insults [retraction and thickening of processes (Streit et al., 1988)], it is not clear whether this may represent altered COX-1 expression in this cell type. In concurrent dual-labeling experiments, the great majority of vascular and parenchymal cells exhibiting COX-1 immunoreactivity were overlain by positive mRNA signals.
Figure 2.
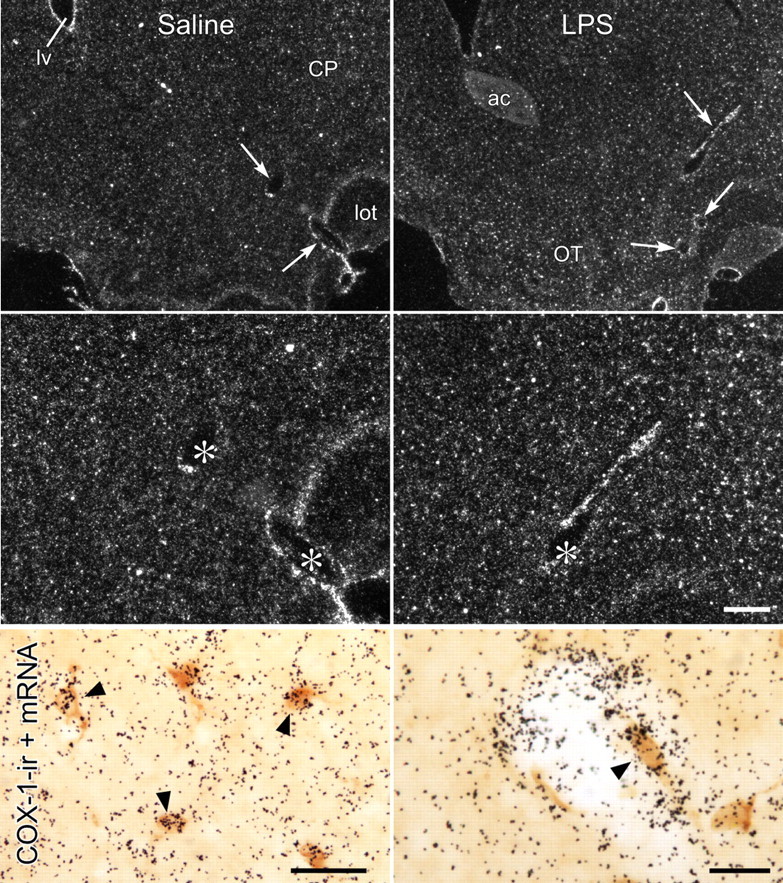
COX-1 mRNA localization. Lower (top row) and higher (middle row) magnification dark-field images of sections through comparable levels of forebrain showing COX-1 mRNA in the brain parenchyma and in CNS blood vessels from rats killed 1 h after intravenous injection of saline (left) or LPS (2 μg/kg; right). Labeling associated with vessels is indicated by arrows (top) or asterisks (middle). Note also evenly scattered small grain clusters over the parenchyma, presumably corresponding to glial labeling, which is more salient in LPS-treated rats. Bottom row, Bright-field photomicrographs showing concurrent localization of COX-1-IR (brown) and COX-1 mRNA signal (black silver grains). COX-1-immunoreactive cells in both the parenchyma (presumed microglial; left) and vessels (right) are overlain (arrowheads) by COX-1 mRNA signal, further supporting specificity of immunolocalization. ac, anterior commissure; CP, caudoputamen; lv, lateral ventricle; lot, lateral olfactory tract; OT, olfactory tubercle. Scale bars: top row, 400 μm; middle row, 200 μm (scale bar in the middle right panel applies to top two rows); bottom row, 25 μm.
Cellular distribution and regulation of COX-1-IR
In unmanipulated rats and controls that received intravenous injections of saline, COX-1-IR was expressed in vascular and parenchymal elements (Fig. 3). Vascular-associated labeling took the form of ring-like structures, whose size (6–8 μm in diameter) suggested perinuclear staining, which was associated with faint patches of cytoplasmic labeling. More prominent were evenly scattered small cellular profiles in the brain parenchyma bearing one or more fine tortuous processes and resembling quiescent microglia. Within 1–3 h after an IL-1 or LPS challenge, labeling of both cell types was markedly enhanced, with the ring-like labeling now clearly identifiable as nuclear-associated and patchy reaction production more prominent in the cytoplasm (Figs. 3, 4). Labeling of microglial-like cells was also more pronounced, with shorter and thicker processes characteristic of microglial activation (Streit et al., 1988) also apparent. In addition, immunechallenged rats also displayed COX-1 staining of an additional vascular cell type, a uniform faint to moderate labeling of round profiles, reminiscent of the nuclear labeling for COX-2 commonly reported in such preparations (Schiltz and Sawchenko, 2002).
Figure 3.

Basal and regulated COX-1 expression in the cerebral vasculature. Bright-field images of COX-1-immunoreactive labeling of vessels from control (saline-injected) and IL-1- or LPS-challenged rats (both at 2 μg/kg, i.v.) that are otherwise untreated (top row) or in ones pretreated with intracerebroventricular clodronate liposome (Clod-Lips) injection to deplete PVCs (bottom). Under basal conditions, small circular profiles (red arrowheads) are associated with the vessel; the adjoining parenchyma contains more strongly labeled glial-like cells/processes (blue arrowheads). Enhanced COX-1-immunoreactive vascular labeling after IL-1 or LPS challenges takes two forms, one in which the circular (perinuclear-like) labeling seen under basal conditions is more intense and associated with punctate cytoplasmic labeling (red arrowheads and outlines) and the other comprising homogeneously stained round (nuclear-like) profiles (green arrows). In liposome-pretreated rats, cells displaying perinuclear plus cytoplasmic labeling (presumed PVCs) are not seen, whereas labeling of the other cell type (presumed endothelia) is enhanced. Scale bar, 25 μm.
Figure 4.

Two vascular cell types display COX-1-IR. Bright-field photomicrograph from an LPS-treated rat (2 μg/kg, i.v.) showing two distinct labeling patterns of vascular COX-1-immunoreactive cells. One, which we interpret as representing nuclear/perinuclear labeling of endothelial cells (arrows), appears as relatively homogeneous staining of round profiles 7–9 μm in diameter. The second, of presumed PVCs, appears as dense perinuclear staining associated with patches of reaction product in the cytoplasm. Scale bar, 10 μm.
Suspecting that the ring-like and evenly stained vascular cell types conformed to PVCs and ECs, respectively, we performed an assessment of COX-1 labeling in rats pretreated 5–7 d earlier with clodronate liposomes, which deplete PVCs and enhance endothelial responses to an LPS challenge (Schiltz and Sawchenko, 2003). This procedure resulted in the absence of ring-like COX-1 labeling and a marked enhancement of profiles exhibiting more uniform nuclear staining in control rats and animals subjected to either immune challenge (Fig. 3).
COX-1 response to LPS in vascular-associated cells
To clarify how regulatory influences are exerted on COX-1-IR in vascular associated cells, we assessed the density of COX-1-positive cells exhibiting endothelial or perivascular morphology per unit of vascular area at 1 h after an LPS challenge in control rats and in ones pretreated with clodronate-containing liposomes. In control rats treated with saline, vascular COX-1-IR was detected only in perivascular cells, whose number was not reliably altered after an LPS challenge (p > 0.10) (Fig. 5). LPS did, however, provoke a marked induction of COX-1-IR in endothelial cells of normal rats (1326 ± 96 cells/mm2) and a highly reliable increase in total vascular density of labeled cells (p < 0.001). Liposome-mediated perivascular cell depletion resulted in an upregulation of basal COX-1 expression in endothelia and a near doubling of the total number of vascular (endothelial) cells displaying COX-1-IR (2521 ± 134 cells/mm2) (Fig. 5). In contrast, a more general measure of relative brain COX-1 protein level taken by quantitative Western blot analysis of rat and mouse brain homogenates (n = 3 per group) revealed no reliable differences between control and LPS-treated animals (p values >0.10; data not shown). This suggests that relatively stable levels of parenchymal COX-1 expression may dilute immune challenge-induced alterations in vascular-associated cells.
Figure 5.

Regulation of COX-1-IR in vascular cell types. Mean ± SEM density (cell number per square millimeter vascular area) of cells identified on morphological grounds as perivascular (black bars) or endothelial cells (gray) as a function of treatment status. Under control (Con) conditions, COX-1 is detected only in perivascular cells, and their number is not significantly affected at 1 h after an LPS challenge. LPS does, however, result in enzyme induction in endothelia and a highly reliable increase in total vascular COX-1-positive cell density. Perivascular cell depletion after intracerebroventricular clodronate liposome (Lip) treatment results in enhanced endothelial COX-1 expression under both control and LPS challenge conditions. n = 3 per group. *p < 0.001 versus saline-injected counterparts. †p < 0.001 versus LPS-injected control animals.
Phenotype of vascular and parenchymal COX-1-expressing cells
Dual immunolabeling was performed to solidify the phenotype of COX-1-expressing cells. Costaining using Iba-1 to mark both microglia and PVCs (Fig. 6) revealed COX-1 labeling of smaller and larger subsets of Iba-1-positive parenchymal cells and vascular-associated cells displaying ring-like nuclear/perinuclear staining. Costaining was observed in untreated or saline-injected control rats and was more prominent in IL-1- or LPS-challenged animals. Confocal analysis of Iba-1/COX-1 labeling of microglia from control and LPS-stimulated rats provided clear indications of the thickening and retraction of processes characteristic of microglial activation. In none of these experiments did round vascular profiles displaying uniform COX-1 staining in stimulated rats colocalize with Iba-1. These did, however, consistently costain for an endothelial marker, von Willebrand factor.
Figure 6.
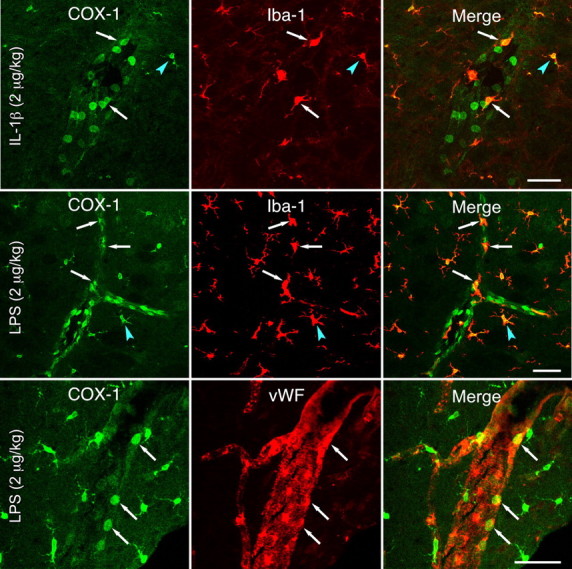
Phenotype of vascular and parenchymal COX-1-expressing cells. Sections through the medulla of IL-1β-challenged (top row) or LPS-challenged (bottom two rows) rats colabeled for COX-1 and either Iba-1, a microglial and PVC marker (top two rows), or von Willebrand factor (vWF), which marks ECs discretely (bottom). COX-1 localizes to both PVCs (arrows) and microglia (arrowheads), with areas of overlap appearing yellow in the merged images (right). COX-1-IR is also present in many round, Iba-1-negative profiles, which colocalize extensively with von Willebrand factor (bottom row). Scale bars, 50 μm.
Fine structure
To further characterize the cellular disposition of COX-1-IR, an ultrastructural analysis was undertaken. Preembedding staining for COX-1-IR of sections through the medulla and ventral forebrain derived from two saline-challenged and three LPS-challenged rats (100 μg/kg, i.v.) labeled multipolar cells in perivascular spaces between the endothelial basal lamina and the glial limitans (Fig. 7). They were distinguished by a relatively high density of lysosomes, multivesicular bodies, and vacuoles of varying sizes, consistent with previous descriptions of PVCs (Graeber and Streit, 1990; Schiltz and Sawchenko, 2002). COX-1 reaction product in PVCs was closely and continuously associated with the nuclear membrane and, more sporadically, with the Golgi apparatus and endoplasmic reticulum, mainly in the perinuclear region. Such PVC labeling was detectable in control rats and more prominent on LPS-challenged ones. This contrasts with COX-1 labeling of ECs, which was seen only in stimulated animals, in the form of patches of reaction product around, but never clearly within, the nucleus and occasionally in cytoplasmic organelles identified as lysosomes or multivesicular bodies.
Figure 7.
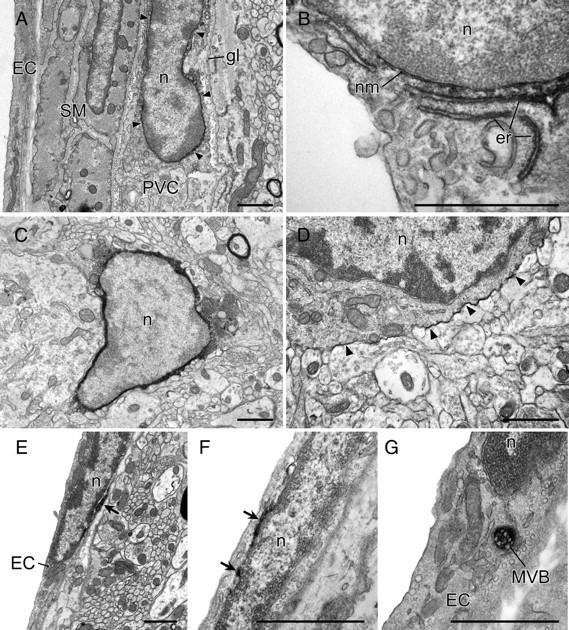
Fine structure of COX-1-immunoreactive vascular and parenchymal cells. Immunoelectron micrographs showing features of COX-1-immunoreactive labeling of perivascular (top), microglia (middle), and endothelial (bottom) cells. In PVCs, COX-1-IR displays a continuous association with the nuclear membrane (nm, arrows in A) and is also observed in portions of the endoplasmic reticulum (er) near the nucleus (n; see B). In microglial cells, identified on the basis of size, and relatively scant and electron-dense cytoplasm, reaction product in microglia was densely distributed throughout the cytoplasm (C) but, in a few cases, was restricted to the cytoplasmic membrane (D, arrowheads). COX-1-immunoreactive labeling of EC patchy accumulations of reaction product associated with the nuclear membrane (E, F). In addition, COX-1-immunoreactive labeling was occasionally observed in lysosomes or multivesicular bodies (MVB in G). gl, Glia limitans; SM, smooth muscle cell. Scale bars, 1 μm.
COX-1-IR was also detected in small parenchymal profiles that exhibited morphological features of microglia, including scant and relatively dense cytoplasm, and nuclei with numerous heterochromatin condensations (Fig. 7). The subcellular distribution of reaction product in microglia differed from that seen in vascular cells in being densely and evenly distributed throughout the cytoplasm. Rare examples were also seen of microglia in which labeling was ostensibly restricted to the plasma membrane.
LPS-induced CNS activational profiles in wild-type and COX-1-deficient mice
Tissue from COX-1 null and wild-type control mice killed 3 h after saline or LPS injection (10 or 100 μg/kg, i.p.) was used to examine central activational profiles (Fos protein induction) in a cluster of interconnected central autonomic cell groups implicated in HPA and other acute phase responses (Fig. 8). These included the oval subnucleus of the bed nucleus of the stria terminalis (BSTov), the central nucleus of the amygdala (CeA), the PVH, the lateral parabrachial nucleus (PBl), and medial division of the nucleus of the solitary tract (NTSm). In wild-type mice, each cell group examined displayed reliable increases in the number of Fos-immunoreactive neurons after either LPS challenge. Reponses to the lower dose of LPS were significantly reduced in the BSTov and PVH of COX-1 null mice, although in none of the regions examined were responses of knock-out mice to 10 μg/kg LPS reliably greater than controls. Under the higher endotoxin dose, COX-1-deficient mice showed significantly reduced Fos induction in all cell groups examined, with values from only the NTSm and the PBl remaining reliably elevated over control (saline-injected) levels. Thus, COX-1 deficiency markedly reduced LPS-mediated engagement of central autonomic circuitry, including in cell groups implicated directly in HPA control.
Figure 8.

Attenuated CNS activational profiles in COX-1-deficient mice. Mean ± SEM number of Fos-immunoreactive cells in select CNS cells at 3 h after intraperitoneal injection of saline or 10 or 100 μg/kg LPS. LPS provoked graded and reliable increases in Fos-IR in each cell group examined (all p < 0.5 versus saline-injected controls; Sal). Reponses to lower dose of LPS were significantly reduced in the BSTov and PVH of COX-1 null mice, although in none of the regions examined were LPS responses reliably greater than controls. In response to the higher endotoxin dose, COX-1-deficient mice showed significantly reduced Fos induction in all cell groups examined, with values from only the NTSm and the PBl remaining reliably elevated over control (saline-injected) levels. n = 4 per group. *p < 0.05, **p < 0.01, ***p < 0.001, differs significantly from COX-1 knock-out counterpart. †p < 0.05, differs significantly from saline-injected counterpart. WT, Wild type; KO, knock-out.
Central, but not systemic, inhibition of COX-1 activity reduces LPS-induced HPA secretory responses
To assess the functional involvement of COX-1, the effect of pretreatment with central (50 μg in 5 μl, i.c.v.) or systemic (10 mg/kg, i.v.) administration of selective COX-1 (SC-560; 50 μg, i.c.v.; 10 mg/kg, i.v.) or COX-2 (NS-398; 25 μg, i.c.v.; 5 mg/kg i.v.) inhibitors on basal and LPS-induced plasma ACTH and corticosterone titers were determined. Blood samples were collected at 1 h after LPS injection, a time at which we found both hormonal responses and tissue PGE2 levels to near maximal under the same LPS challenge conditions (J. Serrats, B. García-Bueno, and P. Sawchenko, unpublished observations). Pretreatment with SC-560 did not significantly affect basal levels of either hormone when delivered by either route (Fig. 9). Central, but not systemic, administration of the blocker reliably blunted LPS-induced elevations of ACTH (by 40%) and corticosterone (37%). At the dosage levels used, COX-2 inhibition via NS-398 did not significantly affect stress hormone levels via either route of administration.
Figure 9.

Central inhibition of COX-1 (but not COX-2) activity reduces LPS-induced HPA axis secretory responses. Mean ± SEM plasma levels of ACTH (top) and corticosterone (middle) and of brain tissue (hypothalamic) PGE2 levels (bottom) in rats pretreated centrally (left column) or systemically (right column) with the selective COX-1 inhibitor SC-560 (SC; 50 μg in 5 μl, i.c.v., or 10 mg/kg, i.v.), the selective COX-2 inhibitor NS-398 (NS; 25 μg in 5 μl, i.c.v., or 5 mg/kg, i.v.), or vehicle (Veh) before intravenous injection of LPS (2 μg/kg) or saline. Central, but not systemic, COX-1 blockade, but not COX-2 blockade, significantly attenuated ACTH and corticosterone secretory responses, as well as tissue (hypothalamic) PGE2 concentrations, at this time point. *p < 0.05 versus saline-injected animals. n = 5 per group. †p < 0.05 versus vehicle-pretreated groups challenged with LPS.
Regional (hypothalamic and medullary) tissue levels of PGE2 in these same animals were affected in parallel, with the LPS-induced increment being significantly dampened (by 56% in hypothalamus) by intracerebroventricular pretreatment with SC-560 (p < 0.05), whereas systemic administration of this drug had no reliable effect. In addition, by neither route of administration did the COX-2 inhibitor NS-398 significantly alter tissue prostanoid levels.
Finally, to determine the time frame over which central COX-1 is involved in LPS-induced HPA activation, intracerebroventricular SC-560 or vehicle was administered to separate groups of rats with indwelling jugular catheters to permit repeated blood sampling. In this experiment, drug treatment significantly attenuated the ACTH and corticosterone responses only at the earliest time point examined (30 min) after LPS administration (Fig. 10).
Figure 10.

Inhibition of COX-1 activity disrupts the early phase of LPS-induced HPA secretory responses. Time course of changes induced by LPS (2 μg/kg, i.v.) in mean ± SEM plasma levels of ACTH (top) and corticosterone (bottom) in rats pretreated centrally with the selective COX-1 inhibitor SC-560 (50 μg, i.c.v.), or vehicle. Only at the earliest time point examined (30 min after LPS) did COX-1 blockade significantly alter (reduce) both stress hormone responses, to levels that did not differ reliably from prestress (0 min) values. These data support the hypothesis that COX-1 is involved in the initial stages of the activation of the HPA axis. n = 4 per group. *p < 0.05 versus vehicle-pretreated control; ns, nonsignificant versus basal (0 min) value.
Discussion
We have localized COX-1 expression to two cerebrovascular cell types implicated in immune-to-brain signaling, as well as to parenchymal microglia, and demonstrated sensitivity of vascular cells to proinflammatory challenges. Negative regulation of endothelial COX-1 expression by unidentified factor(s) originating in PVCs is also indicated. Genetic or pharmacological disruption of COX-1 attenuates endotoxin-stimulated engagement of HPA control circuitry and secretory responses, supporting a role for COX-1-dependent prostanoid synthesis in this acute phase response.
Relationship to previous studies
Although COX-1 mRNA and protein expression are detectable in normal brain tissue (Ivanov et al., 2002; Aid et al., 2008), we are unaware of previous evidence for cerebrovascular enzyme expression under basal or endotoxin-stimulated conditions. Our findings thus seem to challenge evidence that brain COX-1 is insensitive to proinflammatory challenges (Ivanov and Romanovsky, 2004). This apparent disparity may be explained by the fact that COX-1 is normally expressed principally by parenchymal (microglial) cells that may be LPS unresponsive but that could serve to dilute regulatory effects on vascular enzyme expression. Our failure to detect LPS effects on COX-1-IR in brain homogenates is consistent with this view.
Previous evidence supporting COX-1 localization to CNS vascular or glial cells has been gathered primarily in injury or disease models. Accumulation of COX-1-expressing macrophages and upregulation by ECs and microglia has been reported after spinal injury in rats (Schwab et al., 2000a) and after focal cerebrovascular ischemia or traumatic brain injury in humans (Schwab et al., 2000b, 2002). Similar observations have been reported in microglia of Alzheimer's disease patients (Yermakova et al., 1999). Increased COX-1 mRNA has been demonstrated in the choroid plexus of endotoxin-challenged pigs (Vellucci and Parrott, 1998). Others, however, have failed to detect COX-1 mRNA in brain under basal or LPS challenge conditions (Lacroix and Rivest, 1998; Cover et al., 2001), giving rise to the prevailing view that immune challenge-induced prostanoid production is driven primarily or exclusively by the inducible COX-2 isoform. This idea found support in studies using pharmacologic or genetic disruption of COX-1 that failed to implicate the enzyme in HPA (Blais et al., 2005) or febrile (Li et al., 1999) responses to LPS.
Work with pharmacologic inhibitors has supported COX-1 involvement in HPA responses to diverse challenges (Bugajski et al., 2001, 2002; Bugajski and Gadek-Michalska, 2003; Reimsnider and Wood, 2006), including LPS (Gadek-Michalska and Bugajski, 2004). Two studies, in particular, have rekindled interest in COX-1 involvement in CNS acute phase responses. Zhang et al. (2003) compared the effects of selective COX inhibitors on LPS-induced fever and CNS activational profiles, finding that COX-1 blockade resulted in protracted hypothermia and attenuated Fos induction in a similar set of central autonomic cell groups that we find to be under-responsive in COX-1-deficient mice. These include the PVH, the seat of neurosecretory neurons that express CRF and initiate HPA responses to stress (Sawchenko et al., 1996, 2000), and the NTS, which, along with the ventrolateral medulla, provides a major input to the PVH implicated in mediating cytokine/LPS-induced HPA activation (Ericsson et al., 1994; Schiltz and Sawchenko, 2007). Recently, Elander et al. (2009) reported that rapid HPA responses to LPS were blunted by nonselective COX inhibition but were unaffected by COX-2 blockade or genetic deletion of the terminal synthase (mPGES-1) to which COX-2 activity is coupled, indirectly implicating COX-1 in the process. In this study, Fos induction in COX-1-deficient mice was comparable with that of wild-type controls. The basis for the disparity in the latter regard between this and the present study is unclear, particularly because the same knock-out line and similar LPS treatment parameters were used in each. We note, however, that we do not believe that the profound dampening of LPS-induced Fos-IR in COX-1 null mice is necessarily indicative of a dominant role for COX-1 mechanisms in HPA activation. We have encountered examples in the central cardiovascular system in which hypertensive stimuli of brief duration may elicit induction of c-fos mRNA but not detectable Fos-IR, whereas sustained elevations in blood pressure to similar peak levels give rise to comparable c-fos message and protein responses (Chan and Sawchenko, 1994, 1998). Thus, the salience of an acute stimulus seems an important determinant of the strength of Fos signals, and, because COX-1 is implicated in the initial phase of LPS-induced HPA activation, we suspect that the absence of this early drive in knock-out mice results in diminution of Fos induction to a degree that overestimates COX-1 involvement.
Distribution and regulation of COX-1
We have characterized an antibody that supports basal COX-1-immunoreactive localization to PVCs and microglia of the CNS; enzyme expression in PVCs and ECs is enhanced after LPS challenge. This identifies a substrate for studies cited above supporting COX-1 involvement in immune-to-brain signaling and a potential means of accounting for the rapidity of prostaglandin-dependent acute phase responses, which is not readily explained by the delayed activity expected of an inducible (COX-2) enzyme. We find distinct cellular/subcellular distributions of COX-1-IR in different cell types: diffusely cytoplasmic in microglia, nuclear/perinuclear in ECs, and perinuclear with patchy cytoplasmic accumulations in PVCs. The staining pattern in ECs is similar to that described for COX-2 (Schiltz and Sawchenko, 2002), whose overexpression can affect a range of nuclear functions via mechanisms that are unclear and not necessarily prostanoid mediated (Parfenova et al., 2001). In PVCs, the distribution of labeling is akin to that reported for COX-1 in cultured monocytes or endothelial cells (Spencer et al., 1998; Parfenova et al., 2001), in which association with nuclear pores has implicated the enzyme in trafficking across the nuclear membrane and transcriptional regulation.
Using liposome-based targeting methods, we have identified PVCs as imparting a potent restraining influence on EC activity, including LPS-induced COX-2 (Schiltz and Sawchenko, 2003) and, now, COX-1 expression. Identifying the molecular mediator(s) of this anti-inflammatory effect will have broad implications for understanding the transit of immune signaling across the blood–brain barrier to involve, for example, microglia, which must be considered along with vascular cells as potential sources of prostaglandins for engaging CNS response systems.
It is worth noting that a COX-1 splice variant, first identified in dogs (Chandrasekharan et al., 2002), has been suggested to represent a distinct isoform, COX-3. In rodents and humans, however, COX-3 encodes proteins whose amino acid sequences are completely divergent from those of COX-1 or COX-2 and that do not display appreciable COX activity (Kis et al., 2005). It is thus unlikely that COX-3 represented a confounding factor in our studies.
COX-1 in immune challenge-induced HPA activation
Present findings of attenuated LPS-induced Fos expression in HPA-relevant cell groups of COX-1-deficient mice and of diminished stress hormone responses in rats pretreated centrally, but not systemically, with a selective COX-1 inhibitor support recent reports (Zhang et al., 2003; Elander et al., 2009) implicating the enzyme in centrally mediated acute phase reactions. Time course analyses indicate COX-1 involvement in the initial phases of LPS-induced HPA activation. Interestingly, Ivanov et al. (2002) report downregulation of COX-1 mRNA in hypothalamus and peripheral tissues during the later phases of LPS-induced fever, consistent with COX-1 influences being exerted over particular time domains. Caution is warranted in interpreting the results of such pharmacologic interventions, because off-target effects of isoform-selective COX inhibitors may occur with variations in dose or experimental setting (Brenneis et al., 2006). Supporting the validity of the present findings are the observations that a selective COX-2 inhibitor failed to affect LPS-induced HPA secretory responses or tissue PGE2 levels at a time point at which COX-1 blockade was effective and that COX-1-deficient mice displayed a compatible dampening of LPS-induced recruitment of HPA control circuitry.
General implications
Our studies demonstrate cerebrovascular COX-1 expression under resting conditions that is responsive to inflammatory challenges, suggesting an involvement of COX-1 in bidirectional interplay between ECs and PVCs in sculpting vascular PGE2 production and early downstream responses of the HPA axis. Additional work is needed to parse its role and those of COX-2 and terminal synthases in producing spatially and temporally coordinated prostanoid production to achieve appropriate adaptation to inflammatory/immune insults.
Because of the risk for adverse vascular events linked to the use of COX-2 inhibitors, attention has turned to alternate targets in prostanoid biosynthesis for managing inflammatory disease. COX-1-dependent proinflammatory effects have been implicated in a wide range of neurodegenerative disorders, and work in various models supports prominent involvement of microglial COX-1 in neuroinflammation (Schwab et al., 2002; Pepicelli et al., 2005; Candelario-Jalil et al., 2007; Choi et al., 2008, 2009). Attempting to globally target COX-1 or its associated PGE2 synthase (cPGES) would incur the same risk of peptic ulceration and dyspepsia that limit the utility of nonselective COX inhibitors. In this regard, attributes of PVCs may provide leverage in achieving selective targeting. This cell type expresses COX-1 basally, is sensitive to inflammatory stimuli, and negatively regulates the vascular endothelium and, hence, the transit of immune signals across the blood–brain barrier. PVCs derive from bone marrow progenitors that can be manipulated ex vivo, and the feasibility of using these precursors as vehicles for gene therapy has been established (Priller et al., 2001).
Footnotes
This work was supported by National Institutes of Health Grant NS-21182 and was conducted in part by the Clayton Medical Research Foundation. P.E.S. is a Senior Investigator of the Clayton Medical Research Foundation. Fellowship support was provided by the Spanish Ministry of Education and Science (B.G.B., J.S.), CIBERsam (B.G.B.), and the Carlos III Health Institute (J.S.). We thank Dr. R. Langenbach (National Institutes of Health/National Institute of Environmental Health Sciences) for generously providing COX-1 null mice and Carlos Arias, Kris Trulock, and Casey Peto for excellent assistance with surgery/histology, imaging/graphics, and electron microscopy, respectively.
References
- Abercrombie M. Estimation of nuclear populations from microtome sections. Anat Rec. 1946;94:239–247. doi: 10.1002/ar.1090940210. [DOI] [PubMed] [Google Scholar]
- Aid S, Langenbach R, Bosetti F. Neuroinflammatory response to lipopolysaccharide is exacerbated in mice genetically deficient in cyclooxygenase-2. J Neuroinflammation. 2008;5:17. doi: 10.1186/1742-2094-5-17. [DOI] [PMC free article] [PubMed] [Google Scholar]
- Arai I, Hamasaka Y, Futaki N, Takahashi S, Yoshikawa K, Higuchi S, Otomo S. Effect of NS-398, a new nonsteroidal anti-inflammatory agent, on gastric ulceration and acid secretion in rats. Res Commun Chem Pathol Pharmacol. 1993;81:259–270. [PubMed] [Google Scholar]
- Besedovsky H, del Rey A, Sorkin E, Dinarello CA. Immunoregulatory feedback between interleukin-1 and glucocorticoid hormones. Science. 1986;233:652–654. doi: 10.1126/science.3014662. [DOI] [PubMed] [Google Scholar]
- Black PH. Stress and the inflammatory response: a review of neurogenic inflammation. Brain Behav Immun. 2002;16:622–653. doi: 10.1016/s0889-1591(02)00021-1. [DOI] [PubMed] [Google Scholar]
- Blais V, Turrin NP, Rivest S. Cyclooxygenase 2 (COX-2) inhibition increases the inflammatory response in the brain during systemic immune stimuli. J Neurochem. 2005;95:1563–1574. doi: 10.1111/j.1471-4159.2005.03480.x. [DOI] [PubMed] [Google Scholar]
- Bosetti F, Langenbach R, Weerasinghe GR. Prostaglandin E2 and microsomal prostaglandin E synthase-2 expression are decreased in the cyclooxygenase-2-deficient mouse brain despite compensatory induction of cyclooxygenase-1 and Ca2+-dependent phospholipase A2. J Neurochem. 2004;91:1389–1397. doi: 10.1111/j.1471-4159.2004.02829.x. [DOI] [PubMed] [Google Scholar]
- Brenneis C, Maier TJ, Schmidt R, Hofacker A, Zulauf L, Jakobsson PJ, Scholich K, Geisslinger G. Inhibition of prostaglandin E2 synthesis by SC-560 is independent of cyclooxygenase 1 inhibition. FASEB J. 2006;20:1352–1360. doi: 10.1096/fj.05-5346com. [DOI] [PubMed] [Google Scholar]
- Bugajski J, Gadek-Michalska A. Effect of cyclooxygenase inhibitors on the vasopressin induced ACTH and corticosterone response during crowding stress. J Physiol Pharmacol. 2003;54:247–256. [PubMed] [Google Scholar]
- Bugajski J, Głód R, Gadek-Michalska A, Bugajski AJ. Involvement of constitutive (COX-1) and inducible cyclooxygenase (COX-2) in the adrenergic-induced ACTH and corticosterone secretion. J Physiol Pharmacol. 2001;52:795–809. [PubMed] [Google Scholar]
- Bugajski J, Gadek-Michalska A, Bugajski AJ. Effect of constitutive- and inducible-cyclooxygenase in the carbachol-induced pituitary-adrenocortical response during social stress. J Physiol Pharmacol. 2002;53:453–462. [PubMed] [Google Scholar]
- Candelario-Jalil E, de Oliveira AC, Gräf S, Bhatia HS, Hüll M, Muñoz E, Fiebich BL. Resveratrol potently reduces prostaglandin E2 production and free radical formation in lipopolysaccharide-activated primary rat microglia. J Neuroinflammation. 2007;4:25. doi: 10.1186/1742-2094-4-25. [DOI] [PMC free article] [PubMed] [Google Scholar]
- Chan RK, Sawchenko PE. Spatially and temporally differentiated patterns of c-fos expression in brainstem catecholaminergic cell groups induced by cardiovascular challenges in the rat. J Comp Neurol. 1994;348:433–460. doi: 10.1002/cne.903480309. [DOI] [PubMed] [Google Scholar]
- Chan RK, Sawchenko PE. Organization and transmitter specificity of medullary neurons activated by sustained hypertension: implications for understanding baroreceptor reflex circuitry. J Neurosci. 1998;18:371–387. doi: 10.1523/JNEUROSCI.18-01-00371.1998. [DOI] [PMC free article] [PubMed] [Google Scholar]
- Chandrasekharan NV, Dai H, Roos KL, Evanson NK, Tomsik J, Elton TS, Simmons DL. COX-3, a cyclooxygenase-1 variant inhibited by acetaminophen and other analgesic/antipyretic drugs: cloning, structure, and expression. Proc Natl Acad Sci U S A. 2002;99:13926–13931. doi: 10.1073/pnas.162468699. [DOI] [PMC free article] [PubMed] [Google Scholar]
- Choi SH, Langenbach R, Bosetti F. Genetic deletion or pharmacological inhibition of cyclooxygenase-1 attenuate lipopolysaccharide-induced inflammatory response and brain injury. FASEB J. 2008;22:1491–1501. doi: 10.1096/fj.07-9411com. [DOI] [PMC free article] [PubMed] [Google Scholar]
- Choi SH, Aid S, Bosetti F. The distinct roles of cyclooxygenase-1 and -2 in neuroinflammation: implications for translational research. Trends Pharmacol Sci. 2009;30:174–181. doi: 10.1016/j.tips.2009.01.002. [DOI] [PMC free article] [PubMed] [Google Scholar]
- Cover PO, Slater D, Buckingham JC. Expression of cyclooxygenase enzymes in rat hypothalamo-pituitary-adrenal axis: effects of endotoxin and glucocorticoids. Endocrine. 2001;16:123–131. doi: 10.1385/ENDO:16:2:123. [DOI] [PubMed] [Google Scholar]
- Dinarello CA. Interleukin-1 and the pathogenesis of the acute-phase response. N Engl J Med. 1984;311:1413–1418. doi: 10.1056/NEJM198411293112205. [DOI] [PubMed] [Google Scholar]
- Dinarello CA. Inflammatory cytokines: interleukin-1 and tumor necrosis factor as effector molecules in autoimmune diseases. Curr Opin Immunol. 1991;3:941–948. doi: 10.1016/s0952-7915(05)80018-4. [DOI] [PubMed] [Google Scholar]
- Elander L, Engström L, Ruud J, Mackerlova L, Jakobsson PJ, Engblom D, Nilsberth C, Blomqvist A. Inducible prostaglandin E2 synthesis interacts in a temporally supplementary sequence with constitutive prostaglandin-synthesizing enzymes in creating the hypothalamic-pituitary-adrenal axis response to immune challenge. J Neurosci. 2009;29:1404–1413. doi: 10.1523/JNEUROSCI.5247-08.2009. [DOI] [PMC free article] [PubMed] [Google Scholar]
- Ericsson A, Kovács KJ, Sawchenko PE. A functional anatomical analysis of central pathways subserving the effects of interleukin-1 on stress-related neuroendocrine neurons. J Neurosci. 1994;14:897–913. doi: 10.1523/JNEUROSCI.14-02-00897.1994. [DOI] [PMC free article] [PubMed] [Google Scholar]
- Ericsson A, Arias C, Sawchenko PE. Evidence for an intramedullary prostaglandin-dependent mechanism in the activation of stress-related neuroendocrine circuitry by intravenous interleukin-1. J Neurosci. 1997;17:7166–7179. doi: 10.1523/JNEUROSCI.17-18-07166.1997. [DOI] [PMC free article] [PubMed] [Google Scholar]
- Forsberg L, Leeb L, Thorén S, Morgenstern R, Jakobsson P. Human glutathione dependent prostaglandin E synthase: gene structure and regulation. FEBS Lett. 2000;471:78–82. doi: 10.1016/s0014-5793(00)01367-3. [DOI] [PubMed] [Google Scholar]
- Futaki N, Yoshikawa K, Hamasaka Y, Arai I, Higuchi S, Iizuka H, Otomo S. NS-398, a novel non-steroidal anti-inflammatory drug with potent analgesic and antipyretic effects, which causes minimal stomach lesions. Gen Pharmacol. 1993;24:105–110. doi: 10.1016/0306-3623(93)90018-s. [DOI] [PubMed] [Google Scholar]
- Gadek-Michalska A, Bugajski J. Role of prostaglandins and nitric oxide in the lipopolysaccharide-induced ACTH and corticosterone response. J Physiol Pharmacol. 2004;55:663–675. [PubMed] [Google Scholar]
- Graeber MB, Streit WJ. Perivascular microglia defined. Trends Neurosci. 1990;13:366. doi: 10.1016/0166-2236(90)90020-B. [DOI] [PubMed] [Google Scholar]
- Hart BL. Biological basis of the behavior of sick animals. Neurosci Biobehav Rev. 1988;12:123–137. doi: 10.1016/s0149-7634(88)80004-6. [DOI] [PubMed] [Google Scholar]
- Imai Y, Kohsaka S. Intracellular signaling in M-CSF-induced microglia activation: role of Iba1. Glia. 2002;40:164–174. doi: 10.1002/glia.10149. [DOI] [PubMed] [Google Scholar]
- Ivanov AI, Romanovsky AA. Prostaglandin E2 as a mediator of fever: synthesis and catabolism. Front Biosci. 2004;9:1977–1993. doi: 10.2741/1383. [DOI] [PubMed] [Google Scholar]
- Ivanov AI, Pero RS, Scheck AC, Romanovsky AA. Prostaglandin E(2)-synthesizing enzymes in fever: differential transcriptional regulation. Am J Physiol Regul Integr Comp Physiol. 2002;283:R1104–R1117. doi: 10.1152/ajpregu.00347.2002. [DOI] [PubMed] [Google Scholar]
- Jakobsson PJ, Thorén S, Morgenstern R, Samuelsson B. Identification of human prostaglandin E synthase: a microsomal, glutathione-dependent, inducible enzyme, constituting a potential novel drug target. Proc Natl Acad Sci U S A. 1999;96:7220–7225. doi: 10.1073/pnas.96.13.7220. [DOI] [PMC free article] [PubMed] [Google Scholar]
- Kis B, Snipes JA, Busija DW. Acetaminophen and the cyclooxygenase-3 puzzle: sorting out facts, fictions, and uncertainties. J Pharmacol Exp Ther. 2005;315:1–7. doi: 10.1124/jpet.105.085431. [DOI] [PubMed] [Google Scholar]
- Konsman JP, Parnet P, Dantzer R. Cytokine-induced sickness behaviour: mechanisms and implications. Trends Neurosci. 2002;25:154–159. doi: 10.1016/s0166-2236(00)02088-9. [DOI] [PubMed] [Google Scholar]
- Lacroix S, Rivest S. Effect of acute systemic inflammatory response and cytokines on the transcription of the genes encoding cyclooxygenase enzymes (COX-1 and COX-2) in the rat brain. J Neurochem. 1998;70:452–466. doi: 10.1046/j.1471-4159.1998.70020452.x. [DOI] [PubMed] [Google Scholar]
- Langenbach R, Morham SG, Tiano HF, Loftin CD, Ghanayem BI, Chulada PC, Mahler JF, Lee CA, Goulding EH, Kluckman KD, Kim HS, Smithies O. Prostaglandin synthase 1 gene disruption in mice reduces arachidonic acid-induced inflammation and indomethacin-induced gastric ulceration. Cell. 1995;83:483–492. doi: 10.1016/0092-8674(95)90126-4. [DOI] [PubMed] [Google Scholar]
- Li HY, Ericsson A, Sawchenko PE. Distinct mechanisms underlie activation of hypothalamic neurosecretory neurons and their medullary catecholaminergic afferents in categorically different stress paradigms. Proc Natl Acad Sci U S A. 1996;93:2359–2364. doi: 10.1073/pnas.93.6.2359. [DOI] [PMC free article] [PubMed] [Google Scholar]
- Li S, Wang Y, Matsumura K, Ballou LR, Morham SG, Blatteis CM. The febrile response to lipopolysaccharide is blocked in cyclooxygenase-2(−/−), but not in cyclooxygenase-1(−/−) mice. Brain Res. 1999;825:86–94. doi: 10.1016/s0006-8993(99)01225-1. [DOI] [PubMed] [Google Scholar]
- Masferrer JL, Koki A, Seibert K. COX-2 inhibitors. A new class of antiangiogenic agents. Ann NY Acad Sci. 1999;889:84–86. doi: 10.1111/j.1749-6632.1999.tb08726.x. [DOI] [PubMed] [Google Scholar]
- Murakami M, Nakatani Y, Tanioka T, Kudo I. Prostaglandin E synthase. Prostaglandins Other Lipid Mediat. 2002;68–69:383–399. doi: 10.1016/s0090-6980(02)00043-6. [DOI] [PubMed] [Google Scholar]
- Parfenova H, Parfenov VN, Shlopov BV, Levine V, Falkos S, Pourcyrous M, Leffler CW. Dynamics of nuclear localization sites for COX-2 in vascular endothelial cells. Am J Physiol Cell Physiol. 2001;281:C166–C178. doi: 10.1152/ajpcell.2001.281.1.C166. [DOI] [PubMed] [Google Scholar]
- Pepicelli O, Fedele E, Berardi M, Raiteri M, Levi G, Greco A, Ajmone-Cat MA, Minghetti L. Cyclo-oxygenase-1 and -2 differently contribute to prostaglandin E2 synthesis and lipid peroxidation after in vivo activation of N-methyl-d-aspartate receptors in rat hippocampus. J Neurochem. 2005;93:1561–1567. doi: 10.1111/j.1471-4159.2005.03150.x. [DOI] [PubMed] [Google Scholar]
- Polfliet MM, Goede PH, van Kesteren-Hendrikx EM, van Rooijen N, Dijkstra CD, van den Berg TK. A method for the selective depletion of perivascular and meningeal macrophages in the central nervous system. J Neuroimmunol. 2001;116:188–195. doi: 10.1016/s0165-5728(01)00282-x. [DOI] [PubMed] [Google Scholar]
- Priller J, Flügel A, Wehner T, Boentert M, Haas CA, Prinz M, Fernández-Klett F, Prass K, Bechmann I, de Boer BA, Frotscher M, Kreutzberg GW, Persons DA, Dirnagl U. Targeting gene-modified hematopoietic cells to the central nervous system: use of green fluorescent protein uncovers microglial engraftment. Nat Med. 2001;7:1356–1361. doi: 10.1038/nm1201-1356. [DOI] [PubMed] [Google Scholar]
- Reimsnider S, Wood CE. Differential modulation of ovine fetal ACTH secretion by PGHS-1 and PGHS-2. Neuroendocrinology. 2006;83:4–11. doi: 10.1159/000093177. [DOI] [PubMed] [Google Scholar]
- Sapolsky R, Rivier C, Yamamoto G, Plotsky P, Vale W. Interleukin-1 stimulates the secretion of hypothalamic corticotropin-releasing factor. Science. 1987;238:522–524. doi: 10.1126/science.2821621. [DOI] [PubMed] [Google Scholar]
- Sawchenko PE, Cunningham ET, Jr, Mortrud MT, Pfeiffer SW. Phaseolus vulgaris-leucoagglutinin (PHA-L) anterograde axonal transport technique. Methods Neurosci. 1990;3:247–260. [Google Scholar]
- Sawchenko PE, Brown ER, Chan RK, Ericsson A, Li HY, Roland BL, Kovács KJ. The paraventricular nucleus of the hypothalamus and the functional neuroanatomy of visceromotor responses to stress. Prog Brain Res. 1996;107:201–222. doi: 10.1016/s0079-6123(08)61866-x. [DOI] [PubMed] [Google Scholar]
- Sawchenko PE, Li HY, Ericsson A. Circuits and mechanisms governing hypothalamic responses to stress: a tale of two paradigms. Prog Brain Res. 2000;122:61–78. doi: 10.1016/s0079-6123(08)62131-7. [DOI] [PubMed] [Google Scholar]
- Scammell TE, Griffin JD, Elmquist JK, Saper CB. Microinjection of a cyclooxygenase inhibitor into the anteroventral preoptic region attenuates LPS fever. Am J Physiol. 1998;274:R783–R789. doi: 10.1152/ajpregu.1998.274.3.R783. [DOI] [PubMed] [Google Scholar]
- Schiltz JC, Sawchenko PE. Distinct brain vascular cell types manifest inducible cyclooxygenase expression as a function of the strength and nature of immune insults. J Neurosci. 2002;22:5606–5618. doi: 10.1523/JNEUROSCI.22-13-05606.2002. [DOI] [PMC free article] [PubMed] [Google Scholar]
- Schiltz JC, Sawchenko PE. Signaling the brain in systemic inflammation: the role of perivascular cells. Front Biosci. 2003;8:s1321–s1329. doi: 10.2741/1211. [DOI] [PubMed] [Google Scholar]
- Schiltz JC, Sawchenko PE. Specificity and generality of the involvement of catecholaminergic afferents in hypothalamic responses to immune insults. J Comp Neurol. 2007;502:455–467. doi: 10.1002/cne.21329. [DOI] [PubMed] [Google Scholar]
- Schwab JM, Brechtel K, Nguyen TD, Schluesener HJ. Persistent accumulation of cyclooxygenase-1 (COX-1) expressing microglia/macrophages and upregulation by endothelium following spinal cord injury. J Neuroimmunol. 2000a;111:122–130. doi: 10.1016/s0165-5728(00)00372-6. [DOI] [PubMed] [Google Scholar]
- Schwab JM, Nguyen TD, Postler E, Meyermann R, Schluesener HJ. Selective accumulation of cyclooxygenase-1-expressing microglial cells/macrophages in lesions of human focal cerebral ischemia. Acta Neuropathol. 2000b;99:609–614. doi: 10.1007/s004010051170. [DOI] [PubMed] [Google Scholar]
- Schwab JM, Beschorner R, Meyermann R, Gözalan F, Schluesener HJ. Persistent accumulation of cyclooxygenase-1-expressing microglial cells and macrophages and transient upregulation by endothelium in human brain injury. J Neurosurg. 2002;96:892–899. doi: 10.3171/jns.2002.96.5.0892. [DOI] [PubMed] [Google Scholar]
- Shu S, Ju G, Fan L. The glucose-oxidase-DAB-nickel method in peroxidase histochemistry of the nervous system. Neurosci Lett. 1988;85:169–171. doi: 10.1016/0304-3940(88)90346-1. [DOI] [PubMed] [Google Scholar]
- Simmons DM, Arriza JL, Swanson LW. A complete protocol for in situ hybridization of messenger RNAs in brain and other tissues with radiolabeled single-stranded RNA probes. J Histotechnol. 1989;12:169–181. [Google Scholar]
- Spencer AG, Woods JW, Arakawa T, Singer II, Smith WL. Subcellular localization of prostaglandin endoperoxide H synthases-1 and -2 by immunoelectron microscopy. J Biol Chem. 1998;273:9886–9893. doi: 10.1074/jbc.273.16.9886. [DOI] [PubMed] [Google Scholar]
- Streit WJ, Graeber MB, Kreutzberg GW. Functional plasticity of microglia: a review. Glia. 1988;1:301–307. doi: 10.1002/glia.440010502. [DOI] [PubMed] [Google Scholar]
- Van Rooijen N, Sanders A. Liposome mediated depletion of macrophages: mechanism of action, preparation of liposomes and applications. J Immunol Methods. 1994;174:83–93. doi: 10.1016/0022-1759(94)90012-4. [DOI] [PubMed] [Google Scholar]
- Vellucci SV, Parrott RF. Expression of mRNAs for vasopressin, oxytocin and corticotrophin releasing hormone in the hypothalamus, and of cyclooxygenases-1 and -2 in the cerebral vasculature, of endotoxin-challenged pigs. Neuropeptides. 1998;32:439–446. doi: 10.1016/s0143-4179(98)90069-5. [DOI] [PubMed] [Google Scholar]
- Yamagata K, Matsumura K, Inoue W, Shiraki T, Suzuki K, Yasuda S, Sugiura H, Cao C, Watanabe Y, Kobayashi S. Coexpression of microsomal-type prostaglandin E synthase with cyclooxygenase-2 in brain endothelial cells of rats during endotoxin-induced fever. J Neurosci. 2001;21:2669–2677. doi: 10.1523/JNEUROSCI.21-08-02669.2001. [DOI] [PMC free article] [PubMed] [Google Scholar]
- Yermakova AV, Rollins J, Callahan LM, Rogers J, O'Banion MK. Cyclooxygenase-1 in human Alzheimer and control brain: quantitative analysis of expression by microglia and CA3 hippocampal neurons. J Neuropathol Exp Neurol. 1999;58:1135–1146. doi: 10.1097/00005072-199911000-00003. [DOI] [PubMed] [Google Scholar]
- Zhang YH, Lu J, Elmquist JK, Saper CB. Specific roles of cyclooxygenase-1 and cyclooxygenase-2 in lipopolysaccharide-induced fever and Fos expression in rat brain. J Comp Neurol. 2003;463:3–12. doi: 10.1002/cne.10743. [DOI] [PubMed] [Google Scholar]