Abstract
Recent years have seen an explosion in the development of novel ophthalmic imaging devices, delivering non-invasive views of the living retina. Adaptive optics (AO) imaging systems enable resolution of individual cells in the living retina. Analysis of these images has been limited to measures of cone density and regularity. Here we introduce a small case series where the information in the high-resolution image extends beyond these standard metrics. These images should serve as the basis for evolving discussion as to how best to interpret AO retinal images.
XX.1 Introduction
The use of AO imaging systems to image the living human retina is becoming increasingly widespread. A number of groups are utilizing AO technology to examine photoreceptors in the normal (Roorda and Williams 2002; Putnam et al. 2005; Jonnal et al. 2010) and diseased (Choi et al. 2006; Wolfing et al. 2006; Duncan et al. 2007; Carroll et al. 2008; Chen et al. 2010) retina. Owing to their high contrast, identifying cones in AO images has proved relatively easy – semi-automated techniques to identify cone photoreceptors are now widely used (Li and Roorda 2007; Rossi and Roorda 2010). Thus a major focus in the analysis and interpretation of AO images has been density, spacing, or regularity of the cone mosaic. However, we believe that there may exist other important features in these images that may not get captured by these metrics. It is important to establish what other features should be captured from these images and begin to discuss what they might mean, specifically with regard to photoreceptor health.
Here, we describe three cases with unusual AO retinal images. This descriptive case series demonstrates that while AO imaging has shed enormous light on the cellular basis of visual abnormalities in retinal degenerations, several questions remain. While the underlying disease etiology is uncertain in these examples, the presence or absence of the cones is secondary to potentially more meaningful features involving the photoreceptor mosaic. A similar logic applies to optical coherence tomography images - there is more data to be gained from these images than just retinal or sub-layer thickness (i.e., inner segment/outer segment (IS/OS) reflectivity). Continued development of new image analysis metrics should increase the clinical utility of both imaging modalities.
XX.2 Materials and Methods
Three patients who presented with different retinal conditions were evaluated. All patients underwent a comprehensive clinical examination, fundus photography, and slit lamp biomicroscopy. SD-OCT line scans were obtained with the Bioptigen SD-OCT (Bioptigen, Inc., Durham, NC USA) as previously described (Tanna et al. 2010). Images of the cone photoreceptor mosaic were obtained and processed using a flood-illuminated AO ophthalmoscope as previously described (Rha et al. 2009). Participants provided written informed consent, and research was approved by the local Institutional Review Board.
XX.3 Results
XX.3.1 Case 1
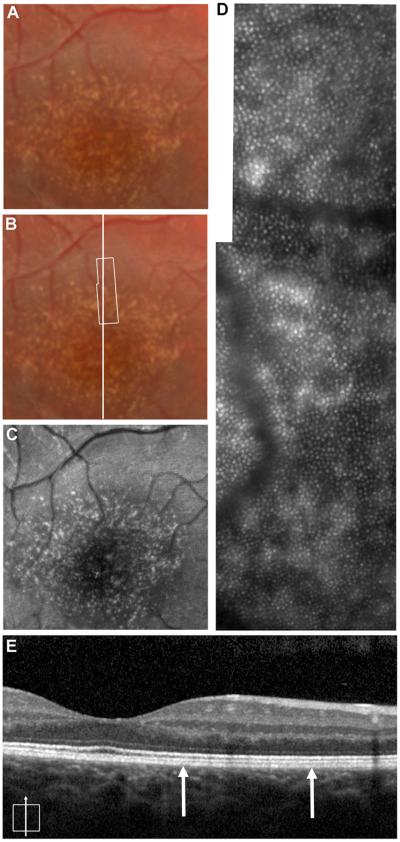
Patient 1 was a 15-year-old boy referred for evaluation of macular drusen. He was asymptomatic and reported no particular visual complaints at that time. Visual acuity was 20/20 OU. Clinical examination was significant for bilateral scattered, well-defined, fine, hard drusen in the central macula and extending radially into the temporal midperiphery (Fig. XX.1). Family history was noteworthy for the patient’s father was diagnosed with similar findings at age 30, macular degenerative changes in the paternal grandfather, and an aunt and uncle having severe macular degeneration findings. A diagnosis of dominant drusen also known as Doyne’s honeycomb dystrophy was made. The high-resolution SD-OCT images from the patient’s right eye revealed retinal pigment epithelium (RPE) excrescences with underlying moderately reflective material consistent with drusen, though not all druse could be seen on the SD-OCT images (Fig. XX.1). AO imaging revealed a regular photoreceptor mosaic with areas of hyper-reflectivity coinciding with the location of the drusen. Though the photoreceptor mosaic is regular and undisrupted, the areas of hyper-reflectivity are different from what is seen in normal retina. In normal retinas the RPE absorbs light that is not captured by cones resulting in the high contrast between reflective cones and the non-reflective RPE. In the data from patients with albinism published by our group (McAllister et al. 2010), we observed similar heterogeneous patterns of reflectivity due to melanin clumping (where the absence of melanin caused an increase in reflectivity and a reduction in the local cone contrast). Thus in the current patient, we believe that the increased reflectivity associated with the drusen can be attributed to increased scatter from the RPE (not likely due to decreased melanin, but rather accumulation of some other material). It may be that local cone contrast could be used in conjunction with OCT-based measures of drusen anatomy (Khanifar et al. 2008; Jain et al. 2010) to monitor drusen progression – even though the density and regularity of the overlying cone photoreceptors may remain unchanged. AO flood-illuminated systems may differ with AOSLO systems in capturing this altered reflectivity.
Fig. XX.1.
Multimodal imaging of a patient with dominant drusen. Color fundus photograph (A, B) and autofluorescence (C) images showing numerous scattered drusen in central fundus. The white box in (B) represents the area of the AO image (D). (E) High-resolution SD-OCT image taken at the location of the horizontal line (B). Thin vertical arrows represent the boundary of the retinal area imaged with AO.
XX.3.2 Case 2
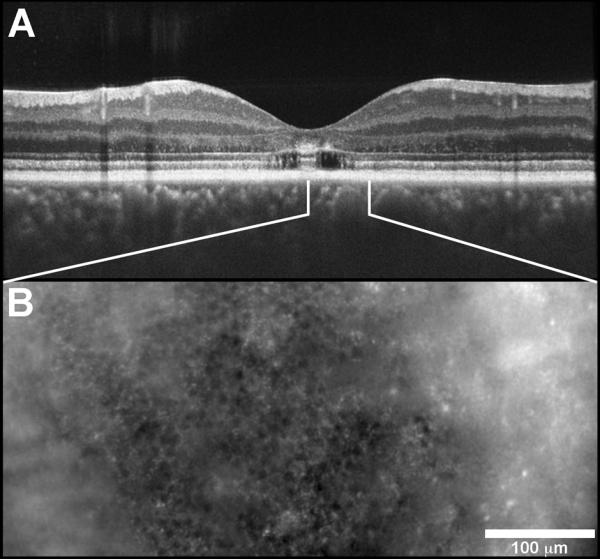
Patient 2 was a 17-year-old girl who presented for evaluation of decreased vision with a family history significant for retinal dystrophy. Visual acuity without correction was 20/40 +2 OD 20/30 -1 OS, and color vision was decreased. Fundus exam showed subtle bull’s eye pigmentation in the macular region, left eye greater than right. The high-resolution SD-OCT images from the patient’s right eye revealed preserved retinal layers in the central fovea with loss of the IS/OS layer and the external limiting membrane (ELM) in the perifoveal region in a ring like fashion corresponding to the bull’s eye lesion. Figure XX.2 shows images from the area where the IS/OS was absent, yet significant structure remains. The low frequency hypo-reflective structures are probably RPE cells, as the average spacing of these structures (13.1 μm) is similar to previous reports (Roorda et al. 2007). However, the smaller hyper-reflective structures may or may not represent cone structure; the SD-OCT image would suggest an absence of cones. As such, algorithms which simply detect bright spots (Xue et al. 2007) will lead to misinterpretation of the images. That said, it is difficult to reconcile what (if not cones) these structures could be. Correlating microperimetry with high-resolution images certainly appears to be the way forward in interpreting difficult images like these (Yoon et al. 2009).
Fig. XX.2.

Image from patient with a bulls’s eye maculopathy. (A) SD-OCT scan shows that retinal layers are preserved in a small island in the central macula with loss of the IS/OS layer and the ELM in the perifoveal region. The white lines indicate the area imaged with AO in (B).
XX.3.3 Case 3
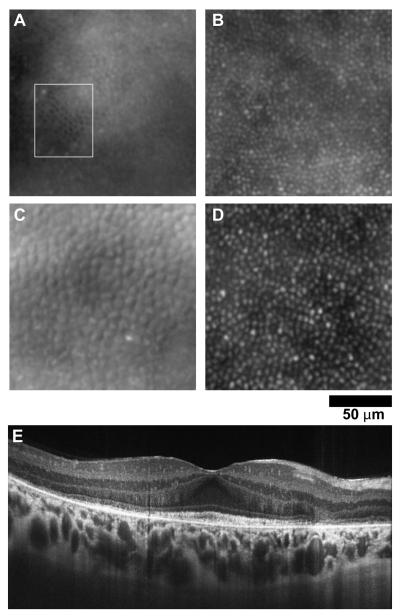
Patient 3 was a 35-year-old woman referred for abnormal pigmentary changes in her retina and complaints of difficulty with night vision. Past ocular history was significant for being told she had a “weird” appearance of her retina 11 years prior to this examination. Family history was significant for her father having macular dystrophy with degenerative changes at 45 years of age. Her visual acuity without correction was 20/25 - 1 OD and 20/25 OS. Fundus exam revealed a mottled appearance of the retina bilaterally. In the posterior pole of the right eye there are focal areas of atrophy seen both superior and inferior to the fovea. AO images of the retina had a varied appearance (Fig. XX.3). Near the foveal center, some cones appeared with inverted contrast, yet they remained regularly integrated with the surrounding normally-reflective cones. The cone spacing here is near normal values (3.99 μm vs. 4.49 μm). However at 2.0 deg from the fovea, cone spacing is increased in the patient (7.42 μm vs. 5.58 μm), indicating lower cone density. In addition, the cones take on a “bubble-wrap” type appearance, which has been described before (Duncan et al. 2007; Godara et al. 2010). The raised appearance results from a non-uniform reflectance across the cone aperture. Measures of cone density or cone spacing do not capture the abnormal appearance of these cells, which may be a transient indicator of cone health and should be investigated further.
Fig. XX.3.
Images from a patient with focal areas of retinal atrophy and visual loss (A, C) and a normal control (B, D). At 0.5 deg. eccentricity (A, B), a small patch of cones in the patient (A-white box) appear with inverted contrast compared to normal. At 2.0 deg. eccentricity (C, D), the cones in the patient (C) appear raised, owing to non-uniform reflectivity across the cone aperture. (E) SD-OCT image through the fovea, showing diffuse disruption of the IS/OS layer at the locations imaged with AO.
XX.4 Discussion
AO retinal imaging has rapidly advanced as a clinical imaging tool in the last decade. Now we have the ability not only to image photoreceptors consistently at the same location but also to follow up the changes longitudinally over time. The above clinical examples highlight the need to have a better understanding of the information present in these AO images (beyond cone density or regularity), as this information is likely to increase the clinical utility of AO imaging.
Acknowledgements
The authors thank B. Schroeder & P.M. Summerfelt for technical assistance. J. Carroll is the recipient of a Career Development Award from Research to Prevent Blindness. This study was supported by NIH grants P30EY001931 & R01EY017607, The Thomas M. Aaberg, Sr. Retina Research Fund, & an unrestricted grant from Research to Prevent Blindness. This investigation was conducted in a facility constructed with support from Research Facilities Improvement Program Grant Number C06 RR-RR016511 from the National Center for Research Resources, NIH.
References
- Carroll J, Choi SS, Williams DR. In vivo imaging of the photoreceptor mosaic of a rod monochromat. Vis Res. 2008;48:2564–2568. doi: 10.1016/j.visres.2008.04.006. [DOI] [PMC free article] [PubMed] [Google Scholar]
- Chen YF, Roorda A, Duncan JL. Advances in imaging of Stargardt disease. Adv Exp Med Biol. 2010;664:333–340. doi: 10.1007/978-1-4419-1399-9_38. [DOI] [PMC free article] [PubMed] [Google Scholar]
- Choi SS, Doble N, Hardy JL, et al. In vivo imaging of the photoreceptor mosaic in retinal dystrophies and correlations with visual function. Invest Ophthalmol Vis Sci. 2006;47:2080–2092. doi: 10.1167/iovs.05-0997. [DOI] [PMC free article] [PubMed] [Google Scholar]
- Duncan JL, Zhang Y, Gandhi J, et al. High-resolution imaging with adaptive optics in patients with inherited retinal degeneration. Invest Ophthalmol Vis Sci. 2007;48:3283–3291. doi: 10.1167/iovs.06-1422. [DOI] [PubMed] [Google Scholar]
- Godara P, Rha J, Tait DM, et al. Unusual adaptive optics findings in a patient with bilateral maculopathy. Arch Ophthalmol. 2010;128:253–254. doi: 10.1001/archophthalmol.2009.383. [DOI] [PMC free article] [PubMed] [Google Scholar]
- Jain N, Farsiu S, Khanifar AA, et al. Quantitative comparison of drusen segmented on SD-OCT versus drusen delineated on color fundus photographs. Invest Ophthalmol Vis Sci. 2010;51:4875–4883. doi: 10.1167/iovs.09-4962. [DOI] [PMC free article] [PubMed] [Google Scholar]
- Jonnal RS, Besecker JR, Derby JC, et al. Imaging outer segment renewal in living human cone photoreceptors. Opt Express. 2010;18:5257–5270. doi: 10.1364/OE.18.005257. [DOI] [PMC free article] [PubMed] [Google Scholar]
- Khanifar AA, Koreishi AF, Izatt JA, et al. Drusen ultrastructure imaging with spectral domain optical coherence tomography in age-related macular degeneration. Ophthalmology. 2008;115:1883–1890. doi: 10.1016/j.ophtha.2008.04.041. [DOI] [PMC free article] [PubMed] [Google Scholar]
- Li KY, Roorda A. Automated identification of cone photoreceptors in adaptive optics retinal images. J Opt Soc Am A. 2007;24:1358–1363. doi: 10.1364/josaa.24.001358. [DOI] [PubMed] [Google Scholar]
- McAllister JT, Dubis AM, Tait DM, et al. Arrested development: High-resolution imaging of foveal morphology in albinism. Vis Res. 2010;50:810–817. doi: 10.1016/j.visres.2010.02.003. [DOI] [PMC free article] [PubMed] [Google Scholar]
- Putnam NM, Hofer HJ, Doble N, et al. The locus of fixation and the foveal cone mosaic. J Vis. 2005;5:632–639. doi: 10.1167/5.7.3. [DOI] [PubMed] [Google Scholar]
- Rha J, Schroeder B, Godara P, et al. Variable optical activation of human cone photoreceptors visualized using short coherence light source. Opt Lett. 2009;34:3782–3784. doi: 10.1364/OL.34.003782. [DOI] [PMC free article] [PubMed] [Google Scholar]
- Roorda A, Williams DR. Optical fiber properties of individual human cones. J Vis. 2002;2:404–412. doi: 10.1167/2.5.4. [DOI] [PubMed] [Google Scholar]
- Roorda A, Zhang Y, Duncan JL. High-resolution in vivo imaging of the RPE mosaic in eyes with retinal disease. Invest Ophthalmol Vis Sci. 2007;48:2297–2303. doi: 10.1167/iovs.06-1450. [DOI] [PubMed] [Google Scholar]
- Rossi EA, Roorda A. The relationship between visual resolution and cone spacing in the human fovea. Nat Neurosci. 2010;13:156–157. doi: 10.1038/nn.2465. [DOI] [PMC free article] [PubMed] [Google Scholar]
- Tanna H, Dubis AM, Ayub N, et al. Retinal imaging using commercial broadband optical coherence tomography. Br J Ophthalmol. 2010;94:372–376. doi: 10.1136/bjo.2009.163501. [DOI] [PMC free article] [PubMed] [Google Scholar]
- Wolfing JI, Chung M, Carroll J, et al. High-resolution retinal imaging of cone-rod dystrophy. Ophthalmology. 2006;113:1014–1019. doi: 10.1016/j.ophtha.2006.01.056. [DOI] [PubMed] [Google Scholar]
- Xue B, Choi SS, Doble N, et al. Photoreceptor counting and montaging of en-face retinal images from an adaptive optics fundus camera. J Opt Soc Am A. 2007;24:1364–1372. doi: 10.1364/josaa.24.001364. [DOI] [PMC free article] [PubMed] [Google Scholar]
- Yoon MK, Roorda A, Zhang Y, et al. Adaptive optics scanning laser ophthalmoscopy images in a family with the mitochondrial DNA T8993C mutation. Invest Ophthalmol Vis Sci. 2009;50:1838–1847. doi: 10.1167/iovs.08-2029. [DOI] [PMC free article] [PubMed] [Google Scholar]


