Abstract
Previous implementations of structured-illumination microscopy (SIM) were slow or designed for one-color excitation, sacrificing two unique and extremely beneficial aspects of light microscopy: live-cell imaging in multiple colors. This is especially unfortunate because, among the resolution-extending techniques, SIM is an attractive choice for live-cell imaging; it requires no special fluorophores or high light intensities to achieve twice diffraction-limited resolution in three dimensions. Furthermore, its wide-field nature makes it light-efficient and decouples the acquisition speed from the size of the lateral field of view, meaning that high frame rates over large volumes are possible. Here, we report a previously undescribed SIM setup that is fast enough to record 3D two-color datasets of living whole cells. Using rapidly programmable liquid crystal devices and a flexible 2D grid pattern algorithm to switch between excitation wavelengths quickly, we show volume rates as high as 4 s in one color and 8.5 s in two colors over tens of time points. To demonstrate the capabilities of our microscope, we image a variety of biological structures, including mitochondria, clathrin-coated vesicles, and the actin cytoskeleton, in either HeLa cells or cultured neurons.
Keywords: extended resolution, frequency mixing, multicolor, patterned excitation
Fluorescence microscopy allows noninvasive 3D imaging of the interior of living specimens with molecular specificity, and is therefore an invaluable resource to the biological sciences. Unfortunately, the resolving power of fluorescence microscopy is fundamentally limited by the diffraction of light.
Lately, many techniques have been introduced to extend the resolution beyond the classic diffraction limit (1–8). Although the improvement of spatial resolution is impressive, the practical impact of these new techniques will largely depend on whether they can keep the two key advantages of fluorescence microscopy, namely, the capability of imaging living cells in three dimensions and multicolor labeling. Live-cell imaging over many time points has been demonstrated for some resolution-extending techniques (9–15) but, to our knowledge, not for multicolor 3D imaging of whole cells.
Stimulated emission depletion (STED) microscopy increases the spatial resolution by suppressing the fluorescence emission on the rim of a focused laser spot, theoretically enabling unlimited resolution (16). STED microscopy has been demonstrated for live imaging at high frame rates (12, 15), but its point-scanning nature makes it unsuitable for fast volumetric imaging over large fields of view. Furthermore, to achieve high spatial resolution, very high power densities (38–540 MW/cm2) (12) are necessary for the STED laser beam, which may cause increased photobleaching and phototoxicity, thus limiting the application of live-cell STED microscopy.
In localization-based microscopy, only sparse subsets of photoswitchable fluorophores in a sample are imaged at a time, which allows the isolation and precise localization of individual emitters (4, 6). By repeating this process many times, a map of all fluorophore positions can be built up with a spatial resolution much higher than the diffraction-limited resolution. Localization microscopy has been used for live-cell imaging, but only in a 2D mode (13, 14) or a thin-layered 3D mode (10), both at low frame rates because of the great number of raw images. Moreover, to achieve a high enough frame rate compatible for live imaging, higher intensity light is needed, resulting in a very limited number of time points (10). Another factor limiting the biological application of localization microscopy is that it requires photoactivatable or photoswitchable fluorescent dyes.
Therefore, there is still a need for a microscopy technique that can achieve high volume rates in 3D over many time points with spatial resolution beyond the diffraction limit.
Structured-illumination microscopy (SIM) can double the resolution in three dimensions in wide-field microscopy via spatial frequency mixing (1, 5, 17). Although SIM has lower spatial resolution than the previously mentioned techniques, it overcomes some of their drawbacks. Being a wide-field technique and not requiring sparse emitting, SIM allows parallelized image acquisition, and thus rapid recording of large fields of view. In addition, it works with any type of fluorophore and requires low excitation power on the order of only 1–10 W/cm2, making SIM particularly well suited for investigating living biological samples. However, early implementations of SIM used a fixed diffraction grating that was mechanically translated and rotated to generate the necessary interference patterns, making it too slow for live-cell imaging (1, 17). S-polarization in the excitation beams, required for achieving a high contrast ratio in the illumination pattern regardless of pattern orientations, was achieved by a linear polarizer corotating with the grating. More recently, faster setups have been published that use fast spatial light modulators (SLMs) for the pattern generation (9, 11, 18, 19) and liquid crystal waveplates for fast polarization rotation (11, 20). Live-cell imaging has been demonstrated in two dimensions using total internal reflection fluorescence (TIRF) (11) and, more recently, in three dimensions (9, 20), but both in only one color. The limitation to one excitation wavelength stems mainly from the fact that the generation of the illumination beams used for structured illumination is based on diffraction, which is wavelength-dependent. In addition, the liquid crystal waveplates are also wavelength-dependent. Consequently, the previous SLM-based setups (11, 20) were designed for a single excitation wavelength in terms of both diffraction angle and waveplate retardance.
In this paper, we report time-lapse 3D SIM imaging of living samples in two colors. The adaption of the setup to different wavelengths is achieved by designing pixel patterns for the SLM that allow flexible adjustment of the diffraction angle for different excitation wavelengths and by using a variable-retardance liquid crystal waveplate. As a result, multicolor SIM imaging can be performed at volume rates as high as 8.5 s per time point in two colors and is compatible with a wide range of biological structures and fluorophores.
Principles
Resolution Enhancement.
The resolution limit of an imaging system can be defined by the support, or the nonzero valued region, of its optical transfer function (OTF) in frequency space; the diffraction-limited OTF support of a 3D wide-field fluorescence microscope is shown in Fig. S1A. In 3D SIM, a nonuniform illumination pattern is formed by the interference of three linearly polarized laser beams. Their polarization is perpendicular to the plane of incidence, or s-polarized, to generate maximum contrast in the illumination pattern (17). For optimal resolution enhancement, the Fourier components of the interference intensity pattern need to be located close to the boundary of the OTF support (Fig. S1A). Through frequency mixing of the illumination pattern and the underlying sample information, normally unobservable regions of frequency space (i.e., the regions outside the OTF support) are made observable (Fig. S1B), thus extending resolution beyond the classic diffraction limit.
To acquire a 3D dataset, the sample is translated along the optical (axial) axis while the interference pattern stays fixed relative to the focal plane. Consequently, the raw data contain five information components (15); to separate these five components, five images at different lateral phases of the illumination pattern are acquired at each focal plane and a computational algorithm is used to solve the linear equation system for its five unknowns. Laterally isotropic resolution is achieved by repeating this procedure for two other lateral orientations of the illumination pattern (1, 17). To maintain high interference contrast, the polarization of the laser beams is corotated with the illumination pattern. The separated Fourier components of all pattern orientations are then computationally reassembled using a generalized Wiener filter, and an inverse Fourier transform yields a final 3D image with doubled axial and lateral resolution (17).
Fast Multicolor SIM.
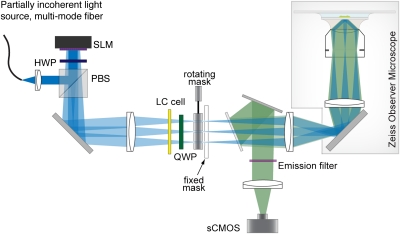
In our setup, the interference pattern for SIM is generated by displaying a periodic pattern on a ferroelectric liquid crystal SLM, which is in a plane conjugate to the camera (Fig. 1): Light incident on the SLM is diffracted by the phase pattern, and only the zero and first diffraction orders are selected by an adjustable mask to generate the 3D SIM illumination pattern. The SLM pixel patterns can be switched in 0.5 ms and are optimized for each excitation wavelength to ensure the highest diffraction angle allowed by the objective's numerical aperture, and thus maximal resolution enhancement, at each excitation wavelength. The wavelength-optimized pixel patterns rely on the ability to generate a periodic 2D binary grid pattern of arbitrary pitch, duty cycle, and orientation. A pattern-generating algorithm was devised specifically for this purpose (SI Text 1, Table S1 and Fig. S2). Using 488-nm and 561-nm laser light for excitation, we achieved lateral and axial resolutions of 110/130 nm and 360/400 nm (green channel/red channel), respectively. To rotate the polarization angle quickly to maintain s-polarization for different pattern orientations, we used a unique type of liquid crystal waveplate that provides continuously tunable retardance (Materials and Methods), and thus enables us to rotate the polarization rapidly for each wavelength.
Fig. 1.
Simplified diagram of the microscope setup for live multicolor SIM. Spatially incoherent laser light is diffracted by a periodic phase pattern displayed on an SLM. A liquid crystal cell with variable retardance is used to rotate the linear polarization of the laser beams. Zero and first diffraction orders are selected by a rotating, adjustable mask. These three beams are focused onto the rear pupil plane of the objective, and consequently interfere in the sample plane, forming an image of the pattern displayed on the SLM. Fluorescence emission is collected in a wide-field configuration and is recorded by a sCMOS camera. HWP, half waveplate; LC, liquid crystal; PBS, polarizing beam splitter; QWP, quarter waveplate.
Multicolor datasets were acquired sequentially in time (i.e., for each wavelength, a complete 3D SIM dataset was acquired before switching to another wavelength). The use of a scientific complementary metal-oxide semiconductor (sCMOS) camera and the SLM allows rapid data acquisition, with the speed mainly limited by the exposure time. Using an exposure time of 5 ms, the acquisition volume rate is 1.4 s (1-μm thickness × 51 μm × 51 μm) per color channel.
Results
HeLa Cells.
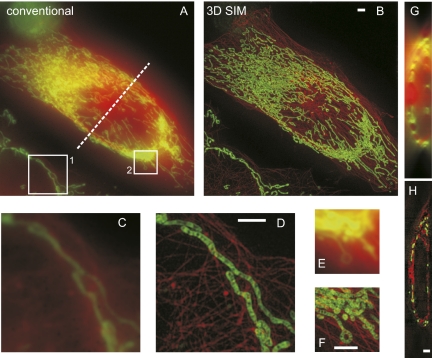
As a first demonstration, we imaged a dual-labeled HeLa cell: Microtubules were labeled with mCherry, and mitochondria were labeled with MitoTracker Green. 3D SIM provides striking improvement in resolution and rejection of out-of-focus light (Fig. 2). Fine structures within the mitochondria resemble cristae, normally only visible in EM images. Notably, the out-of-focus blur is drastically reduced because SIM fills in the missing cone in the conventional OTF (Fig. S1B), and thus provides optical sectioning (Fig. 2 G and H).
Fig. 2.
Mitochondria, labeled with MitoTracker Green, and the microtubular network, labeled with mCherrry, in a live HeLa cell as imaged by conventional wide-field microscopy and 3D SIM. (A and B) Maximum intensity projection along z through the entire volume. Mitochondria are rendered in green, and microtubules are rendered in red. (C–F) Magnified view of the boxed regions 1 and 2 in A. (G and H) One y-z cross-section along the dashed line marked in A. The volume thickness is 8.125 μm. (Scale bars: 2 μm.)
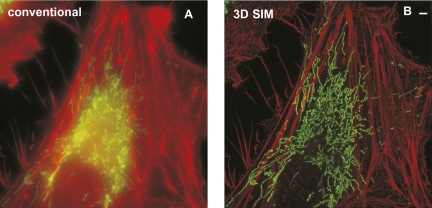
To demonstrate time-lapse multicolor imaging, we imaged the dynamics of the actin cytoskeleton and mitochondria in HeLa cells expressing tdTomato-LifeAct and stained with MitoTracker green (Fig. 3). Using very low light intensities of ∼4 W/cm2 for each color, we set the exposure time to 20 ms, resulting in 22 s to acquire the raw images for two 3D SIM volumes. We recorded 30 time points at this temporal spacing (Movie S1), and were able to capture the movement of actin and mitochondria over the entire cell without noticeable motion artifacts. The doubled resolution and removal of out-of-focus blur allowed fine actin structures like filipodia, as well as mitochondrial morphological changes and fusion/fission events, to be visualized in great spatiotemporal detail.
Fig. 3.
Live 3D SIM imaging of mitochondria labeled with MitoTracker Green and the actin cytoskeleton labeled with tdTomato-LifeAct in a HeLa cell over 30 time points. Maximum intensity projection along the z axis through the entire volume for the first time point, imaged with conventional microscopy (A) and 3D SIM (B). Each time point (consisting of both color channels) was acquired within 22 s (20-ms raw exposure time). Mitochondria are rendered in green, and the actin cytoskeleton is rendered in red. The volume thickness is 3 μm. (Scale bar: 2 μm.) A video of this reconstruction can be found in Movie S1.
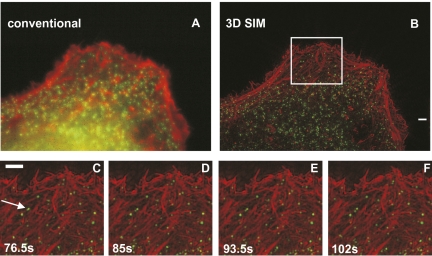
To image faster processes with 3D SIM, we cotransfected HeLa cells with plasmids encoding mEmerald-clathrin and tdTomato-LifeAct. We used a raw-frame exposure time of 20 ms and reduced the observation volume to 1.25 μm in thickness, which was about the thickness on the periphery of a HeLa cell (Fig. 4). With the resulting overall acquisition rate of 8.5 s (4 s for each color channel), we were able to resolve the movement of actin filaments and clathrin-coated vesicles for 20 time points. The power used was 14 W/cm2 and 3.9 W/cm2 for the 488-nm and 561-nm lasers, respectively. Under 3D SIM, clathrin-coated vesicles are highly mobile spots or rings that appear, disappear, and fall apart, potentially representing clathrin-mediated endocytosis (Movies S3 and S4). The spatiotemporal resolution also allowed us to follow fusion and splitting of clathrin-coated vesicles (Fig. 4 C–F).
Fig. 4.
Live 3D SIM imaging of clathrin-coated vesicles labeled with mEmerald and the actin cytoskeleton labeled with tdTomato-LifeAct at the periphery of a HeLa cell over 20 time points. (A and B) Maximum intensity projection along the z axis through the entire volume for the first time point. Clathrin is rendered in green, and actin is rendered in red. Each time point (consisting of both color channels) was acquired within 8.5 s (20-ms raw exposure). (C–F) Magnified images of the boxed region in B at the indicated times. The arrow points at a clathrin-coated vesicle that splits into two. The volume thickness is 1.25 μm. (Scale bars: 2 μm.) A video of this reconstruction can be found in Movies S2 and S3.
Neurons.
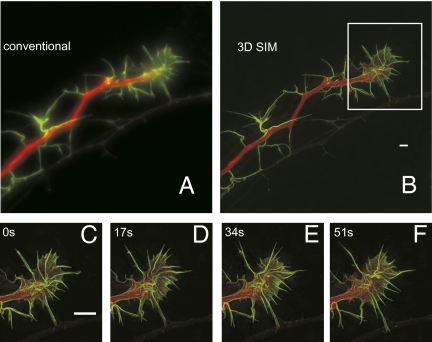
As a more challenging cell type, we imaged a mixed cell culture (hippocampal neurons and glia) expressing cytosolic GFP and tdTomato-LifeAct. Typically a 3-μm-thick image stack was needed to encompass an individual neuron growth cone. Using an integration time of 10 ms, it took us 17 s to acquire the 3D SIM raw data for the two colors. The laser power was set to 15.3 W/cm2 and 7 W/cm2 for the 488-nm and 561-nm lasers, respectively.
SIM reveals complex actin structure in the neuron growth cone (Fig. 5). Over 20 time points, it was possible to observe the dynamics of cortical actin in filopodia and lamellipodia, including in filopodia that were rapidly moving (Movie S5). Other filopodia appeared to be wound up into lamellipodia (Fig. 5 C–F and Movie S5).
Fig. 5.
Live 3D SIM imaging of cultured neurons labeled with cytosolic GFP and actin-labeled with tdTomato-LifeAct over 20 time points. (A and B) Maximum intensity projection along the z axis through the entire volume for the first time point. Each time point (consisting of both color channels) was acquired within 17 s (10-ms raw exposure time). The GFP channel is rendered in green, and actin is rendered in red (inverted compared with the other images). (C–F) Magnified images of the boxed regions in B. The volume thickness is 3 μm. (Scale bars: 2 μm.) A video of this reconstruction can be found in Movie S5.
Discussion
We demonstrated live-cell imaging at lateral and axial resolutions of 120 nm and 360 nm, respectively, using 3D structured illumination in two colors. The presented microscope is capable of capturing the dynamics of the actin cytoskeleton, mitochondria, and clathrin in HeLa cells, as well as the rapid movements of filopodia in neuron growth cones, without noticeable motion artifacts.
To our knowledge, the only comparable microscopy technique in terms of spatiotemporal resolution is Bessel beam microscopy (21, 22). Although it was recently demonstrated that this technique can be implemented at faster volume rates than presented in this paper, SIM offers greater than twofold higher lateral resolution, with the axial resolution being comparable. Greater axial, and thus isotropic, resolution of ∼100 nm can be obtained with 3D SIM using two-objective detection (23). Inherent to both techniques is the wide-field detection that allows parallel acquisition and efficient fluorescence detection.
One main limiting factor for the overall imaging speed is the exposure time. The current sCMOS technology would allow shorter exposure times than we used in this study; thus, imaging rates greater than 1 Hz/μm thickness are possible. Currently, the main technical limitation is the download speed of the raw data. However, we never were limited by this factor because we found it beneficial to use longer exposure times (in the range of 10–20 ms) and correspondingly lower excitation power.
The current acquisition scheme is sequential in time, which is not ideal for experiments in which two color labels need to be colocalized, because the color channels are not acquired at the exact same time. One improvement of our setup would be to acquire the two color channels in an interlaced sequence while acquiring one stack (i.e., sequentially acquiring both color channels at each focal plane). In our experiments, we opted not to do this because we had to use, a corresponding emission filter for each color to avoid the significant cross-excitation of red fluorophores by the 488-nm laser. Filter switching can take at least 40 ms, substantially lowering the imaging speed. Switching the filters could be avoided in two ways: by using a notch emission filter (which blocks scattered excitation light) and then spectral unmixing of the raw data or by using an individual camera with a proper emission filter for each channel. Alternatively, because the sCMOS camera has a large number of pixels, an image splitter device could be used to separate the color channels.
In summary, 3D SIM allows live-cell imaging in multiple colors with 120-nm spatial resolution and 8.5-s temporal resolution for two colors. Because SIM is a wide-field technique, its field of view and acquisition speed can be directly scaled up with the improvements in camera technology. Importantly, SIM does not require special fluorophores, labeling conditions, or extremely high light intensities; consequently, we envision SIM playing an important role in the life sciences.
Materials and Methods
Microscope.
A schematic drawing of the microscope is shown in Fig. 1. Laser light with wavelengths of 488 nm (SAPPHIRE 488-500; Coherent, Inc.) and 561 nm (VFL-P-1000-560; MPB communications) passes through a mechanical shutter and an acousto-optical modulator (AOM; ADM-402AF1; IntraAction Corp.) and is coupled into a multimode fiber, part of which is coated but without a protective jacket. The unprotected segment of the fiber is wound into multiple loops in a lemniscate shape. This fiber bundle is mechanically shaken at a high frequency to scramble the laser light, and thus reduce its spatial coherence and smooth the speckle pattern. The output light of the fiber is collimated and is reflected via a polarizing beam splitter onto a ferroelectric SLM (SXGA-3DM; Fourth Dimension Displays). The SLM is operated as a phase-only modulator as described by Kner et al. (11).
For each wavelength, an optimized pixel pattern (SI Text 1) is displayed on the SLM, which diffracts the incoming laser light into multiple diffraction orders. Loading and displaying a new pixel pattern takes 0.5 ms, and the response time of the liquid crystals is even shorter. The two AOMs are synchronized with the SLM, such that laser light is only incident on the SLM when a pixel pattern is displayed on the SLM.
A liquid crystal cell (SWIFT; Meadowlark) and a quarter waveplate are used as a continuously tunable linear polarization rotator that can be switched in less than 1 ms.
A cylindrical mask, mounted on a galvanometric scanner (6230HB; Cambridge Technology), is used to block all unwanted diffraction orders that fall into the pupil plane (Fig. S3). The rotating mask is optimized for minimal moment of inertia and is rotated within 1.5 ms to its next position. After the order selection, the beams are recollimated with a lens that images the SLM onto the primary image plane outside a side port of a Zeiss AxioObserver microscope. The beams are refocused onto the pupil plane of the objective by the tube lens of the microscope, and consequently form an interference pattern in the object plane. For the experiments in this study, a Zeiss C-Apochromat (magnification of 63×, N.A. = 1.2) water immersion objective was used, and the axial step size was set to 125 nm.
Fluorescence light collected by the objective is deflected by a custom-made dichromatic mirror (ZT488/560/640tpc_22.5deg; Chroma) and is imaged onto a sCMOS camera (Neo sCMOS; Andor Technology). The dichromatic mirror was optimized to add minimal depolarization for the used laser lines.
For each excitation wavelength, an optimized emission filter is used to block back-reflected excitation light and fluorescence generated by cross-excitation. Changing the emission filter takes less than 0.5 s using motorized flippers.
HeLa Cell Preparation.
HeLa cells transfected with tandem dimer tdTomato-LifeAct plasmids were allowed to express for at least 24 h. To avoid the formation of large bundles of stress fibers, the cells were replated on coverslips for ∼5 h before imaging. The cells were then additionally labeled with MitoTracker Green and directly imaged in Hepes buffer at room temperature.
Neuron Preparation.
A mixed cell culture (hippocampal neurons and glia) was prepared from Sprague–Dawley rat pups. Transfection via electroporation was performed using the Amaxa Nucleofector kit (VPG-1003; Lonza), with a LifeAct plasmid (to label actin with tdTomato) and a GFP plasmid (cytosolic, provided by the Amaxa Nucleofector kit). Cells were plated in microwells (MatTek) coated with matrigel matrix (SI Text 2) and kept at 37 °C under 5% CO2 in plating medium (SI Text 2) for ∼24 h and then in growth medium (GM; SI Text 2) for their duration. Every third day, half of the media was changed with GM plus 4 μM AraC. Before imaging at room temperature, the medium was replaced with Hepes buffer.
sCMOS Flat-Field Correction.
The pixels of the sCMOS camera have quite strong pixel-to-pixel gain variations; therefore, flat-field correction (i.e., subtracting a background image and multiplying each pixel by its inverse gain) of the SIM raw data is needed to avoid reconstruction artifacts. However, even with a careful flat-field correction, there were still prominent artifacts in the reconstructed images, mainly coming from the strong gain variation of the pixels. We empirically found that in reciprocal space, the strongest contribution for these artifacts lies in the zero-order band (which corresponds to the conventional OTF; Fig. S1A) in the plane at kz = 0 (with kz being the frequency coordinate along the optical axis). An effective method to reduce the artifacts was setting the kz = 0 plane to zero in the zero-order band and replacing the missing Fourier components with the contribution of the higher order bands, which completely overlap the zero-order band.
High resolution images and videos in this article are available at www.janelia.org/lab/gustafsson-lab in the gallery section.
Supplementary Material
Acknowledgments
We thank M. Coleman, J. Nazemi, and P. Falkenstein for acquisition software; H. White, A. Arnold, and B. Shields for cell culture assistance; and E. Betzig, C. Galbraith, and J. Galbraith for useful discussions and suggestions.
Footnotes
The authors declare no conflict of interest.
This article is a PNAS Direct Submission. W.F.M. is a guest editor invited by the Editorial Board.
3Deceased April 17, 2011.
This article contains supporting information online at www.pnas.org/lookup/suppl/doi:10.1073/pnas.1119262109/-/DCSupplemental.
References
- 1.Gustafsson MGL. Surpassing the lateral resolution limit by a factor of two using structured illumination microscopy. J Microsc. 2000;198(2):82–87. doi: 10.1046/j.1365-2818.2000.00710.x. [DOI] [PubMed] [Google Scholar]
- 2.Hell SW, Wichmann J. Breaking the diffraction resolution limit by stimulated emission: Stimulated-emission-depletion fluorescence microscopy. Opt Lett. 1994;19:780–782. doi: 10.1364/ol.19.000780. [DOI] [PubMed] [Google Scholar]
- 3.Klar TA, Jakobs S, Dyba M, Egner A, Hell SW. Fluorescence microscopy with diffraction resolution barrier broken by stimulated emission. Proc Natl Acad Sci USA. 2000;97:8206–8210. doi: 10.1073/pnas.97.15.8206. [DOI] [PMC free article] [PubMed] [Google Scholar]
- 4.Betzig E, et al. Imaging intracellular fluorescent proteins at nanometer resolution. Science. 2006;313:1642–1645. doi: 10.1126/science.1127344. [DOI] [PubMed] [Google Scholar]
- 5.Frohn JT, Knapp HF, Stemmer A. True optical resolution beyond the Rayleigh limit achieved by standing wave illumination. Proc Natl Acad Sci USA. 2000;97:7232–7236. doi: 10.1073/pnas.130181797. [DOI] [PMC free article] [PubMed] [Google Scholar]
- 6.Rust MJ, Bates M, Zhuang X. Sub-diffraction-limit imaging by stochastic optical reconstruction microscopy (STORM) Nat Methods. 2006;3:793–795. doi: 10.1038/nmeth929. [DOI] [PMC free article] [PubMed] [Google Scholar]
- 7.Gustafsson MGL. Nonlinear structured-illumination microscopy: Wide-field fluorescence imaging with theoretically unlimited resolution. Proc Natl Acad Sci USA. 2005;102:13081–13086. doi: 10.1073/pnas.0406877102. [DOI] [PMC free article] [PubMed] [Google Scholar]
- 8.Heintzmann R, Jovin TM, Cremer C. Saturated patterned excitation microscopy—A concept for optical resolution improvement. J Opt Soc Am A Opt Image Sci Vis. 2002;19:1599–1609. doi: 10.1364/josaa.19.001599. [DOI] [PubMed] [Google Scholar]
- 9.Hirvonen LM, Wicker K, Mandula O, Heintzmann R. Structured illumination microscopy of a living cell. Eur Biophys J. 2009;38:807–812. doi: 10.1007/s00249-009-0501-6. [DOI] [PubMed] [Google Scholar]
- 10.Jones SA, Shim S-H, He J, Zhuang X. Fast, three-dimensional super-resolution imaging of live cells. Nat Methods. 2011;8:499–508. doi: 10.1038/nmeth.1605. [DOI] [PMC free article] [PubMed] [Google Scholar]
- 11.Kner P, Chhun BB, Griffis ER, Winoto L, Gustafsson MGL. Super-resolution video microscopy of live cells by structured illumination. Nat Methods. 2009;6:339–342. doi: 10.1038/nmeth.1324. [DOI] [PMC free article] [PubMed] [Google Scholar]
- 12.Lauterbach MA, et al. Comparing video-rate STED nanoscopy and confocal microscopy of living neurons. J Biophotonics. 2010;3:417–424. doi: 10.1002/jbio.201000038. [DOI] [PubMed] [Google Scholar]
- 13.Manley S, et al. High-density mapping of single-molecule trajectories with photoactivated localization microscopy. Nat Methods. 2008;5:155–157. doi: 10.1038/nmeth.1176. [DOI] [PubMed] [Google Scholar]
- 14.Shroff H, Galbraith CG, Galbraith JA, Betzig E. Live-cell photoactivated localization microscopy of nanoscale adhesion dynamics. Nat Methods. 2008;5:417–423. doi: 10.1038/nmeth.1202. [DOI] [PMC free article] [PubMed] [Google Scholar]
- 15.Westphal V, et al. Video-rate far-field optical nanoscopy dissects synaptic vesicle movement. Science. 2008;320:246–249. doi: 10.1126/science.1154228. [DOI] [PubMed] [Google Scholar]
- 16.Rittweger E, Han KY, Irvine SE, Eggeling C, Hell SW. STED microscopy reveals crystal colour centres with nanometric resolution. Nat Photonics. 2009;3:144–147. [Google Scholar]
- 17.Gustafsson MGL, et al. Three-dimensional resolution doubling in wide-field fluorescence microscopy by structured illumination. Biophys J. 2008;94:4957–4970. doi: 10.1529/biophysj.107.120345. [DOI] [PMC free article] [PubMed] [Google Scholar]
- 18.Fiolka R, Beck M, Stemmer A. Structured illumination in total internal reflection fluorescence microscopy using a spatial light modulator. Opt Lett. 2008;33:1629–1631. doi: 10.1364/ol.33.001629. [DOI] [PubMed] [Google Scholar]
- 19.Chang B-J, Chou L-J, Chang Y-C, Chiang S-Y. Isotropic image in structured illumination microscopy patterned with a spatial light modulator. Opt Express. 2009;17:14710–14721. doi: 10.1364/oe.17.014710. [DOI] [PubMed] [Google Scholar]
- 20.Shao L, Kner P, Rego EH, Gustafsson MGL. Super-resolution 3D microscopy of live whole cells using structured illumination. Nat Methods. 2011;8:1044–1046. doi: 10.1038/nmeth.1734. [DOI] [PubMed] [Google Scholar]
- 21.Planchon TA, et al. Rapid three-dimensional isotropic imaging of living cells using Bessel beam plane illumination. Nat Methods. 2011;8:417–423. doi: 10.1038/nmeth.1586. [DOI] [PMC free article] [PubMed] [Google Scholar]
- 22.Fahrbach FO, Rohrbach A. A line scanned light-sheet microscope with phase shaped self-reconstructing beams. Opt Express. 2010;18:24229–24244. doi: 10.1364/OE.18.024229. [DOI] [PubMed] [Google Scholar]
- 23.Shao L, et al. I5S: Wide-field light microscopy with 100-nm-scale resolution in three dimensions. Biophys J. 2008;94:4971–4983. doi: 10.1529/biophysj.107.120352. [DOI] [PMC free article] [PubMed] [Google Scholar]
Associated Data
This section collects any data citations, data availability statements, or supplementary materials included in this article.


