Abstract
In the mammalian brain, similar features of the sensory stimuli are often represented in proximity in the sensory areas. However, how chemical features are represented in the olfactory bulb has been controversial. Questions have been raised as to whether specific chemical features of the odor molecules are represented by spatially clustered olfactory glomeruli. Using a sensitive probe, we have analyzed the glomerular response to large numbers of odorants at single glomerulus resolution. Contrary to the general view, we find that the representation of chemical features is spatially distributed in the olfactory bulb with no discernible chemotopy. Moreover, odor-evoked pattern of activity does not correlate directly with odor structure in general. Despite the lack of spatial clustering or preference with respect to chemical features, some structurally related odors can be similarly represented by ensembles of spatially distributed glomeruli, providing an explanation of their perceptual similarity. Whereas there is no chemotopic organization, and the glomeruli are tuned to odors from multiple classes, we find that the glomeruli are hierarchically arranged into clusters according to their odor-tuning similarity. This tunotopic arrangement provides a framework to understand the spatial organization of the glomeruli that conforms to the organizational principle found in other sensory systems.
Keywords: GCaMP2, calcium imaging, topographic map
For most external senses, sensory areas in the brain are spatially organized according to certain features of the stimuli. Visual and somatosensory information maps topographically in the thalamus and cortex (1, 2), and frequency tuning maps of sound are found in various stages from the cochlear to the auditory cortex (3). In chemical senses, the submodalities of taste are represented in different parts of the gustatory cortex (4). The topographic representation of sensory features allows the processing of information through parallel channels while preserving the next-neighbor relationship to enable computations such as contrast enhancement and fill-in (5).
How odor stimulus is mapped topographically in the olfactory system has been controversial. In the olfactory bulb, axons of olfactory sensory neurons (OSNs) expressing the same odorant receptor (OR) gene converge onto two stereotypically positioned glomeruli (6). The topographic map of the olfactory glomeruli shows remarkable stereotypy among animals of the same species and sometimes across species (6, 7). Numerous studies have examined how chemical features are represented in the olfactory bulb (8–18). The prevailing hypothesis posits that different chemical features are represented by compartmentalized regions in the olfactory bulb to form a “chemotopic” map (19, 20). The chemotopic hypothesis suggests that the olfactory glomeruli can be grouped according to the chemical features of the odorants that activate them and are spatially located in clustered regions (8–16, 21, 22).
This hypothesis, however, has been challenged. Quantitatively, its framework does not specify how many features are represented in a segregated manner, nor does it specify the size and permissible overlap among the clusters. Qualitatively, chemotopy requires nearby glomeruli be tuned to odors that share common molecular features, but recent experiments have provided little support of this notion (7, 23, 24). These studies have suggested that chemotopy at the fine scale does not exist and that the olfactory system violates the organization principle found in other sensory systems (7, 25, 26). Moreover, the topographic organization in the bulb is dispersed when the projection reaches the piriform cortex (PirC). Whereas the mitral cell in the bulb receives input from a single glomerulus, its projection into the PirC extends into a wide area, and a confined cortical region receives input from mitral cells across the entire bulb (27–29). Accordingly, odors evoke a sparsely distributed ensemble of neurons in the PirC (30, 31). This distributed odor representation removes an a priori reason for a spatial organization of the glomeruli. Serious question as to whether any organizational principle exists for the glomeruli has been raised.
In this study, we reevaluate the spatial representation of chemical features with systematic investigations of odor responses in the dorsal olfactory bulb in mice expressing the Ca2+ sensor G-CaMP2 (32). These mice provide unprecedented sensitivity and single glomerular resolution that allow us to examine large numbers of odor stimuli and compare odor response patterns within individual animals. This approach overcomes several previous shortfalls by eliminating the requirement of collecting and assembling data from multiple animals, as in studies using [3H]2-deoxyglucose (2-DG) uptake or immediate early gene expression (8–11). It also allows us to use relatively low odor concentrations and to examine sparsely activated regions, which are likely neglected in previous studies. Our results find little support of chemotopy. Instead, we provide an alternative framework to explain the spatial organization of the glomeruli.
Results
Odor Response in G-CaMP2 Animals.
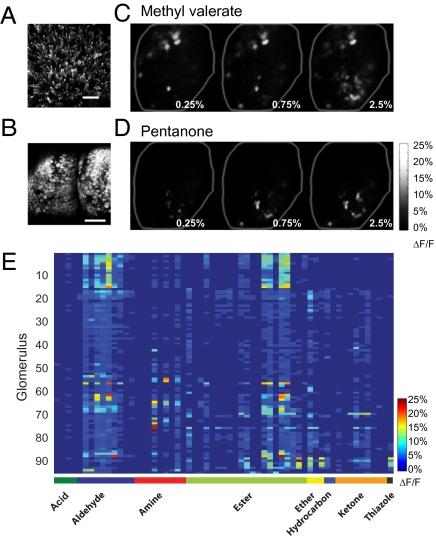
We imaged compound heterozygotic OMP-tTA/tetO-G-CaMP2 mice (32), which expressed G-CaMP2 in the OSNs without affecting their projection patterns (Fig. S1). G-CaMP2 signals (ΔF/F up to 25–40%; Fig. 1) were much larger than intrinsic signals (ΔF/F ≈1%) and signals from synaptopHluorin or Oregon Green (1–5%) (23, 24, 33). Using an automated olfactometer, we examined glomerular responses to ≈200 odors, among which ≈60 were selected for further study because they activated the dorsal glomeruli (Dataset S1). Different odors evoked distinct patterns of activity in 60–100 out of ≈200 glomeruli in the imaged area (Fig. 1 C–E). Responses were recorded across >1,000-fold change in odor concentrations (Fig. 1, Fig. S2, and Dataset S2), and the patterns to the same odor stimulation within individual animals were highly reproducible (Fig. S3).
Fig. 1.
Glomerular response to odor stimulation in G-CaMP2 animal. (A and B) Confocal image stack projections showing G-CaMP2 expression in the main olfactory epithelium (A) and the main olfactory bulb (B) in an OMP-IRES-tTA/ tetO-G-CaMP2 animal. (Scale bars, 30 μm in A, 300 μm in B.) (C and D) Glomerular responses patterns to methyl valerate (C) and 2-pentanone (D) at 0.25%, 0.75%, and 2.5% saturated vapor (S.V.), respectively. Bright spots are activated glomeruli. (E) Heatmap of the glomerular response patterns to a panel of 59 odors (0.25% S.V.) from eight different chemical classes. Each pixel represents the peak response of a single glomerulus to a single odor stimulus. Rows represent the response of single glomeruli, and columns represent the pattern of activation by individual odors. Odor classes are indicated in the heatmap. Names and structures of the odors are indicated in Dataset S1.
Representation of Chemical Features.
We examined the representation of molecular features using odorants from eight chemical classes. Because the position of glomerulus expressing the same OR varied from animal to animal (34), all comparisons were conducted within individual mice. Although odors belonging to the same chemical class could activate a similar set of glomeruli, these glomeruli were also activated by odors from a distinct class (rows in Fig. 1E). Conversely, the response patterns to odors within the same chemical classes were different (columns in Fig. 1E), and odorants sharing a common functional group were often found not activating the dorsal glomeruli at all (Dataset S1).
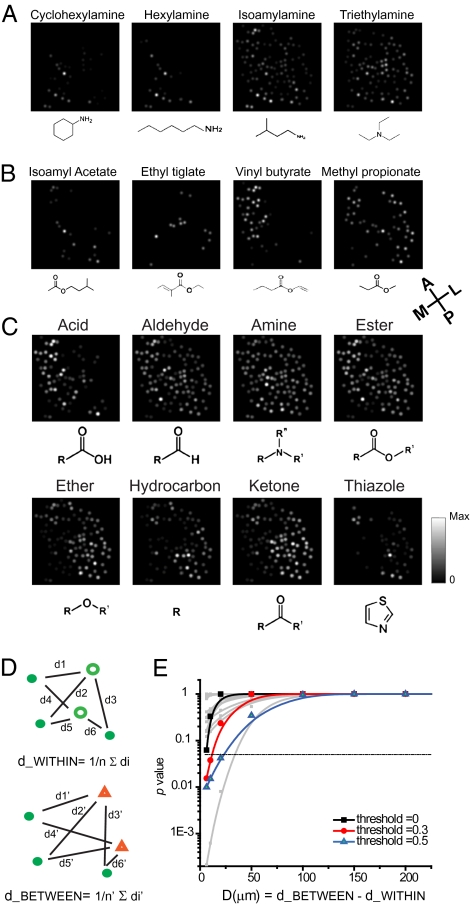
To visualize the spatial representation of chemical features in the bulb, we mapped the patterns of response to individual chemical classes. Within a single class, different odors activated glomeruli with no obvious spatial restriction. For example, cyclohexylamine and hexylamine preferentially activated the medial glomeruli, whereas isoamylamine and triethylamine activated a broad set of glomeruli (Fig. 2A). Using the strongest response of a glomerulus to any odorants of the amine group to represent its response to an amine, we found that amine was represented by glomeruli across the entire bulb (Fig. 2C, Amine). Similarly, in the ester group, isoamyl acetate, ethyl tiglate, and vinyl butyrate activated glomeruli distributed in distinct areas. Methyl propionate, on the other hand, activated broad regions (Fig. 2B). The overall representation of the ester group, therefore, was also broad (Fig. 2C, Ester). Analysis of the eight chemical groups revealed no compartmentalized representation of individual functional groups (Fig. 2C). Each groups activated glomeruli across the entire imaged area. At the single glomerulus level, no group of glomeruli was exclusively tuned to a single chemical class. As shown in Fig. 1E, almost all glomeruli were activated by odorants from six or more chemical groups (also see Fig. 2C). Thus, within the area we imaged, chemical features were represented by spatially distributed patterns.
Fig. 2.
Representation of odor classes in the bulb. (A–C) Each dot represents the location of a glomerulus, with the brightness indicating the response amplitude. (A) Patterns evoked by four amine odors (0.25% S.V.). (B) Patterns evoked by four ester odors (0.025% S.V.). (C) Each panel represents the patterns of activation by odorants belonging to a single class of chemicals. The intensity of each glomerulus shows its strongest responses to any odor belonging to a given odor class. (D) Illustration of computing the glomerular distances. Upper: Patterns activated by two odors belonging to the same chemical class (green dots and green circles). Pairwise glomerular distances were used to calculate the average distance between the two patterns. Lower: Distance calculation for two odors from separate chemical groups (green dots and orange triangles). (E) Plot of P values for test of the hypothesis, d_BETWEEN − d_WITHIN ≥ D, as a function of D. Color lines indicates the P values for peak response amplitude filtered with no threshold (black), with threshold at 30% maximum response (red), or 50% maximum response (blue). Gray lines indicate results for 12 individual experiments (no threshold). Black horizontal line indicates P value of 0.05.
Our observation contradicted the chemotopic hypothesis. Using our dataset, we performed statistical tests of the chemotopic hypothesis. We calculated the mean distance between the glomeruli activated by two odors. The mean distance values for all odor pairs were separated into two categories: the WITHIN group contained the values for two odors belonging to the same chemical class and the BETWEEN group for odors from two different chemical classes (Fig. 2D). According to the chemotopic hypothesis, the average BETWEEN group distance would be larger than the WITHIN group distance (i.e., d_BETWEEN − d_WITHIN ≥ D, where D was a distance criterion for chemotopy). For D ≥50 μm, the minimal diameter of a single glomerulus, we found no statistical significance between the two distributions in 12 separate experiments (Fig. 2E and Fig. S4 A–C). We also extended our test to the entire bulb. We found that, under a simplified model of chemotopy (Fig. S4C), the probability of seeing all eight chemical groups activating the imaged dorsal region was below 10−6 (Fig. S4D).
Our results, therefore, showed no chemotopy in the olfactory bulb. We wondered whether the discrepancy could be explained by technical differences, especially the less-sensitive methods and the required assembly of data from multiple animals through averaging in previous studies. We transformed our data by blurring and assembling them across different animals to obtain an averaged and threshold-filtered image for individual odors (Fig. S5A). The representational maps for individual odor classes obtained from this transformation indeed produced an impression of chemotopy (Fig. S5 B–E).
Representation of Odorants by Glomerular Population.
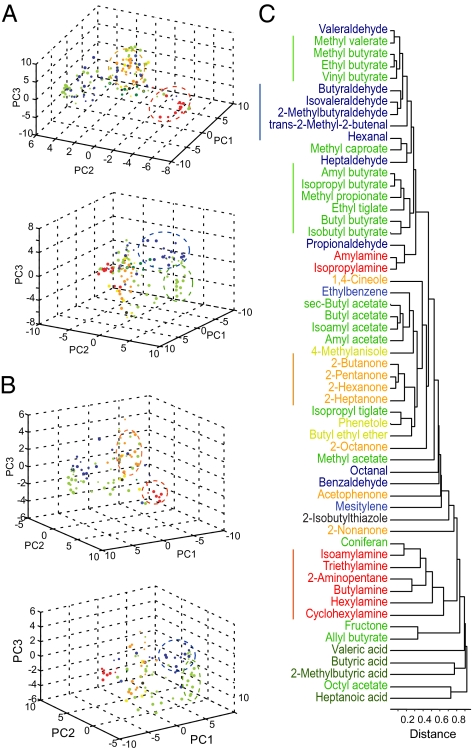
Because individual chemical features were represented by glomeruli distributed across large areas of the bulb, we wondered whether there were specific, nonspatial patterns of activity associated with an odor class. Individual odors could be represented by the population response visualized using dimensional reduction methods such as principal component analysis (PCA) and multidimensional scaling (35). We performed PCA on the datasets and represented individual odor stimuli as vectors in the PCA space denoted by the first three principal components. The plots showed that different classes of odors were largely distributed in the PCA space (Fig. 3 A and B). An odor belonging to one class was usually found intermingled with odors from other classes. We observed that some odorants with structural similarity were found in clusters that contained mostly odors of a single class, especially for odors of the ketone or amine classes. The grouping of the odors was observed also in cluster analysis, another measure of pattern similarity (Fig. 3C). These observations suggested that a subset of odors sharing a common feature could be similarly represented by a group of glomeruli, although the glomeruli were scattered in the dorsal bulb.
Fig. 3.
Representation of odorants by glomerular population. (A) Individual odorants represented in the 3D PCA space. PC1–PC3 are the first three principal components, which explain 38.2% of the variance in response (18.4%, 12.6%, and 7.4% for PC1, PC2, and PC3, respectively). The two panels show two different viewpoints. Odors are color-coded according to their chemical class. Dashed circles indicate the clusters of odorants from four different chemical groups: amine (red), ketone (orange), aldehyde (dark blue), and ester (green). (B) PCA representation of odors in a different mouse. PC1–PC3 explain 45.4% of the variance in response (26.4%, 11.7%, and 7.3%, respectively). (C) Cluster analyses of odor distances calculated from glomerular responses to all concentrations. Lines underneath indicate odorants that are grouped together.
Correlation Between Odor Responses and Odorant Structures.
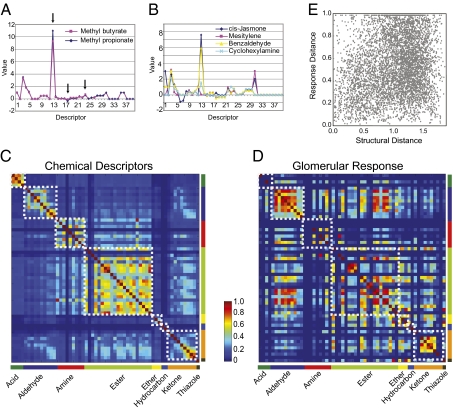
Did the clustering of odors in the PCA space indicate a correlation between population response and structural similarity? Organic compounds were multidimensional entities that could not be simply defined by a single chemical feature, such as a functional moiety. Examination of the patterns of activation according to a simple feature could not capture the complexity of the molecular structures. Because each organic chemical could be described by a set of 1,664 chemical descriptors, they have been used to provide a quantitative measure of structural difference between odors (36, 37). For example, methyl propionate and methyl butyrate shared a common ester moiety but differed in carbon length. Their descriptor profiles mostly overlapped but differed numerically at three positions (Fig. 4A). On the other hand, odorants belonging to different classes could be distinguished by more descriptors (Fig. 4B).
Fig. 4.
Correlation between odor response and odor structure. (A) Odor structural profile described by optimized descriptor set II for methyl butyrate and methyl propionate. Arrows point to the structural features that differentiate the two. (B) Odor structural profiles for four chemicals belonging to four different chemical groups. (C) Heatmap represents the pairwise correlation matrix of structural similarity among 59 odors. The color of the pixel indicates the level of correlation between two odors in structural terms. (D) Heatmap represents the pairwise correlation matrix of response similarity. The correlation values are calculated using glomerular responses at 0.25% S.V. White boxes in C and D include odors within the same chemical groups. (E) Scatter plot in which the distance in glomerulus response for an odor pair is plotted against the distance between the two in chemical space. Data are pooled from 12 experiments.
To probe a comprehensive, quantitative relationship between chemical structure and glomerular response, we first performed cross-correlation analysis of odor pairs using chemical descriptors and glomerular response patterns (Fig. 4 C and D, respectively). Specifically, we used the optimized descriptor set (optimized set II) derived from mammalian OR responses (37) to build a similarity matrix among the odors. The matrix showed high similarity within chemical classes but low similarity between classes (Fig. 4C and Fig. S6 A and B). The similarity matrix for glomerular responses, however, was more complex. We observed that odors from the same class displayed within-group similarity, which was consistent with PCA plot showing clustering of odorants of the same class. Such similarity, however, was not uniform. Some odors within the groups were as dissimilar to each other as they were to odors from other groups. In direct contrast to the similarity matrix for odor structures, we also observed high similarity between odors from different classes (Fig. 4D).
To directly assess the correlation between the two parameters, we computed pairwise similarity scores for odors from 12 animals and plotted the scores against their distances in odor space specified by optimized descriptor set II (Fig. 4E). A distribution concentrated around a diagonal line would indicate a tight correlation between the response patterns and the structural similarity, but the scatter plot showed no such correlation (Fig. 4E). Analyses using optimized descriptor set I (36) or the full descriptor set produced the same result (Fig. S6).
Therefore, when analyzed against large number of odorants, there was no clear correlation between odor structures and the response patterns, suggesting that representation of odor features was not only distributed spatially but also in the population response of the glomeruli. Response similarity was not dictated by structural similarity of the odors, and vice versa.
Correlation Between Odor Tuning and Physical Distance for Glomerular Pairs.
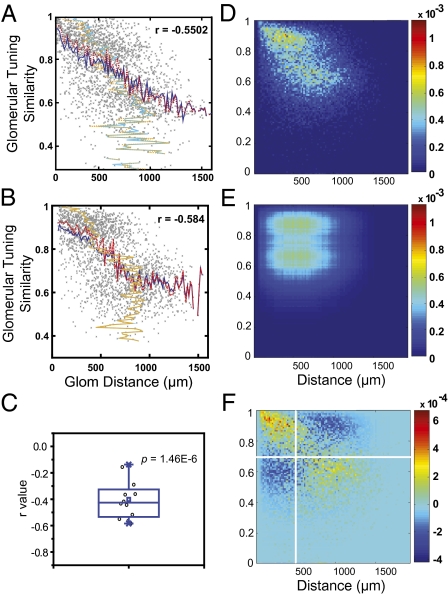
In the absence of chemotopy, was there an alternative organization principle for the glomeruli? We investigated the relationship between the spatial location of the glomeruli and their odor tuning properties. The similarity of odor tuning between a pair of glomeruli could be expressed as the Pearson correlation value between their response profiles. We computed the similarity score in odor tuning and plotted it against the physical distance between a pair of glomeruli and found a correlation in all experiments (r = −0.4 ± 0.15; Fig. 5 A–C). Analysis of ≈30,000 glomeruli pairs from 12 bulbs suggested higher similarity in odor tuning at shorter distance (Fig. 5D). Using a method developed by Meister and colleagues (7), we compared this distribution with the null hypothesis distribution assuming no relationship between tuning similarity and glomerular distance (Fig. 5E). We found a large deviation from the expected independence distribution (Fig. 5F). The most deviation was for pairs with distances <500 μm and similarity score >0.7 (an excess of 16.42% of the total glomerular pairs were above the expected null distribution). We noted that applying only high concentrations of odors in continuous successions, as in previous studies, significantly reduces the correlation (Fig. S7). This was likely due to the adaptation of OSNs to strong odor stimulation. Therefore, it was critical to use short odor delivery, low concentration, and to allow ample recovery time to accurately assess the responses.
Fig. 5.
Correlation between glomerular tuning similarity and physical distance. (A and B) Scatter plots for the similarity in odor tuning between a pair of glomeruli against the physical distance between the pair (two different experiments). Blue solid and red dashed line shows the mean and median for distance (x axis), respectively. Cyan solid line and orange dashed line shows the mean and median values for similarity scores (y axis), respectively. The correlation coefficient values of linear regression fit (r) of the distribution are indicated. (C) Box plot showing the distribution of r values across 12 different experiments. Black circles indicate individual experiments. The P value is for testing against the null hypothesis that the mean of r is zero (t test). (D) A 2D histogram of distribution for glomerular pairs obtained from 12 experiments. Color indicates the amount of glomerular pairs falling into the each bin, expressed as the fraction of total glomerular pairs. (E) A 2D histogram of distribution of the glomerular pairs under the null hypothesis the glomerular odor tuning similarity is not correlated with physical distance. (F) Excess calculated from the subtraction of E from D.
Functional Organization of the Olfactory Glomeruli.
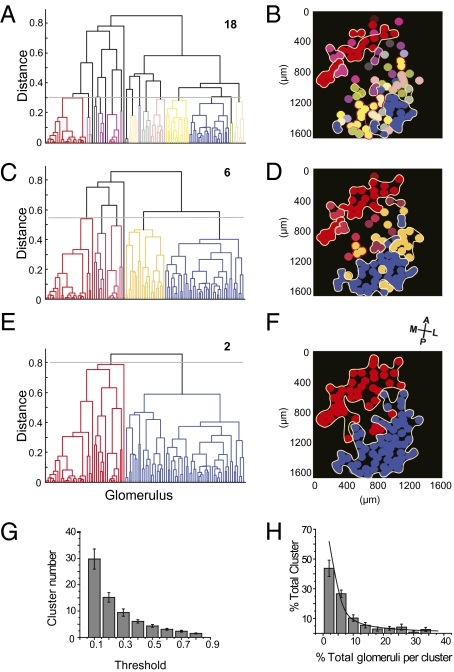
We visualized the spatial relationship of the glomeruli by first performing cluster analysis of the glomeruli using the pairwise similarity scores for odor tuning. At different thresholds the glomeruli could be divided into different numbers of clusters. Color-coding glomeruli within the same cluster revealed that glomeruli with similar tuning properties formed loosely organized patches (Fig. 6 A and B). Higher threshold resulted in larger clusters; each resulted from the merging of neighboring small patches. At the highest threshold, the glomeruli separated into two macrodomains along the anteriomedial–posteriolateral axis (Fig. 6 C–F).
Fig. 6.
Hierarchical organizations of the olfactory glomeruli. (A) Cluster analysis of glomerular similarity in odor tuning. With cutoff at 0.3, the glomeruli are segregated into 18 clusters. Each cluster is color coded. (B) Map of glomeruli marked for their tuning similarity. The colors of the glomeruli match those of the clusters in A. Circles mark adjacent glomeruli that are in the same tuning cluster. (C and D) Cluster analysis with a cutoff value of 0.55 segregates the glomeruli into six clusters. Some of the small clusters shown in B fuse into the large clusters in D. (E and F) Cluster analysis with a cutoff value of 0.8 segregates the glomeruli into two major domains. (G) Histogram showing the number of clusters as a function of threshold. Data are from 12 independent experiments. Error bars show SE. (H) Distribution of cluster sizes. Each column represents the number of clusters with sizes falling into that bin. The number of clusters is normalized to the total number of clusters for each experiment at the specified threshold and is expressed as the percentage of total clusters. Cluster size (number of glomeruli per cluster) is normalized to the total number of glomeruli in each experiment and expressed as the percentage of all glomeruli. Threshold at 0.3 is shown, and the data points are fit with a power law curve (power = −1.07).
Although the projection pattern of OSNs expressing the same receptor was stereotyped, there were large degrees of variation in the precise location of the glomeruli (7, 34). Therefore, it was unlikely that different animals had an identical map. Nevertheless, we found that the general patterns of the clustering were similar among individuals (Fig. S8 A–F). Moreover, the patchy map within the same animal was relatively consistent when subsets of odorants that included all major classes were selected to cluster the glomeruli (Fig. S8 G–I). We quantified the clusters at different threshold and found the number consistent across animals, as indicated by the relatively small error bars (Fig. 6G). Interestingly, at a given threshold, the number of glomeruli falling into each cluster was not distributed evenly (Fig. 6H). The size of the cluster (number of glomeruli in it) was inversely related to the number of such cluster. We found that the distribution was better fit by a power law than an exponential curve. This observation suggested that the patchy hierarchical arrangement of glomeruli according to tuning similarity could be scale free.
Discussion
Using a sensitive, transgenically expressed calcium sensor, we have systematically examined the representation of chemical features of the odorants within individual animals and at single glomerulus resolution in the dorsal bulb. We conclude that there is no direct relationship between the response pattern and odorant structure. Odor features are generally represented by distributed sets of glomeruli. These observations are consistent with several studies that show individual glomeruli are not tuned specifically to a particular chemical feature (7, 23). Although these studies have suggested the lack of fine-scale chemotopy, our study provides a systematic analysis to argue that there is no chemotopic representation of chemical features in either fine or broad scales. Our data are limited to the dorsal area for technical reasons; extending the study to a wider area of the bulb, as well as a quantitative model of chemotopy, will provide more rigorous tests of the model.
We have reached a different conclusion from studies showing chemotopy because of the high sensitivity and the high resolution afforded by G-CaMP2. 2-DG mapping and intrinsic imaging experiments rely on broad patterns such as blood flow to measure glomerular activity and are likely to bias toward densely activated areas. Importantly, the activity maps derived from multiple animals, as in many previous experiments, are coarse owing to the local variability of the glomerulus position. As our simulations show, averaging a strongly activated glomerulus over a larger region diminishes its contribution in sparsely activated areas. A bias toward strongly and densely activated area may create the impression of a chemotopic representation.
Is there a spatial organization of the olfactory glomeruli? We show that the glomeruli are organized according to tuning similarity, regardless of how many chemical groups a glomerulus is tuned to. Our conclusion differs from an earlier study that concludes there is no obvious organization of the olfactory glomeruli (7). The discrepancy can be explained by the differences in probe sensitivity, odor concentration used, and how odors are delivered (Fig. S7). On the other hand, the tunotopic organization found in our study is consistent with a theoretical study that suggests that patchy clusters of similarly tuned glomeruli are likely to form to map the multidimensional odor space onto the 2D glomerular layer (38). The predication has not been experimentally demonstrated or visually identified until now.
The tunotopic organization of the glomeruli may reflect the evolutionary history of the olfactory system. OR genes clustered in the same loci tend to have high sequence homology as a result of local expansion of receptor genes (39). Neurons expressing homologous receptor genes are likely to share common tuning properties, project to the vicinity of each other (40, 41), and form tunotopic clusters. The molecular evolution of the receptor genes, however, is unlikely dictated by specific chemical features to generate segregated representation of chemical structures. We note that the glomerular patches show a surprisingly nonuniform distribution; the size of the patches is inversely related to its number. This pattern of distribution has not been predicted and may reflect an uneven expansion of different receptor genes.
The tunotopic organization of the glomeruli explains the clumped patterns of glomerular activity by some odors. Because neighboring glomeruli tend to share similar odor tuning properties, some odorants can activate a spatially clustered set of glomeruli. However, such clustering should not be mistaken as chemotopy because each glomerulus is tuned broadly in terms of chemical features. As such, some odorants sharing common chemical features may evoke similar population responses whether or not the patterns are spatially clustered. The similarity in activity patterns is likely to be translated into similarity in perceptual experience and explains why some odorants belonging to a given chemical group share a similar perceptual quality (42).
We suggest that the arrangement of glomeruli in the olfactory bulb is fundamentally the same as other sensory maps. Visual, auditory, and somatosensory systems arguably are organized according to tuning similarities. The tuning similarities in these systems correlate with the physical properties (e.g., sound frequency) or the spatial relationship (e.g., retinotopy and somatotopy), whereas in olfaction tuning similarity is not correlated with odor structures. The topographic arrangement in the olfactory bulb, therefore, has little to do with the mapping of chemical features of olfactory stimuli but likely facilitates neural computations. Placing glomeruli with similar odor-tuning properties in close proximity makes it possible to allow local neural circuits to disambiguate similar stimuli through mechanisms such as lateral inhibition (43, 44). This arrangement can provide a mechanism by which odor responses are sharpened and odorants evoking highly similar patterns can be distinguished. Thus, the olfactory bulb does not violate the organization principle found in other sensory systems.
Materials and Methods
G-CaMP2 mice were anesthetized by urethane, and odor-evoked responses were recorded under an upright microscope through thinned bone over the dorsal olfactory bulb. Odors were delivered by a custom-designed olfactometer. Analyses were performed using custom-written software in MATLAB. Detailed methods are described in the SI Materials and Methods. Imaging data are available upon request.
Supplementary Material
Acknowledgments
We thank members of the W. Gan, K. Svoboda, and M. Luo laboratories for advice and suggestions on live animal imaging; Dr. J. Mainland for providing a list of odor descriptors; Dr. T. O'Haver for his peak-finding software; Drs. H. Li, J. Schwartz, and C. Wood for support of the project; E. Gillespie, P. Zelalem, M. Durnin, M. Elmore, S. Klinefelter, A. Moran, and the Lab Animal Services and Microscopy Center at the Stowers Institute for technical assistance; and Drs. R. Axel, J. Carlson, J. Wang, M. Meister, R. Krumlauf, H. Y. Mak, and K. Si for thoughtful discussions. This work was supported by funding from the Stowers Institute and the National Institutes of Health, National Institute on Deafness and Other Communication Disorders Grant 008003 (to C.R.Y.).
Footnotes
The authors declare no conflict of interest.
This article is a PNAS Direct Submission. J.R.C. is a guest editor invited by the Editorial Board.
This article contains supporting information online at www.pnas.org/lookup/suppl/doi:10.1073/pnas.1117491109/-/DCSupplemental.
References
- 1.Glickstein M. Organization of the visual pathways. Science. 1969;164:917–926. doi: 10.1126/science.164.3882.917. [DOI] [PubMed] [Google Scholar]
- 2.Mountcastle VB, Davies PW, Berman AL. Response properties of neurons of cat's somatic sensory cortex to peripheral stimuli. J Neurophysiol. 1957;20:374–407. doi: 10.1152/jn.1957.20.4.374. [DOI] [PubMed] [Google Scholar]
- 3.Kandler K, Clause A, Noh J. Tonotopic reorganization of developing auditory brainstem circuits. Nat Neurosci. 2009;12:711–717. doi: 10.1038/nn.2332. [DOI] [PMC free article] [PubMed] [Google Scholar]
- 4.Chen X, Gabitto M, Peng Y, Ryba NJ, Zuker CS. A gustotopic map of taste qualities in the mammalian brain. Science. 2011;333:1262–1266. doi: 10.1126/science.1204076. [DOI] [PMC free article] [PubMed] [Google Scholar]
- 5.Knudsen EI, du Lac S, Esterly SD. Computational maps in the brain. Annu Rev Neurosci. 1987;10:41–65. doi: 10.1146/annurev.ne.10.030187.000353. [DOI] [PubMed] [Google Scholar]
- 6.Mombaerts P, et al. Visualizing an olfactory sensory map. Cell. 1996;87:675–686. doi: 10.1016/s0092-8674(00)81387-2. [DOI] [PubMed] [Google Scholar]
- 7.Soucy ER, Albeanu DF, Fantana AL, Murthy VN, Meister M. Precision and diversity in an odor map on the olfactory bulb. Nat Neurosci. 2009;12:210–220. doi: 10.1038/nn.2262. [DOI] [PubMed] [Google Scholar]
- 8.Johnson BA, Woo CC, Hingco EE, Pham KL, Leon M. Multidimensional chemotopic responses to n-aliphatic acid odorants in the rat olfactory bulb. J Comp Neurol. 1999;409:529–548. [PubMed] [Google Scholar]
- 9.Johnson BA, Leon M. Odorant molecular length: One aspect of the olfactory code. J Comp Neurol. 2000;426:330–338. doi: 10.1002/1096-9861(20001016)426:2<330::aid-cne12>3.0.co;2-5. [DOI] [PubMed] [Google Scholar]
- 10.Johnson BA, Farahbod H, Leon M. Interactions between odorant functional group and hydrocarbon structure influence activity in glomerular response modules in the rat olfactory bulb. J Comp Neurol. 2005;483:205–216. doi: 10.1002/cne.20409. [DOI] [PMC free article] [PubMed] [Google Scholar]
- 11.Inaki K, Takahashi YK, Nagayama S, Mori K. Molecular-feature domains with posterodorsal-anteroventral polarity in the symmetrical sensory maps of the mouse olfactory bulb: Mapping of odourant-induced Zif268 expression. Eur J Neurosci. 2002;15:1563–1574. doi: 10.1046/j.1460-9568.2002.01991.x. [DOI] [PubMed] [Google Scholar]
- 12.Uchida N, Takahashi YK, Tanifuji M, Mori K. Odor maps in the mammalian olfactory bulb: Domain organization and odorant structural features. Nat Neurosci. 2000;3:1035–1043. doi: 10.1038/79857. [DOI] [PubMed] [Google Scholar]
- 13.Igarashi KM, Mori K. Spatial representation of hydrocarbon odorants in the ventrolateral zones of the rat olfactory bulb. J Neurophysiol. 2005;93:1007–1019. doi: 10.1152/jn.00873.2004. [DOI] [PubMed] [Google Scholar]
- 14.Meister M, Bonhoeffer T. Tuning and topography in an odor map on the rat olfactory bulb. J Neurosci. 2001;21:1351–1360. doi: 10.1523/JNEUROSCI.21-04-01351.2001. [DOI] [PMC free article] [PubMed] [Google Scholar]
- 15.Rubin BD, Katz LC. Optical imaging of odorant representations in the mammalian olfactory bulb. Neuron. 1999;23:499–511. doi: 10.1016/s0896-6273(00)80803-x. [DOI] [PubMed] [Google Scholar]
- 16.Takahashi YK, Kurosaki M, Hirono S, Mori K. Topographic representation of odorant molecular features in the rat olfactory bulb. J Neurophysiol. 2004;92:2413–2427. doi: 10.1152/jn.00236.2004. [DOI] [PubMed] [Google Scholar]
- 17.Wachowiak M, Cohen LB. Correspondence between odorant-evoked patterns of receptor neuron input and intrinsic optical signals in the mouse olfactory bulb. J Neurophysiol. 2003;89:1623–1639. doi: 10.1152/jn.00747.2002. [DOI] [PubMed] [Google Scholar]
- 18.Xu F, et al. Odor maps of aldehydes and esters revealed by functional MRI in the glomerular layer of the mouse olfactory bulb. Proc Natl Acad Sci USA. 2003;100:11029–11034. doi: 10.1073/pnas.1832864100. [DOI] [PMC free article] [PubMed] [Google Scholar]
- 19.Mori K, Takahashi YK, Igarashi KM, Yamaguchi M. Maps of odorant molecular features in the Mammalian olfactory bulb. Physiol Rev. 2006;86:409–433. doi: 10.1152/physrev.00021.2005. [DOI] [PubMed] [Google Scholar]
- 20.Johnson BA, Leon M. Chemotopic odorant coding in a mammalian olfactory system. J Comp Neurol. 2007;503:1–34. doi: 10.1002/cne.21396. [DOI] [PMC free article] [PubMed] [Google Scholar]
- 21.Matsumoto H, et al. Spatial arrangement of glomerular molecular-feature clusters in the odorant-receptor class domains of the mouse olfactory bulb. J Neurophysiol. 2010;103:3490–3500. doi: 10.1152/jn.00035.2010. [DOI] [PubMed] [Google Scholar]
- 22.Mori K, Sakano H. How is the olfactory map formed and interpreted in the mammalian brain? Annu Rev Neurosci. 2011;34:467–499. doi: 10.1146/annurev-neuro-112210-112917. [DOI] [PubMed] [Google Scholar]
- 23.Bozza T, McGann JP, Mombaerts P, Wachowiak M. In vivo imaging of neuronal activity by targeted expression of a genetically encoded probe in the mouse. Neuron. 2004;42:9–21. doi: 10.1016/s0896-6273(04)00144-8. [DOI] [PubMed] [Google Scholar]
- 24.McGann JP, et al. Odorant representations are modulated by intra- but not interglomerular presynaptic inhibition of olfactory sensory neurons. Neuron. 2005;48:1039–1053. doi: 10.1016/j.neuron.2005.10.031. [DOI] [PubMed] [Google Scholar]
- 25.Zou DJ, Chesler A, Firestein S. How the olfactory bulb got its glomeruli: A just so story? Nat Rev Neurosci. 2009;10:611–618. doi: 10.1038/nrn2666. [DOI] [PubMed] [Google Scholar]
- 26.Schoppa NE. Making scents out of how olfactory neurons are ordered in space. Nat Neurosci. 2009;12:103–104. doi: 10.1038/nn0209-103. [DOI] [PubMed] [Google Scholar]
- 27.Sosulski DL, Bloom ML, Cutforth T, Axel R, Datta SR. Distinct representations of olfactory information in different cortical centres. Nature. 2011;472:213–216. doi: 10.1038/nature09868. [DOI] [PMC free article] [PubMed] [Google Scholar]
- 28.Miyamichi K, et al. Cortical representations of olfactory input by trans-synaptic tracing. Nature. 2011;472:191–196. doi: 10.1038/nature09714. [DOI] [PMC free article] [PubMed] [Google Scholar]
- 29.Ghosh S, et al. Sensory maps in the olfactory cortex defined by long-range viral tracing of single neurons. Nature. 2011;472:217–220. doi: 10.1038/nature09945. [DOI] [PubMed] [Google Scholar]
- 30.Stettler DD, Axel R. Representations of odor in the piriform cortex. Neuron. 2009;63:854–864. doi: 10.1016/j.neuron.2009.09.005. [DOI] [PubMed] [Google Scholar]
- 31.Poo C, Isaacson JS. Odor representations in olfactory cortex: “Sparse” coding, global inhibition, and oscillations. Neuron. 2009;62:850–861. doi: 10.1016/j.neuron.2009.05.022. [DOI] [PMC free article] [PubMed] [Google Scholar]
- 32.He J, Ma L, Kim S, Nakai J, Yu CR. Encoding gender and individual information in the mouse vomeronasal organ. Science. 2008;320:535–538. doi: 10.1126/science.1154476. [DOI] [PMC free article] [PubMed] [Google Scholar]
- 33.Wachowiak M, Cohen LB. Representation of odorants by receptor neuron input to the mouse olfactory bulb. Neuron. 2001;32:723–735. doi: 10.1016/s0896-6273(01)00506-2. [DOI] [PubMed] [Google Scholar]
- 34.Strotmann J, et al. Local permutations in the glomerular array of the mouse olfactory bulb. J Neurosci. 2000;20:6927–6938. doi: 10.1523/JNEUROSCI.20-18-06927.2000. [DOI] [PMC free article] [PubMed] [Google Scholar]
- 35.Stopfer M, Jayaraman V, Laurent G. Intensity versus identity coding in an olfactory system. Neuron. 2003;39:991–1004. doi: 10.1016/j.neuron.2003.08.011. [DOI] [PubMed] [Google Scholar]
- 36.Haddad R, et al. A metric for odorant comparison. Nat Methods. 2008;5:425–429. doi: 10.1038/nmeth.1197. [DOI] [PubMed] [Google Scholar]
- 37.Saito H, Chi Q, Zhuang H, Matsunami H, Mainland JD. Odor coding by a Mammalian receptor repertoire. Sci Signal. 2009;2:ra9. doi: 10.1126/scisignal.2000016. [DOI] [PMC free article] [PubMed] [Google Scholar]
- 38.Cleland TA, Sethupathy P. Non-topographical contrast enhancement in the olfactory bulb. BMC Neurosci. 2006;7:7. doi: 10.1186/1471-2202-7-7. [DOI] [PMC free article] [PubMed] [Google Scholar]
- 39.Zhang X, Firestein S. The olfactory receptor gene superfamily of the mouse. Nat Neurosci. 2002;5:124–133. doi: 10.1038/nn800. [DOI] [PubMed] [Google Scholar]
- 40.Wang SS, Lewcock JW, Feinstein P, Mombaerts P, Reed RR. Genetic disruptions of O/E2 and O/E3 genes reveal involvement in olfactory receptor neuron projection. Development. 2004;131:1377–1388. doi: 10.1242/dev.01009. [DOI] [PubMed] [Google Scholar]
- 41.Wang F, Nemes A, Mendelsohn M, Axel R. Odorant receptors govern the formation of a precise topographic map. Cell. 1998;93:47–60. doi: 10.1016/s0092-8674(00)81145-9. [DOI] [PubMed] [Google Scholar]
- 42.Cleland TA, Morse A, Yue EL, Linster C. Behavioral models of odor similarity. Behav Neurosci. 2002;116:222–231. doi: 10.1037//0735-7044.116.2.222. [DOI] [PubMed] [Google Scholar]
- 43.Aungst JL, et al. Centre-surround inhibition among olfactory bulb glomeruli. Nature. 2003;426:623–629. doi: 10.1038/nature02185. [DOI] [PubMed] [Google Scholar]
- 44.Yokoi M, Mori K, Nakanishi S. Refinement of odor molecule tuning by dendrodendritic synaptic inhibition in the olfactory bulb. Proc Natl Acad Sci USA. 1995;92:3371–3375. doi: 10.1073/pnas.92.8.3371. [DOI] [PMC free article] [PubMed] [Google Scholar]
Associated Data
This section collects any data citations, data availability statements, or supplementary materials included in this article.


