Diffraction-quality crystals of the turnip yellow mosaic virus proteinase/ubiquitin hydrolase could only be obtained from a protein preparation that was heavily contaminated with E. coli 30S ribosomal S15 protein. Crystal packing reveals the basis of this observation.
Keywords: Tymoviridae, proteinases, 30S ribosomal S15 protein
Abstract
Turnip yellow mosaic virus is an excellent model for eukaryotic positive-stranded RNA virus replication. Correct processing of the replication polyprotein is dependent on the virally encoded cysteine proteinase (PRO) domain. Crystalline needles obtained from highly pure preparations of the recombinant 17.6 kDa PRO did not diffract. In contrast, small hexagonal prisms that were obtained together with the needles under the same conditions but from a poorly purified preparation diffracted to 2 Å resolution and allowed structure determination by MIRAS. It turned out that the hexagonal crystals contained stoichiometric amounts of PRO and Escherichia coli 30S ribosomal S15, a 10.1 kDa protein commonly co-purified by immobilized metal-affinity chromatography. The solvent content is nearly 70%, with S15 bridging parallel infinite helices of PRO across large solvent channels. With hindsight, this spurious interaction not only yielded diffraction-quality crystals but would also have allowed structure determination by molecular replacement using S15 as a search model and subsequent automatic rebuilding of the asymmetric unit.
1. Introduction
Turnip yellow mosaic virus (TYMV) is a small positive-stranded RNA virus whose replication machinery is encoded in the viral genome as a single polyprotein (206K). From the N-terminus to the C-terminus, 206K harbours a methyltransferase, a cysteine proteinase (PRO), a helicase (HEL or 42K) and an RNA-dependent RNA polymerase (POL or 66K). As for all known positive-stranded RNA viruses, the replication complex is bound to a cellular membrane, the chloroplast envelope of TYMV. Precise temporal regulation of 66K activity is achieved by a series of steps. Firstly, 66K is cleaved from 206K by PRO. The two products (66K and 140K) remain associated through an interaction that has been mapped to the PRO region and 140K is targeted to the chloroplast, forming the nascent replication complex (Jakubiec et al., 2004 ▶). A second cleavage by PRO in 140K occurs at the PRO–HEL junction, triggering regulation of synthesis of the positive strand rather than the negative strand (Jakubiec et al., 2007 ▶). Recently, we reported that the ubiquitin–proteasome system regulates the availability of 66K during infection of plant cells (Camborde et al., 2010 ▶) and that PRO is a functional ubiquitin hydrolase in vitro and in vivo (Chenon et al., 2012 ▶). Here, we describe the crystallization and structure determination of recombinant PRO, the structure of which will be described elsewhere (Robin et al., 2012 ▶).
2. Results and discussion
2.1. Cloning, expression and purification
The coding sequence of the PRO domain (residues 728–879 of 206K) was inserted into a modified pGEX plasmid with an in-frame N-terminal 6×His tag. The expected molecular weight of the resulting protein construct is 17.6 kDa and its N-terminal sequence is MHHHHHHGS728. This plasmid was transformed into Escherichia coli BL21 Rosetta (DE3). An overnight culture was used to inoculate 1 l LB medium containing 50 µg l−1 carbenicillin and 25 µg l−1 chloramphenicol. This culture was grown at 310 K to an optical density (OD600) of 0.6. Expression was induced by the addition of 0.5 mM isopropyl β-d-1-thiogalactopyranoside (IPTG) and the cells were grown for 4 h at 303 K. The cell pellet was harvested, frozen and stored at 253 K.
Approximately 5 g cell pellet was resuspended in 20 ml lysis buffer (100 mM Tris–HCl pH 7.5, 350 mM NaCl, 25 mM imidazole, 1 mM DTT, 0.5% Triton X-100, 2 mg ml−1 lysozyme, 1 U ml−1 Benzonase) and incubated for 60 min on ice. Lysis was completed by five freeze–thaw cycles (70/303 K).
The disrupted cell lysate was centrifuged at 277 K at 8000g for 30 min. All subsequent purification steps were performed at room temperature. The supernatant was loaded onto a 1 ml Ni2+–NTA agarose column (Qiagen) pre-equilibrated with buffer A (100 mM Tris–HCl pH 7.5, 350 mM NaCl, 25 mM imidazole, 1 mM DTT). The column was washed with 50 ml buffer A followed by 10 ml washing buffer A2 (100 mM Tris–HCl pH 6.0, 350 mM NaCl, 25 mM imidazole, 1 mM DTT). The protein was eluted with elution buffer B (100 mM Tris–HCl pH 7.5, 350 mM NaCl, 500 mM imidazole, 1 mM DTT). The eluted PRO was further purified using a high-resolution Superdex S-75 gel-filtration column (Amersham) with buffer C (10 mM Tris–HCl pH 8, 350 mM ammonium acetate, 1 mM DTT).
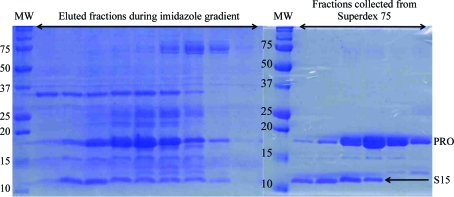
Throughout these steps, a contaminating band of low apparent molecular weight was detected when the fractions were analyzed by 15% Tris–tricine SDS–PAGE (Fig. 1 ▶). We therefore pooled and concentrated only those fractions that were >95% pure as judged by Coomassie Blue staining. The purified protein samples were concentrated to 5–34 mg ml−1, frozen and stored at 193 K. The concentration was estimated from absorbance at 280 nm assuming an absorption of 0.54 cm−1 for a 1 mg ml−1 solution as calculated from the PRO construct sequence.
Figure 1.
SDS–PAGE analysis (15% Tris–tricine gels) of PRO purification. Lanes MW, molecular-weight markers (labelled in kDa).
2.2. Crystallization
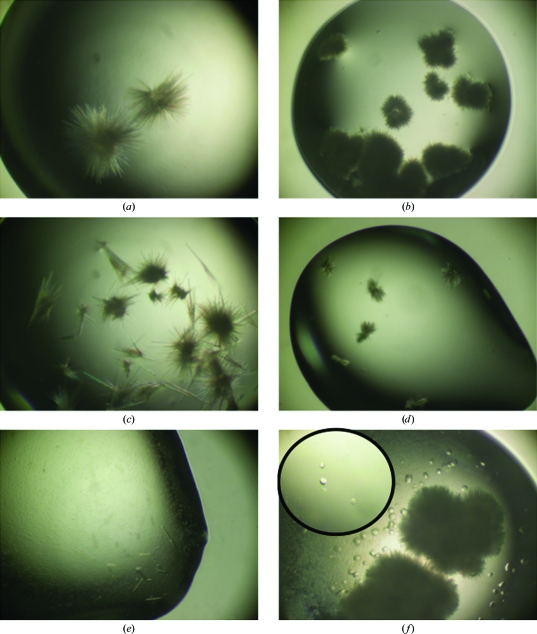
Screening for crystallization conditions was performed by robotics with commercial screens using the sitting-drop vapour-diffusion method. Equal volumes (100 nl) of protein solution in buffer C and well solution were mixed. With the most concentrated sample tried (34 mg ml−1), showers of needles were obtained within a few days with a well solution consisting of 0.1 M HEPES pH 7.5, 2 M ammonium formate at 293 K. Fine screening around this condition was performed in larger drop volumes (1 µl protein solution plus 1 µl crystallization reagent equilibrated against a 0.5 ml reservoir volume) using the hanging-drop vapour-diffusion setup with and without microseeding. We easily reproduced the needles (Fig. 2 ▶) but failed to obtain diffraction-quality crystals (see below). The exception was for a preparation in which all fractions of the gel-filtration step had been pooled by mistake before concentrating to 39 mg ml−1 as judged by absorbance at 280 nm. In one single drop (lower right panel of Fig. 2 ▶; well solution 0.1 M HEPES pH 7.5, 2.5 M ammonium formate), hexagonal crystals of up to 50 × 50 × 40 µm grew within a few days of the appearance of the needles.
Figure 2.
Crystals of PRO. The needles in (a)–(e) were obtained with highly pure fractions of PRO with (e) or without seeding. (f) depicts the crystals that were obtained once when all fractions of the S-75 purification step in Fig. 1 ▶ were pooled.
2.3. Data collection and MIRAS phasing from hexagonal crystals in a single drop
Both the needles and the hexagonal crystals were tested for diffraction at synchrotron sources (SOLEIL Proxima 1 and ESRF ID14-1). Prior to testing, crystals were transferred into 0.1 M HEPES pH 7.5, 4 M ammonium formate, 16% glycerol for ∼30 s and flash-cooled by plunging them into liquid nitrogen. The needles did not show any diffraction. In contrast, the hexagonal crystals diffracted to close to 2 Å resolution. All data were processed with the XDS package (Kabsch, 2010 ▶). Further data analysis was performed with the CCP4 suite (Winn et al., 2011 ▶) except where indicated otherwise.
2.3.1. Native data
We collected an initial native data set to 2.1 Å resolution (Table 1 ▶). The space group was assigned as either P3121 or P3221, with no indication of twinning. Given the point group and unit-cell parameters, one PRO molecule occupies some 20% of the asymmetric unit. We therefore expected at least two, and given the diffraction quality most likely three, PRO molecules per asymmetric unit. However, both the self-rotation and the native Patterson functions were featureless (not shown).
Table 1. Data quality for the first native data set and MIRAS phasing statistics for the three best derivative data sets.
Values in parentheses are for the highest resolution shell of the native data set.
| Data-processing software | XDS/XSCALE | |||
| Space group | P3121/P3221 | |||
| Unit-cell parameters (Å) | a = 135.0, c = 42.2 | |||
| Resolution range (Å) | 40–2.10 (2.15–2.10) | |||
| No. of unique reflections | 25957 (1887) | |||
| Completeness (%) | 99.9 (99.2) | |||
| Multiplicity | 6.9 (4.1) | |||
| Rmerge (%) | 6.1 (50.0) | |||
| 〈I/σ(I)〉 | 23.2 (2.7) | |||
| Phasing method | MIRAS | |||
| No. of derivatives | 3 | |||
| Solution software | Initial heavy-atom locations, SHELXC/D (Sheldrick, 2008 ▶); refinement, completion and pruning of heavy-atom substructure and phasing, autoSHARP (Vonrhein et al., 2007 ▶) | |||
| Phasing set | HgCl2 | NaI | CsCl | Native |
| Radiation source | SOLEIL PX1 | SOLEIL PX1 | SOLEIL PX1 | ESRF ID14-1 |
| Wavelength (Å) | 1.008 | 1.55 | 1.55 | 0.934 |
| Temperature (K) | 100 | 100 | 100 | 100 |
| Resolution range (Å) | 44–2.60 | 44–3.14 | 44–3.07 | 44.2–2.10 |
| No. of sites (after completion and pruning by autoSHARP) | 4 | 14 | 6 | — |
| Phasing resolution range (Å) | 44.2–3.10 | |||
| Figure of merit | 0.44 | |||
2.3.2. Derivative data
PRO displays no detectable sequence identity to any other protein of known structure. In the absence of any methionines in the sequence of PRO and given the lack of reproducibility of the hexagonal crystals, we sought experimental phases by heavy-atom soaks. We focused on mercury compounds to take advantage of the single (catalytic) cysteine [best result: 1 mM TCEP, 4 M ammonium formate, 0.1 M HEPES pH 7.5 for 1 h followed by 10 mM mercury(II) acetate, 4 M ammonium formate, 0.1 M HEPES pH 7.5 for 24 h and then 4 M ammonium formate, 0.1 M HEPES pH 7.5, 12% glycerol for 1 min]. We also performed short (2 min) NaI or CsCl cryosoaks (2 M NaI or CsCl, 2 M ammonium formate, 0.1 M HEPES pH 7.5, 16% glycerol).
Derivative data quality was assessed and heavy-atom positions were sought with SHELXC/D/E (Sheldrick, 2008 ▶) using the HKL2MAP interface (Pape & Schneider, 2004 ▶). The mercury(II) acetate derivative was isomorphous to the native and showed strong anomalous signal but only to low resolution (∼5.5 Å). Anomalous signal extended to beyond 4 Å for both NaI and CsCl cryosoaks, but the crystals suffered from rapid radiation damage at the energy at which we collected the CsCl and NaI data (8 keV). This problem was alleviated somewhat in the case of a 0.8 M NaI cryosoak, for which we could obtain a complete data set (Table 1 ▶). Of the solutions found by SHELXD independently for the mercury(II) acetate, CsCl and NaI derivatives, none was clearly correct as assessed by comparison of SHELXE density-modification results for the direct and enantiomorph hands after either SAD or SIRAS phasing.
2.3.3. MIRAS phasing and density modification with autoSHARP
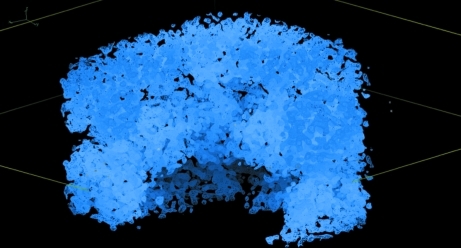
The best SIRAS solution obtained using SHELXD with the mercury(II) acetate derivative after 1000 trials with data cut off at 5 Å resolution showed reasonable contrast to other solutions. We used it as a starting heavy-atom model for three-derivative MIRAS phasing by autoSHARP (Vonrhein et al., 2007 ▶). We input parameters derived from our expectation of the content of the asymmetric unit to the autoSHARP script. In particular, after heavy-atom location, refinement and phasing we initiated solvent flipping by assuming 40% solvent content. However, autoSHARP refined the solvent content to 63.7% in subsequent density modification. The solvent-flipped map assuming space group P3121 and the original heavy-atom hand showed significantly better map statistics than P3221 and the inverse hand. At this stage it was assumed that there were two molecules per asymmetric unit and 60% solvent content. The map was interpretable (Fig. 3 ▶) and cycling between solvent flipping and automated building with ARP/wARP (Perrakis et al., 1999 ▶) unambiguously succeeded (final R free of 0.27 for data in the 40–2.1 Å resolution range) in building most of a PRO molecule and several extra helices.
Figure 3.
Initial electron-density map to 2.1 Å resolution after MIRAS phasing and solvent flipping (assuming 63.7% solvent content; value refined by autoSHARP).
2.4. Model rebuilding and reassessment of the asymmetric unit content
We rebuilt the PRO molecule manually with Coot (Emsley et al., 2010 ▶) and refined the model with phenix.refine (Adams et al., 2010 ▶). The extra helices outside the PRO molecule clearly did not match the PRO sequence. The electron density of the helices was of sufficient quality for us to assign the sequence in places. This partial sequence matched that of E. coli 30S ribosomal S15 protein (10.1 kDa). We were able to confirm by mass spectrometry that the contaminant detected by 15% Tris–tricine SDS–PAGE (Fig. 1 ▶) was S15. We completed model building and refinement of the model with one PRO molecule and one S15 molecule in the asymmetric unit and deposited the refined structure in the PDB (accession code 4a5u; Robin et al., 2012 ▶).
3. Conclusions
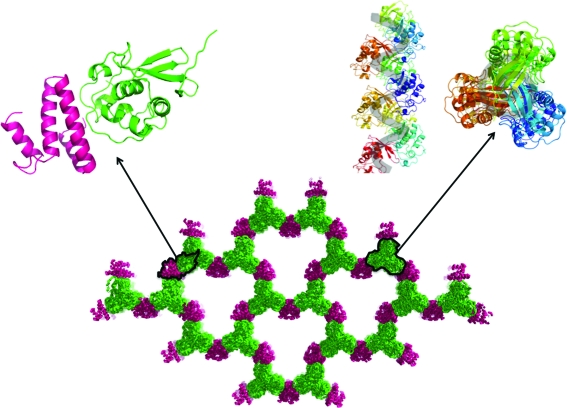
Crystal packing provides clues as to the sequence of events that led to diffraction-quality crystals (Fig. 4 ▶). PRO packs as infinite helices along the crystallographic 31 axis. This is a consequence of one molecule inserting its C-terminus into the catalytic cleft of the next and is a relevant interaction in TYMV polyprotein processing (Robin et al., 2012 ▶). We therefore surmise that this tends to happen whenever PRO is sufficiently concentrated. However, recombinant PRO helices do not tend to form ordered three-dimensional crystals for want of connecting interactions in the orthogonal plane. Fortuitously, S15 provided such bridging interactions between the PRO helices. S15 is a common contaminant in immobilized metal-affinity chromatography from E. coli cytoplasmic extracts (Bolanos-Garcia & Davies, 2006 ▶). Analysis of the S15–PRO interfaces with PISA (Krissinel & Henrick, 2007 ▶) shows that they are typical crystal contacts, burying at most 740 Å2 of solvent-accessible surface area per molecule. However, the resulting packing is a robust three-dimensional grid despite a 69% solvent content.
Figure 4.
Crystal packing. By itself, PRO packs as infinite helices (upper right panel; each PRO molecule is depicted in a distinct colour; PRO is coloured green in the other panels). When PRO is associated with S15 (magenta), the PRO helices bridge across large solvent channels.
With hindsight, the presence of S15 in the crystals combined with the high solvent content and the resolution of the data would have allowed phasing by molecular replacement with Phaser (McCoy et al., 2007 ▶). Even incorrectly assuming the presence of several S15 molecules in the asymmetric unit, searching with chain O from PDB entry 2qal (Borovinskaya et al., 2007 ▶) yields an unambiguous solution (translation Z score of 23) for a single S15 molecule in the correct space group. Automated model rebuilding and refinement with phenix.autobuild (Adams et al., 2010 ▶) subsequently builds a mostly correct model (R free = 0.28) comprising 133 of 148 ordered PRO residues in addition to S15.
Finally, a search of the PDB indicates that the highest resolution to date for a structure of E. coli ribosomal S15 subunit was 3 Å, since this protein is usually reported in complexes of much larger size (and greater biological relevance). A windfall therefore of the present crystal structure is that it provides, for those who may be interested, a higher resolution view of E. coli S15.
Acknowledgments
We acknowledge the Structural Biology and Proteomics pole of the IMAGIF integrated platform (https://www.imagif.cnrs.fr/?nlang=en) for access to crystallization and mass-spectrometry services. We thank the ESRF (European Synchrotron Radiation Facility) and SOLEIL (beamline PROXIMA 1) synchrotrons for generous allocation of beamtime and gratefully acknowledge Pierre Legrand’s help in data collection and processing. This work was supported in part by the Agence Nationale de la Recherche (contracts ANR-06-BLAN-0062 ‘Phospho-pol’ and ANR-11-BSV8-011 ‘Ubi-or-not-ubi’). CR was the recipient of a MESR (French Ministry for Education and Research) predoctoral fellowship.
References
- Adams, P. D. et al. (2010). Acta Cryst. D66, 213–221.
- Bolanos-Garcia, V. M. & Davies, O. R. (2006). Biochim. Biophys. Acta, 1760, 1304–1313. [DOI] [PubMed]
- Borovinskaya, M. A., Pai, R. D., Zhang, W., Schuwirth, B. S., Holton, J. M., Hirokawa, G., Kaji, H., Kaji, A. & Cate, J. H. (2007). Nature Struct. Mol. Biol. 14, 727–732. [DOI] [PubMed]
- Camborde, L., Planchais, S., Tournier, V., Jakubiec, A., Drugeon, G., Lacassagne, E., Pflieger, S., Chenon, M. & Jupin, I. (2010). Plant Cell, 22, 3142–3152. [DOI] [PMC free article] [PubMed]
- Chenon, M., Camborde, L., Cheminant, S. & Jupin, I. (2012). EMBO J. 31, 741–753. [DOI] [PMC free article] [PubMed]
- Emsley, P., Lohkamp, B., Scott, W. G. & Cowtan, K. (2010). Acta Cryst. D66, 486–501. [DOI] [PMC free article] [PubMed]
- Jakubiec, A., Drugeon, G., Camborde, L. & Jupin, I. (2007). J. Virol. 81, 11402–11412. [DOI] [PMC free article] [PubMed]
- Jakubiec, A., Notaise, J., Tournier, V., Héricourt, F., Block, M. A., Drugeon, G., van Aelst, L. & Jupin, I. (2004). J. Virol. 78, 7945–7957. [DOI] [PMC free article] [PubMed]
- Kabsch, W. (2010). Acta Cryst. D66, 125–132. [DOI] [PMC free article] [PubMed]
- Krissinel, E. & Henrick, K. (2007). J. Mol. Biol. 372, 774–797. [DOI] [PubMed]
- McCoy, A. J., Grosse-Kunstleve, R. W., Adams, P. D., Winn, M. D., Storoni, L. C. & Read, R. J. (2007). J. Appl. Cryst. 40, 658–674. [DOI] [PMC free article] [PubMed]
- Pape, T. & Schneider, T. R. (2004). J. Appl. Cryst. 37, 843–844.
- Perrakis, A., Morris, R. & Lamzin, V. S. (1999). Nature Struct. Biol. 6, 458–463. [DOI] [PubMed]
- Robin, C., Beaurepaire, L., Chenon, M., Jupin, I. & Bressanelli, S. (2012). Submitted. [DOI] [PMC free article] [PubMed]
- Sheldrick, G. M. (2008). Acta Cryst. A64, 112–122. [DOI] [PubMed]
- Vonrhein, C., Blanc, E., Roversi, P. & Bricogne, G. (2007). Methods Mol. Biol. 364, 215–230. [DOI] [PubMed]
- Winn, M. D. et al. (2011). Acta Cryst. D67, 235–242.


