Abstract
Introduction
Cartilage endplate (CEP) degeneration is usually accompanied by loss of cellularity, and this loss may be a crucial key factor in initiation and development of degenerative disc disease. The study of cell types in degenerated CEP could help in understanding CEP etiopathogenesis, and may help in devising new treatments, especially if the presence of progenitor cells could be demonstrated. The aim of this study was to determine if progenitor cells existed in degenerated human CEP.
Materials and methods
Cells isolated from CEP were cultured in a three-dimensional agarose suspension to screen for proliferative cell clusters. Cell clusters were then expanded in vitro and the populations were analyzed for colony forming unit, immunophenotype, multilineage induction, and expression of stem cell-related genes.
Results
The presence of progenitor cells in degenerated human CEP is indicated by the results of CFU, immunophenotype, multilineage induction, and expression of stem cell-related genes.
Conclusions
We believe that this is the first study which has conclusively shown the presence of progenitor cells in degenerated CEP. The finding of this study may influence the clinical management of degenerative disc disorder.
Keywords: Intervertebral disc, Degenerative disc disease, Cartilage endplate, Progenitor cells, Cell differentiation
Introduction
Low back pain is a highly prevalent, costly affliction worldwide and is one of the most common reasons for seeking medical advice. Although back pain has many complex causes, degenerative disc disease especially in its early unstable stage is considered to be most important of all the causes [1]. Intervertebral discs are unique cartilaginous joints that provide connectivity between adjacent vertebrae while simultaneously enabling mobility. They are the largest avascular structure in the human body; the mature discs are almost totally reliant on the diffusion of essential solutes across the cartilage endplate (CEP) for nutrition and metabolic exchange [2, 3]. Therefore, many researchers believe that CEP degeneration plays a crucial role in the initiation and development of degenerative disc disease (DDD) [4–6]. CEP degeneration includes many changes such as calcification of the CEP [7], depletion of proteoglycans from the CEP [8] and altered matrix synthesis [9]. Simultaneously, CEP degeneration is always accompanied by a loss of cellularity, possibly secondary to cell apoptosis [10–12], the identification of the cellular types in degenerated CEP is important for understanding the exact degeneration mechanism of CEP.
Recently, the presence of progenitor cells in human articular cartilage has been extensively investigated [13–15]. Although articular cartilage develops only from embryonic mesenchyme and intervertebral discs develop from the notochord as well, these two share similarities in cellular phenotype and extracellular matrix composition [16]. Progenitor cells in degenerated intervertebral discs have been demonstrated by Risbud and Blanco [17, 18], but such a study has not been conducted for the CEP, although CEP is crucial for maintaining the vital function of intervertebral discs [12].
The three-dimensional agarose suspension culture is a selection assay that only chondrocytes and tumor cells are able to survive [19]; mesenchymal stem cells (MSCs), periosteal cells, and fibroblasts do not proliferate. Hence progenitor cells identified within cell clusters are thought to be genuine progenitor cells [20]. The purpose of this study was to utilize this suspension culture system to purify CEP-derived cell clusters. The cell clusters whose diameter extended 50 μm were chosen, and expanded in vitro and identified to prove the hypothesis that progenitor cells exist in degenerated human CEP.
Materials and methods
Case selection
The CEP used in this study was obtained from seven patients who underwent posterior discectomy and fusion for lumbar degenerative disease (Table 1). The approval of the Institutional Review Board and written informed consent for sample collection from the patients were obtained before commencement of the study. The state of CEP degeneration was assessed according to the Modic classification system [21].
Table 1.
Details of the patients enrolled in this study
| Case no. | Diagnosis | Disc level | Modic type | Gender | Age (years) |
|---|---|---|---|---|---|
| 1 | Spondylolisthesis | L4–L5 | II | M | 40 |
| 2 | Spondylolisthesis | L4–L5 | I | F | 39 |
| 3 | Spondylolisthesis | L5–S1 | II | M | 36 |
| 4 | Spinal stenosis | L5–S1 | II | F | 50 |
| 5 | Vertebral instability | L4–L5 | II | F | 43 |
| 6 | Discogenic low back pain | L5–S1 | II | M | 46 |
| 7 | Discogenic low back pain | L4–L5 | I | F | 41 |
Harvest of CEP
Surgically explanted CEP was cleaned of any adherent extraneous tissue under a sterilized dissecting microscope. The nucleus pulposus, annulus fibrosus, and subchondral bone tissues around blocks of CEP was removed, using an ophthalmic operating instrument set under dissecting microscope (magnification ×4). The average thickness of the CEP blocks was 0.8 mm. After washing with phosphate buffered saline (PBS), a small piece of tissue (from each donor) was used for hematoxylin and eosin (H&E) staining to rule out the possibility that any other tissues were also in the CEP. The remaining samples were used to isolate cells.
Confocal microscopy
To detect if mesenchymal stem cell markers such as STRO-1, CD105, CD73 and CD90 were located in some cells within the degenerated CEP tissues, these four antibodies were enrolled and detected by confocal microscopy. Briefly, representative portions of the specimens were received freshly in the operating room, cut into blocks 0.5–0.8 mm thick, immersion-fixed in liquid nitrogen and cut into 12-μm sections on a cryostat. Representative sections were incubated with following monoclonal antibodies: STRO-1 (mouse, 1:100, Santa, USA), CD105 (mouse, 1:100, Santa, USA), CD73 (mouse, 1:100, Santa, USA) and CD90 (mouse, 1:100, Santa, USA) overnight at 4°C, then washed, followed by incubation with a mixture of FITC-conjugated goat anti mouse antibody (1:100, Santa, USA) for 1 h at 37°C. Finally, sections were washed and then mounted in Vectashield mounting medium (Vector Laboratories) containing 4′,6- diamidino-2-phenylindole (DAPI) and visualized with a Leica confocal microscope.
Cell isolation
The remaining sample was minced into pieces <1 mm3, and digested with 0.15% collagenase II (Sigma, USA) in Dulbecco’s modified Eagle’s medium and Ham’s F-12 nutrient mixture (DMEM/F12) containing 3% fetal calf serum (FCS) for 12 h at 37°C. The suspended cells were then filtered through a 70-μm filter to minimize cell aggregates. The cell suspension was transferred to a sterile conical tube and centrifuged for 10 min at 200×g. After aspirating the supernatant, the pellet was resuspended in DMEM/F12 supplemented with 10% FCS and 5 units/mL penicillin and streptomycin (Invitrogen Gibco, USA). The total cell number per tissue sample ranged from 2.5 × 10⁵ to 7.5 × 10⁵. Then the cells were cultured in a 25-cm2 culture flask (Costar Corning, USA) in a humidified atmosphere containing 5% CO2 at 37°C. After the first passage, cells were subcultured in agarose suspensions.
Agarose cultures
To obtain proliferative chondrocyte clones, agarose culture was applied. The agarose culture protocol was that of Thornemo et al. [20]. Briefly, 2% low-melting agarose (Invitrogen, USA) was sterilized by autoclaving and equilibrated to 37°C. Culture dishes (60 mm in diameter, Costar Corning, USA) were coated with 1% low-melting agarose mixed with an equal volume of 37°C 2 × DMEM/F12 and 2% low-melting agarose; the excess agarose was removed by aspiration. After that, a mixture of 0.75 mL DMEM/F12, 0.75 mL 2% low-melting agarose, and 1.5 mL 20% FCS/DMEM/F12 containing 5 × 10⁴ cells were added to the culture dishes. The final concentration of FCS was 10%. Culture dishes were held at 4°C for 15 min until gels solidified. Then the dishes were incubated in a humidified atmosphere containing 5% CO2 at 37°C. The culture medium was refreshed with DMEM/F12 supplemented with 10% FCS and 5 units/mL penicillin and streptomycin twice a week. After 6 weeks, cell clusters (diameter >50 μm) were isolated using a sterile Pasteur pipette and subcultured in 6-well plates (Costar Corning, USA) for flow cytometry and the in vitro multilineage induction assay.
Colony forming unit (CFU) assay
To determine if cells screened by agarose culture were capable of forming colonies, 100 cells were plated in 100-mm culture plates and cultured for 14 days. The cells were stained with 0.5% crystal violet to count the cell number within colonies. A colony that contained >30 cells was considered as a valid CFU.
Flow cytometry analysis
For cell surface phenotyping of the antigens cluster of CD14, CD19, CD34, CD45, CD73, CD90, CD105, human leukocyte antigen (HLA)-DR, and STRO-1, cells from seven human donors at 90% confluence were detached and stained with monoclonal antibodies coupled with fluorescein isothiocyanate (FITC), CD73-FITC, CD90-FITC, CD105-PE, HLA-DR-PerCP and STRO1-FITC. All antibodies were purchased from eBioscience except STRO1-FITC (Santa Cruz Biotechnology, USA). After incubating for 30 min at 37°C, cells were washed 3 times with PBS. Finally, labeled cells were resuspended in 500 μL PBS and subjected to single channel flow cytometry. The extent of positive staining was calculated as a percentage of the total isotype control staining.
Differentiation assays
Three in vitro differentiation assays were performed: osteogenic, adipogenic, and chondrogenic induction. For osteogenic induction, cells were incubated in osteogenic medium containing 10% FCS, 10 nM dexamethasone, 10 mM β-glycerophosphate, and 0.1 mM l-ascorbic acid-2-phosphate for 21 days. The medium was changed twice a week. Negative control wells were maintained in DMEM/F12 supplemented with 10% FCS. After 21 days, mineral deposits were identified by alizarin red staining.
Adipogenic differentiation of cell cultures was induced by exposing cells to a medium containing 10 μg/mL insulin, 1 μM dexamethasone, 500 μM 3-isobutyl-1-methyl xanthine, and 100 μM indomethacin for 72 h. The induction medium was replaced with a maintenance medium containing 10 μg/mL insulin in DMEM and 10% FCS, and kept in culture for 24 h. This 96-h treatment cycle was repeated 3 times, then the culture was maintained in adipogenic maintenance medium until 21 days. Negative control wells were maintained in DMEM/F12 supplemented with 10% FCS for the duration of the assay. After 21 days, lipid droplets were stained with Oil Red O.
For chondrogenic induction, cells were incubated using a micromass culture method. Micromass cultures were generated by 20 μL droplets of cell solution (1.0 × 10⁷ cells/mL) in the center of multiwell plate wells. After cultivating micromass cultures for 2 h under high humidity conditions, warmed chondrogenic medium (low-glucose DMEM supplemented with 10 ng/mL transforming growth factor-β3, 10−7 M dexamethasone, 50 μg/mL ascorbate-2-phosphate, 40 μg/mL proline, 100 μg/mL pyruvate, and 1:100 diluted ITS + Premix) was added to the culture vessels and incubated up to 21 days. After 21 days of chondrogenic induction, the micromass cultures were fixed and stained with 1% alcian blue 8GX.
Reverse transcriptase polymerase chain reaction (RT-PCR)
Total RNA was extracted from cells cultured with or without osteogenic, adipogenic, or chondrogenic supplements, using an RNase kit (Qiagen GmbH, Germany) according to the manufacturer’s instructions. Isolated RNA was treated with RNase-free DNase (Qiagen GmbH) before being reverse transcribed into cDNA. Total RNA was measured using a spectrophotometer (Beckman, Flllerton, CA) at 260 and 280 nm. RNA (one microgram) was reverse transcribed with an oligo (dT) primer using the ThermoScriptTM RT-PCR system (Invitrogen, USA) for cDNA synthesis. For PCR, 1 μL of cDNA template was used for each reaction and sequences were amplified using Taq DNA polymerase. Human-specific gene primers were designed and synthesized as in Table 2. The RT-PCR results were normalized to the expression of the housekeeping gene glyceraldehydes-3-phosphate dehydrogenase (GAPDH).
Table 2.
Primers used for RT-PCR analysis
| Target gene | Primers sequence | TA (°C) | Cycles |
|---|---|---|---|
| RUNX-2 | Sense 5′-ACGACAACCGCACCATGGT-3′ Antisense 5′-CTGTAATCTGACTCTGTCCT-3′ |
59 | 30 |
| Alkaline phosphatase (ALP) | Sense 5′-TGGAGCTTCAGA AGCTCAACACCA-3′ Antisense 5′-ATCTCGTTGTCTGAGTACCAGTCC-3′ |
59 | 28 |
| Osteocalcin (OC) | Sense 5′-ATGAGAGCCCTCACACTCCTC-3′ Antisense 5′-GCCGTAGAAGCGCCGATAGGC-3′ |
59 | 30 |
| Peroxisome proliferators-activated receptor 2 (PPAR-2) | Sense 5′-CGAGGGCGATCTTGACAGGAA-3′ Antisense 5′-CAGGGGGGTGATGTGTTTGAAC-3′ |
55 | 30 |
| Adipogenic protein (APP) | Sense 5′-CTGTCCAAGTCCAACAGCAA-3′ Antisense 5′-ACGTTGGCAGCTTTACGTCT-3′ |
55 | 30 |
| Lipoprotein lipase (LPL) | Sense 5′-TCCGCGTGATTGCAGAGAGAG-3′ Antisense 5′-TGCTGCTTCTTTTGGCTCTGACT-3′ |
55 | 30 |
| Aggrecan (AGG) | Sense 5′-TGAGGAGGGCTGGAACAAGTACC-3′ Antisense 5′-GGAGGTGGTAATTGCAGGGAACA-3′ |
57 | 28 |
| Collagen II (COL II) | Sense 5′-TTTCCCAGGTCAAGATGGTC-3′ Antisense 5′-TCACCTGGTTTTCCACCTTC-3′ |
57 | 30 |
| SOX-9 | Sense 5′-TGGCCGAGATGATCCTAAAAATAA-3′ Antisense 5′-GCGCTTGGATAGGTCATGTTTGT-3′ |
57 | 30 |
| SOX-2 | Sense 5′-CCCCTGTGGTTACCTCTTCCTC-3′ Antisense 5′-GGCCGCTCTGGTAGTGCTG-3′ |
61 | 32 |
| NANOG | Sense 5′-ACCCCGTTTCACTGTGTTAGC-3′ Antisense 5′-GACGGCAGCCAAGGTTATTAAA-3′ |
63 | 32 |
| OCT4 | Sense 5′-GGCAAGCGATCAAGCAGCGAC-3′ Antisense 5′-GGGAAAGGGACCGAGGAGTAC-3′ |
61 | 32 |
| GAPDH | Sense 5′-GGGCTGCTTTTAACTCTGGT-3′ Antisense 5′-TGGCAGGTTTTTCTAGACGG-3′ |
57 | 30 |
Stem cell-related gene expression assay
To identify the expression of genes responsible for stem cells, three stem cell-related genes (NANOG, SOX-2 and OCT-4) were analyzed using RT-PCR. The details of related genes are listed in Table 2.
Data analyses
The histological data was qualitatively described. Representative images were shown. The positive cell percentage analyzed by flow cytometry was reported as mean ± SD (n = 7). The paired-samples t test was employed to detect a significant difference between the positive staining group and the isotype-matched negative control. All data analyses were performed using SPSS 10.0, and p < 0.05 was regarded as statistically significant.
Results
Modic type II changes and histomorphology of degenerated human CEP tissues
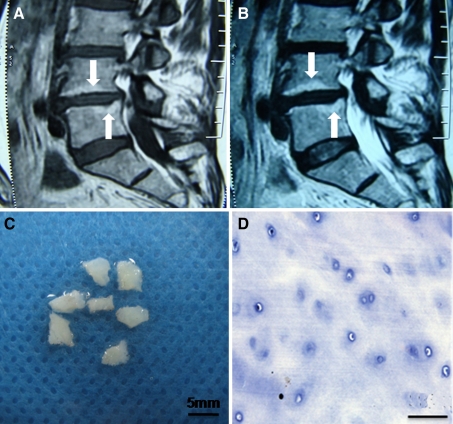
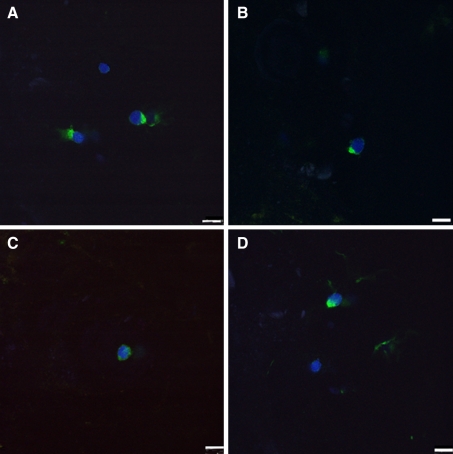
Typical Modic type II changes showed increased signal intensity both on T1- and T2-weighted spin-echo images (Fig. 1a, b). The CEP appeared white and translucent after being cleaned under the dissecting microscope (Fig. 1c). The extracellular matrix of the CEP tissues was homogeneous, with deposits of round-shaped chondrocytes distributed into different layers (Fig. 1d). We observed no vascular or fat tissues in any of the CEP samples. Regarding the confocal microscopy assay, the results revealed that there were some cells that expressed STRO-1, CD105, CD73 and CD90 in the degenerated CEP tissues (Fig. 2). This indicated that some cells in the degenerated CEP tissues had similar immunophenotype characteristics of MSCs.
Fig. 1.
Modic type II changes and histomorphology of degenerated human CEP tissues from case 7. a Increased signal intensity on T1-weighted spin-echo images (arrows), b increased signal intensity on T2-weighted spin-echo images (arrows), c gross morphology, and d histologic morphology with H&E staining. Bar 50 μm
Fig. 2.
Confocal microscopy assay of STRO-1, CD105, CD73, and CD90 in human-degenerated CEP from case 2. a STRO-1, b CD105, c CD73, and d CD90. Bar 10 μm
Cell morphology of CEP-derived progenitor cells
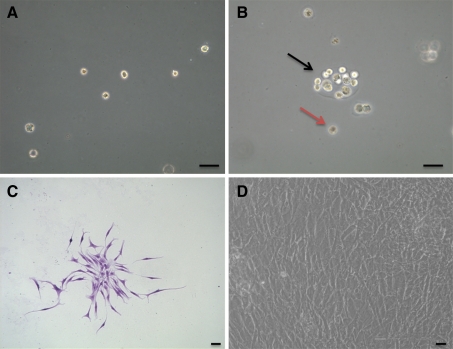
Three-dimensional selective suspension culture with agarose was used to screen for proliferative chondrocytes. The cultured chondrocytes were uniformly distributed into the agarose and kept in the monoplast phase immediately after seeding (Fig. 3a). After culture in agarose for 6 weeks, a portion of the cells formed cell clusters with diameters >50 μm, as observed under the phase contrast microscope. Some chondrocytes showed no division and persisted in monoplast phase (Fig. 3b). Cells in dishes were capable of forming CFU (Fig. 3c). When cell clusters were cultured in plates, cells adhered to the plate and exhibited a fibroblast-like morphology (Fig. 3d).
Fig. 3.
Agarose suspension culture and expanded cells of human CEP-derived chondrocytes studied by phase-contrast microscope from case 7. a Monoplasts distributed into agarose immediately after seeding, b a cell cluster formed after 6 weeks (black arrow) and a representative monoplast (brown arrow), c morphology of CFUs stained by crystal violet, d morphology of the expanded CEP-derived progenitor cells. Bar 50 μm
Flow cytometry assay
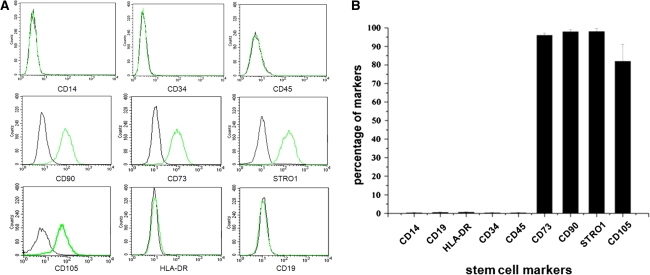
Surface immunophenotypes were positive for CD73, CD90, CD105 and STRO-1, but negative for CD14, CD19, CD34, CD45 and HLA-DR (Fig. 4a). The mean percentages of CD73, CD90, STRO-1 and CD105 were 96.10, 98.01, 98.04 and 82.02%, respectively. The percentage of CD105 was a little lower than that of CD73, CD90 and STRO-1. Mean surface immunophenotypic expression values and standard deviations are summarized in Fig. 4b.
Fig. 4.
Stem cell markers analyzed by flow cytometry. a The green lines represent the fluorescence intensity of cells stained with the indicated antibodies, and the black lines represent the isotype-matched negative controls, b percentages of CEP-derived cells expressing different stem cell markers. Each group contains seven CEP cell samples (n = 7)
In vitro osteogenic, adipogenic and chondrogenic assays
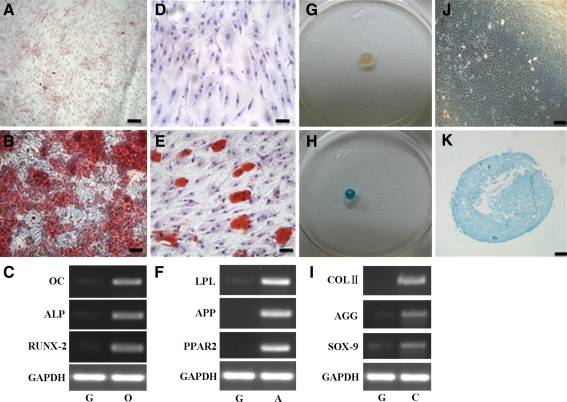
After populations of cell clusters were expanded, CEP-derived progenitor cells were divided into three groups and induced to osteogenesis, adipogenesis, or chondrogenesis in their respective specific media for 21 days. In the osteogenic assay, the CEP-derived progenitor cells exhibited the formation of a calcium-rich matrix (Fig. 5b); cells cultured in the growth medium showed minimal alizarin red staining (Fig. 5a), suggesting little or no formation of calcium-rich matrix.
Fig. 5.
In vitro osteogenic, adipogenic and chondrogenic assay of CEP-derived progenitor cells from case 5. Cells cultured in osteogenic medium produced an alizarin red positive matrix (b) and no positive staining in the growth medium (a). Cells cultured in adipogenic medium formed intracellular lipid droplets that were stained with Oil Red O (e), and no adipocytes could be found in the non-induction growth medium (d). Cells cultured in chondrogenic induction micromass medium formed an aggregate (g), and produced an alcian blue positive matrix both in the gross morphology (h) and histologic morphology (k), compared with the non-induction growth group (j). The mRNA expression of osteogenic (c), adipogenic (f)- and chondrogenic (i)-related genes were markedly upregulated under induction medium compared with the non-induction growth group. g, o, a, and c indicates the growth, osteogenic, adipogenic, and chondrogenic induction medium, respectively. Bar 100 μm
In the adipogenic assay, CEP-derived progenitor cells exhibited characteristic intracellular lipid droplets that could be stained with Oil Red O (Fig. 5e). In contrast, no adipocytes containing lipid vacuoles could be identified in the non-induction group (Fig. 5d).
In the chondrogenic micromass culture medium, cells began to form aggregates within the first 1–2 days of culture. During successive cultures, adjacent nodules began to coalesce and aggregates increased in size (Fig. 5g). After induction for 21 days, the aggregates exhibited a positive alcian blue staining both in gross (Fig. 5h) and histologic morphologies (Fig. 5k), demonstrating the presence of a sulfated proteoglycan-rich extracellular matrix, characteristic of cartilage. In the growth culture, no aggregates formed and very few cells amongst the aggregate stained positively for alcian blue (Fig. 5j).
In addition, mRNA analysis of RT-PCR results revealed that the osteogenesis-related genes (ALP, OC, and RUNX-2; Fig. 5c), the adipogenesis-related genes (PPAR-2, APP and LPL; Fig. 5f) and chondrogenesis-related genes (AGG, COL II and SOX-9; Fig. 5i) were all markedly increased in the respective induced group as compared to the control (non-induction, growth) group.
Stem cell-related gene expression
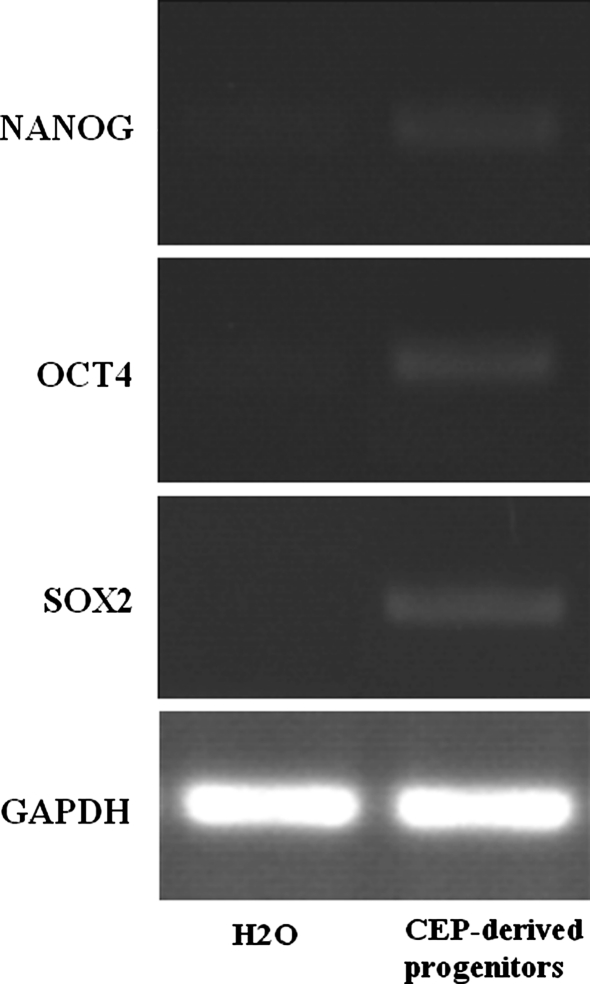
NANOG, SOX-2, and OCT-4 are key regulators of gene transcription in primitive stem cells. NANOG, SOX-2, and OCT-4 were also expressed in the CEP-derived progenitor cells (Fig. 6).
Fig. 6.
Stem cell-related genes were expressed in the CEP-derived progenitor cells from case 5
Discussion
The overall results of the present study demonstrated that there is a population of multipotent stem cells within degenerated human CEP. The gross and histologic morphologies of CEP showed that there were no vascular or fat tissues in the retrieved samples, ensuring that other potential sources of stem cells were eliminated. Thus, cells expressing STRO-1, CD105, CD73 and CD90 detected by confocal microscopy are derived from CEP tissues rather than vascular or fat tissues.
The agarose suspension culture selects for chondrocytes; these are the only cell type able to survive apart from tumor cells [19]. Thornemo et al. [20] cultured human articular chondrocytes in agarose for 6 weeks and identified cell clusters whose diameters were greater than 50 μm. Furthermore, these cell clusters had a capacity for multidirectional differentiation [20]. Using this culture, we not only excluded cells other than chondrocytes but also portions of these formed cell clusters whose diameter extended beyond 50 μm. These were chosen and expanded for further CFU assays, flow cytometry for cell surface antigens, and osteogenic, adipogenic, and chondrogenic differentiation.
In the CFU assays, we used a low cell seeding density (<50 cells/cm2), as Sekiya et al. [22] reported that at 50 cells/cm2, cells with stem or progenitor cell characteristics could survive while other types died due to loss of cell-to-cell contact or underwent dissolution because of low proliferation velocity. In our assay, CEP-derived progenitor cells were expanded in vitro and formed colonies.
The flow cytometry assays for cell surface antigens showed high expressions (>95%) of CD73, CD90 and STRO-1 and negative expressions (<2.0%) of the pan-monocytic antigen CD14, the pan-B-cell marker CD19, the hematopoietic stem cell marker CD34, the pan-hematopoietic marker CD45 and the class 2 HLA antigen HLA-DR. The expression of adhesion molecule CD105 was a little lower (82.02%). In a previous study of nucleus pulposus-derived progenitor cells, the expression of CD105 was also a little lower, and the authors attributed this to their presence in this unique location of the notochord [18]. In the current study, the histomorphologic results of tri-lineage induction of CEP-derived progenitor cells and the expression of the corresponding osteogenic, adipogenic, and chondrogenic lineage-specific genes lent further strength to the efficacy of the differentiation assays. There is no specific marker to identify MSCs, but according to their biological characteristics reviewed by Kolf et al. [23] and the criteria set by the International Society for Cellular Therapy (ISCT) [24] our results fulfilled the majority of the requirements for MSCs: in vitro adherence to plastic surfaces, an immunophenotypic profile, and the capacity to differentiate into osteogenic, adipogenic and chondrogenic lineages.
Although STRO-1 was not mentioned in the ISCT criteria, STRO-1 was found to be a suitable marker to identify multipotential cells [25]. In our study, CEP-derived progenitor cells also expressed the stem cell-related genes OCT-4, NANOG and SOX-2. In a previous study, these three genes were expressed highly in pluripotent cells and were considered markers of primitive human CEP [26]. Thus, there is potent evidence for the existence of progenitor cells in degenerated human CEP.
Modic changes, visible in magnetic resonance imaging (MRI), are a feature associated with degenerative intervertebral disc disease. These endplate lesions are divided into three categories, I–III [21]. All the CEP samples employed in this study were Modic type I or II, revealed by MRI, and indicated CEP degeneration. The exact pathogenesis of Modic changes is not known. Type I changes are hypointense on T1-weighted imaging (T1WI), hyperintense on T2-weighted imaging (T2WI), and represent bone marrow edema and inflammation. Type II are hyperintense on T1WI, isointense or slightly hyperintense on T2WI, and are associated with the conversion of normal red hemopoietic bone marrow to yellow and fatty as a result of marrow ischemia. Type III changes are hypointense on both T1WI and T2WI, and thought to represent subchondral bone sclerosis [21]. These changes are conventionally considered reversible, and our study indicated that cells from the CEP had the potential to differentiate into multilineages that included adipocytes, osteocytes and chondrocytes. The reversibility of Modic changes may well be attributed to the fact that in the degenerated disc there are many inflammatory cytokines, and these mediators might have the capacity to induce the differentiation of progenitor cells.
The findings described above are clinically relevant, as they open up new avenues for managing cases of degenerative disc disorders. There are, however, certain issues that would need to be addressed in future studies in this direction. The cell markers used in this study, although suitable for characterizing the progenitor phenotype, need to be supplemented by a larger and broader group to make the study comprehensive. Secondly, these CEP-derived progenitor cells were harvested from degenerated intervertebral discs, which might include a substantial amount of inflammatory factors and cytokines. It is not known what effects these mediators might have had on the progenitor cell population within the injured CEP. Hence, whether progenitor cells exist in the normal human CEP is needed to be clarified in further work. Finally, there needs to be further analyses to complete the characterization of CEP-derived progenitor cells and to ascertain if they are similar to those found in bone marrow.
To our knowledge, this is the first time the presence of progenitor cells has been described in degenerated human CEP, and these cells exhibited universal progenitor cell characteristics. In addition, the ability to isolate progenitor cells from degenerated human CEP tissues will improve our understanding of the role of resident CEP-derived progenitor cells in intervertebral disk disease pathophysiology, repair and degeneration processes such as DDD in humans.
Acknowledgments
This work was supported by the National Natural Science Foundation of China (No. 81071498 and No. 81071496).
Conflict of interest
None.
Footnotes
B. Huang and L.-T. Liu are co-first authors.
B. Huang and L.-T. Liu contributed equally to this work.
Contributor Information
Bo Huang, Phone: +86-23-68755608.
Lan-Tao Liu, Phone: +86-23-68755608.
Chang-Qing Li, Phone: +86-23-68755608, FAX: +86-23-68755608, Email: younglee881@163.com.
Ying Zhuang, Phone: +86-23-68755608.
Shi-Yuan Hu, Phone: +86-23-68755608.
Yue Zhou, Phone: +86-23-68755608, FAX: +86-23-68755608, Email: happyzhou@vip.163.com.
References
- 1.Luoma K, Riihimaki H, Luukkonen R, Raininko R, Viikari-Juntura E, Lamminen A. Low back pain in relation to lumbar disc degeneration. Spine. 2000;25:487–492. doi: 10.1097/00007632-200002150-00016. [DOI] [PubMed] [Google Scholar]
- 2.Holm S, Maroudas A, Urban JP, Selstam G, Nachemson A. Nutrition of the intervertebral disc: solute transport and metabolism. Connect Tissue Res. 1981;8:101–119. doi: 10.3109/03008208109152130. [DOI] [PubMed] [Google Scholar]
- 3.Magnier C, Boiron O, Wendling-Mansuy S, Chabrand P, Deplano V. Nutrient distribution and metabolism in the intervertebral disc in the unloaded state: a parametric study. J Biomech. 2009;42:100–108. doi: 10.1016/j.jbiomech.2008.10.034. [DOI] [PubMed] [Google Scholar]
- 4.Rajasekaran S, Venkatadass K, Naresh BJ, Ganesh K, Shetty AP. Pharmacological enhancement of disc diffusion and differentiation of healthy, ageing and degenerated discs: results from in vivo serial post-contrast MRI studies in 365 human lumbar discs. Eur Spine J. 2008;17:626–643. doi: 10.1007/s00586-008-0645-6. [DOI] [PMC free article] [PubMed] [Google Scholar]
- 5.Boyd LM, Carter AJ. Injectable biomaterials and vertebral endplate treatment for repair and regeneration of the intervertebral disc. Eur Spine J. 2006;15(Suppl 3):S414–S421. doi: 10.1007/s00586-006-0172-2. [DOI] [PMC free article] [PubMed] [Google Scholar]
- 6.Holm S, Holm AK, Ekstrom L, Karladani A, Hansson T. Experimental disc degeneration due to endplate injury. J Spinal Disord Tech. 2004;17:64–71. doi: 10.1097/00024720-200402000-00012. [DOI] [PubMed] [Google Scholar]
- 7.Peng B, Hou S, Shi Q, Jia L. The relationship between cartilage end-plate calcification and disc degeneration: an experimental study. Chin Med J (Engl) 2001;114:308–312. [PubMed] [Google Scholar]
- 8.Roberts S, Urban JP, Evans H, Eisenstein SM. Transport properties of the human cartilage endplate in relation to its composition and calcification. Spine. 1996;21:415–420. doi: 10.1097/00007632-199602150-00003. [DOI] [PubMed] [Google Scholar]
- 9.Antoniou J, Goudsouzian NM, Heathfield TF, Winterbottom N, et al. The human lumbar endplate. Evidence of changes in biosynthesis and denaturation of the extracellular matrix with growth, maturation, aging, and degeneration. Spine. 1996;21:1153–1161. doi: 10.1097/00007632-199605150-00006. [DOI] [PubMed] [Google Scholar]
- 10.Ariga K, Miyamoto S, Nakase T, Okuda S, et al. The relationship between apoptosis of endplate chondrocytes and aging and degeneration of the intervertebral disc. Spine. 2001;26:2414–2420. doi: 10.1097/00007632-200111150-00004. [DOI] [PubMed] [Google Scholar]
- 11.Liebscher T, Haefeli M, Wuertz K, Nerlich AG, Boos N. Age-related variation in cell density of human lumbar intervertebral disc. Spine. 2011;36:153–159. doi: 10.1097/BRS.0b013e3181cd588c. [DOI] [PubMed] [Google Scholar]
- 12.Moore RJ. The vertebral endplate: disc degeneration, disc regeneration. Eur Spine J. 2006;15(Suppl 3):S333–S337. doi: 10.1007/s00586-006-0170-4. [DOI] [PMC free article] [PubMed] [Google Scholar]
- 13.Hattori S, Oxford C, Reddi AH. Identification of superficial zone articular chondrocyte stem/progenitor cells. Biochem Biophys Res Commun. 2007;358:99–103. doi: 10.1016/j.bbrc.2007.04.142. [DOI] [PMC free article] [PubMed] [Google Scholar]
- 14.Fickert S, Fiedler J, Brenner RE. Identification of subpopulations with characteristics of mesenchymal progenitor cells from human osteoarthritic cartilage using triple staining for cell surface markers. Arthritis Res Ther. 2004;6:R422–R432. doi: 10.1186/ar1210. [DOI] [PMC free article] [PubMed] [Google Scholar]
- 15.Alsalameh S, Amin R, Gemba T, Lotz M. Identification of mesenchymal progenitor cells in normal and osteoarthritic human articular cartilage. Arthritis Rheum. 2004;50:1522–1532. doi: 10.1002/art.20269. [DOI] [PubMed] [Google Scholar]
- 16.Richardson SM, Hoyland JA, Mobasheri R, Csaki C, Shakibaei M, Mobasheri A. Mesenchymal stem cells in regenerative medicine: opportunities and challenges for articular cartilage and intervertebral disc tissue engineering. J Cell Physiol. 2010;222:23–32. doi: 10.1002/jcp.21915. [DOI] [PubMed] [Google Scholar]
- 17.Risbud MV, Guttapalli A, Tsai TT, Lee JY, et al. Evidence for skeletal progenitor cells in the degenerate human intervertebral disc. Spine. 2007;32:2537–2544. doi: 10.1097/BRS.0b013e318158dea6. [DOI] [PubMed] [Google Scholar]
- 18.Blanco JF, Graciani IF, Sanchez-Guijo FM, Muntion S, et al. Isolation and characterization of mesenchymal stromal cells from human degenerated nucleus pulposus: comparison with bone marrow mesenchymal stromal cells from the same subjects. Spine. 2010;35:2259–2265. doi: 10.1097/BRS.0b013e3181cb8828. [DOI] [PubMed] [Google Scholar]
- 19.Benya PD, Shaffer JD. Dedifferentiated chondrocytes reexpress the differentiated collagen phenotype when cultured in agarose gels. Cell. 1982;30:215–224. doi: 10.1016/0092-8674(82)90027-7. [DOI] [PubMed] [Google Scholar]
- 20.Thornemo M, Tallheden T, Sjogren JE, Larsson A, et al. Clonal populations of chondrocytes with progenitor properties identified within human articular cartilage. Cells Tissues Organs. 2005;180:141–150. doi: 10.1159/000088242. [DOI] [PubMed] [Google Scholar]
- 21.Modic MT, Steinberg PM, Ross JS, Masaryk TJ, Carter JR. Degenerative disk disease: assessment of changes in vertebral body marrow with MR imaging. Radiology. 1988;166:193–199. doi: 10.1148/radiology.166.1.3336678. [DOI] [PubMed] [Google Scholar]
- 22.Sekiya I, Larson BL, Smith JR, Pochampally R, Cui JG, Prockop DJ. Expansion of human adult stem cells from bone marrow stroma: conditions that maximize the yields of early progenitors and evaluate their quality. Stem Cells. 2002;20:530–541. doi: 10.1634/stemcells.20-6-530. [DOI] [PubMed] [Google Scholar]
- 23.Kolf CM, Cho E, Tuan RS. Mesenchymal stromal cells. Biology of adult mesenchymal stem cells: regulation of niche, self-renewal and differentiation. Arthritis Res Ther. 2007;9:204–214. doi: 10.1186/ar2116. [DOI] [PMC free article] [PubMed] [Google Scholar]
- 24.Dominici M, Le BK, Mueller I, Slaper-Cortenbach I, et al. Minimal criteria for defining multipotent mesenchymal stromal cells. The International Society for Cellular Therapy position statement. Cytotherapy. 2006;8:315–317. doi: 10.1080/14653240600855905. [DOI] [PubMed] [Google Scholar]
- 25.Dennis JE, Carbillet JP, Caplan AI, Charbord P. The STRO-1+ marrow cell population is multipotential. Cells Tissues Organs. 2002;170:73–82. doi: 10.1159/000046182. [DOI] [PubMed] [Google Scholar]
- 26.Carlin R, Davis D, Weiss M, Schultz B, Troyer D. Expression of early transcription factors Oct-4, Sox-2 and Nanog by porcine umbilical cord (PUC) matrix cells. Reprod Biol Endocrinol. 2006;4:8–21. doi: 10.1186/1477-7827-4-8. [DOI] [PMC free article] [PubMed] [Google Scholar]


