Abstract
Transcription factors (TFs) bind to specific DNA sequences to induce or repress gene expression. Expression levels can be tuned by changing TF concentrations, but the precision of such tuning is limited, since the fraction of time a TF occupies its binding site is subject to stochastic fluctuations. Bicoid (Bcd) is a TF that patterns the early Drosophila embryo by establishing an anterior-to-posterior concentration gradient and activating specific gene targets (“gap genes”) in a concentration-dependent manner. Recently, the Bcd gradient and its in-vivo diffusion were quantified in live embryos, raising a quandary: the precision by which the Bcd target genes are defined (one-cell resolution) appeared to exceed the physical limits set by the stochastic binding of Bcd to DNA. We hypothesize that early readout of Bcd could account for the observed precision. Specifically, we consider the possibility that gap genes begin to be expressed earlier than typically measured experimentally, at a time when the distance between the nuclei is large. At this time, the difference in Bcd concentration between adjacent nuclei is large, enabling better tolerance for measurement imprecision. We show that such early decoding can indeed increase the accuracy of gap-gene expression, and that the initial pattern can be stabilized during subsequent divisions.
Keywords: Bicoid, Morphogen, Noise, Stochastic simulation, Drosophila, Development
Introduction
During development, uniform fields of cells are patterned by gradients of morphogens, molecules that define distinct gene expression domains in a concentration-dependent manner. In the early Drosophila embryo, patterning along the anterior-posterior (A-P) axis is determined by the graded distribution of Bicoid (Bcd), a transcription factor that induces target genes (the “gap genes”) by directly binding to their gene promoter [1–3]. Bcd levels peak at the anterior end of the embryo and decrease gradually towards the posterior pole. Its target genes are expressed in an all-or-non fashion, patterning the embryo into distinct domains of gene expression. This threshold-like response is due to cooperative binding of Bcd to gap-gene promoters [4–8] and to mutual repression between gap genes, themselves being transcription regulators [9–17].
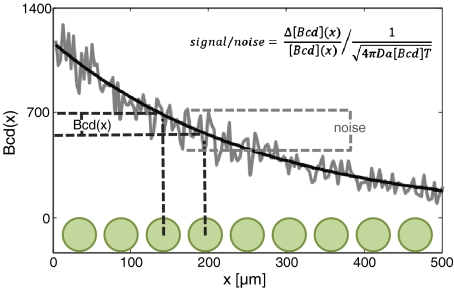
Recent studies characterized the precision by which gap genes are defined, demonstrating remarkable reproducibility between individual embryos [18]. When measured at late stage 14, Hunchback (Hb) is reproducibly expressed at the center of the embryo at single nucleus precision (~8 μm). Achieving this precision requires a highly accurate readout of the concentration of Bcd inside the nucleus. In fact, to properly differentiate two adjacent nuclei, this precision should exceed, or at least be comparable to the difference in the mean Bcd level between these nuclei (Fig. 1).
Fig. 1.
Signal and noise in Bcd morphogen readout. Bcd (solid black) is distributed as a gradient along the A-P axis (x). Syncytial nuclei (green) also reside along the A-P axis and therefore experience distinct Bcd levels. The difference in Bcd levels between adjacent nuclei—ΔBcd(x)—is the basis for differential patterning and thus the signal is defined by ΔBcd(x)/ Bcd(x). The actual levels of Bcd measured by the nuclei (gray) will fluctuate stochastically, due to fluctuations in promoter occupancy. The typical size of these fluctuations is (4πDa[Bcd]T)-0.5 (see text). The signal-to-noise ratio must be greater than 1 in order to achieve a precise readout of the Bcd gradient
Because Bcd is a transcription factor, it binds directly to specific sites on the DNA. Therefore, the translation of this gradient into distinct spatial domains of gap-gene expression is based solely on the occupancy of these sites. As was proposed recently, this poses a strong limitation on the accuracy of the system: as Bcd reaches its cognate site by diffusion, its binding rate is subject to the inherent randomness of the diffusional motion. Promoter occupancy will thus fluctuate stochastically in time, hindering precise Bcd measurement [19, 20].
To estimate the maximal precision by which Bcd nuclear concentration can be measured, previous studies followed the ‘‘perfect instrument’’ approximation, formulated by Berg and Purcell [21], which assumes that all molecules within a volume occupied by the binding sequence are measured continuously, and that the time-interval between subsequent independent measurements is given by the diffusion-controlled rate by which molecules within this volume are replaced. The variance in estimating Bcd concentration is therefore given by (Da[Bcd]T)1/2, where [Bcd] represents the actual Bcd concentration, a is the size of the Bcd binding sites, D is the Bcd diffusion coefficient, and T the measurement time [19].
To determine the minimal time over which Bcd levels need to be measured in order to enable the accurate definition of gap-gene expression domains to within one-cell resolution, the predicted variability in the estimate of Bcd levels should be compared to the signal, namely, the difference in the mean binding frequency between two adjacent nuclei (Fig. 1). Based on the measured Bcd spatial profile and diffusion coefficient, it was estimated that almost 2 h of averaging time is required to reduce noise to a value comparable to the signal. This time, however, is too long considering the relevant developmental timeframe of ~60 min.
Taken together, these estimates imply that the physical limitations on the precision of Bcd readout appear too high to account for the observed precision of expression of its target genes. These limitations are contributed to by two main factors. First, the small DNA target site leads to high fluctuations in the estimate of Bcd concentration. Second, the close proximity of the nuclei leads to small mean differences between Bcd levels in adjacent nuclei.
In a previous study, we showed that the estimate of the Bcd target site might be too conservative [22]. A combination of one-dimensional diffusion (sliding) events of Bcd on the DNA interspersed by three-dimensional diffusion in the cytoplasm might, in effect, extend the target size. This effect could decrease noise, although not sufficiently as to explain the observed accuracy of gap gene expression domains.
Here, we consider the possibility that the signal (difference in Bcd concentration between adjacent nuclei) is larger than previously estimated, thus increasing precision of Bcd morphogen readout. We argue that this will be the case if gap genes begin to be expressed prior to division cycle 14, as most experimental evidence indicates [23–26], due to the pre-steady state of the Bcd gradient and to increased inter-nuclear distance during these stages. At earlier cycles, the number of nuclei is small and they are more widely spread, leading to larger differences in Bcd concentration between neighboring nuclei. At the same time, Bcd levels inside the nuclei are measured to be about the same as that found later, during cycle 14 [27, 28]. Therefore, noise is more easily tolerated during these division cycles. This effect was largely ignored by previous analysis which concluded that early readout does not improve the Bcd interpretation [29]. In contrast, we show that early readout can indeed enable a more accurate definition of gap-gene expression domains, and that the accuracy of this early profile is maintained during subsequent divisions.
Materials and methods
Spatial Gillespie algorithm (SGA)
The simulation is based on the Gillespie algorithm [30, 31]. In order to simulate patterning, a spatial dimension was introduced into the algorithm. The simulation divides space into sub-volumes (similar to a method used by [32, 33]). Every sub-volume contained its own set of reactive species concentrations and corresponding reaction rates. In addition, every diffusive molecule was allowed to transition from its current sub-volume to one of its neighboring sub-volumes. Similar to chemical reactions, diffusion events were given a probability of occurrence that was proportional to their relative rate, compared to all other possible events. In other words, the SGA generalizes the possible events that may occur during every iteration to include not only chemical reactions but also diffusion steps as well.
In reality, microscopic diffusion steps are of the order of molecular size. However, when simulating diffusion, the more one reduces the size of these steps, the higher the computational cost. In the framework of the SGA, it was neither cost-worthy nor necessary to include diffusion steps smaller than sub-volume size. Therefore, the simulation considered only macroscopic diffusion events of passage between sub-volumes. Accordingly, if D is the macroscopic diffusion coefficient, l is the linear size of the one-dimensional sub-volume and N is the number of diffusing molecules in the sub-volume, the rate of diffusion to a neighboring sub-volume is:
 |
1 |
Gradient formation
The SGA-simulated result of gradient formation was compared to the theoretically predicted gradient. A one-dimensional system at steady state was considered, where a diffusive particle is produced at one end (x = 0) and is uniformly degraded, thus described by the equation:
 |
2 |
where D is the one-dimensional diffusion coefficient, τis the degradation time and s0 is the production rate. The solution to (2) is:
 |
3 |
The system was simulated taking s0 85, τ = 10, D = 4 (all in arbitrary units).
Bcd and Hb simulation
The system was simulated as follows. One-dimensional space was divided into 100 linearly arranged sub-volumes. Four reactions were allowed to take place: (1) Bcd binds to the Hb promoter; (2) Bcd unbinds from the Hb promoter; (3) Hb is produced; (4) Hb is degraded. In addition, Hb was allowed to diffuse to any of the neighboring sub-volumes. Bcd distribution was taken as a deterministic steady-state gradient and did not diffuse between sub-volumes. In order to achieve cooperative behavior, the reaction 2 rate constant was dependent upon the number of bound Bcd molecules. The first four molecules unbind at an identical rate; however, the rate of the first molecule to unbind once five molecules occupy the promoter was ten times as low. Production of Hb was possible as long as five Bcd molecules occupy the Hb promoter. Thus, the simulation models five cooperatively binding activators. Table 1 summarizes the different reactions and reaction rates that appear in the simulation.
Table 1.
Reactions, reaction rates, and constants used to simulate the Bcd-Hb system
| Reaction/diffusion | Reaction/diffusion rate | Rate constant | |
|---|---|---|---|
| I | Bcd → BcdP | k1·[Bcd] | k1 = 1 |
| II | BcdP → Bcd | k2(BcdP = 1 − 4) | k2 = 5 |
| k3(BcdP = 5) | k3 = 0.5 | ||
| III |
 → Hb → Hb |
k4 | k4 = 10 |
| IV | Hb → 
|
k5·[Hb] | k5 = 10 − 4 |
| V | 1D Hb diffusion |  |
D = 5 |
The total virtual time that was simulated was 10 min. During the first 5 min, only reactions 1 and 2 where allowed to take place, in order to establish a steady state of bound Bcd distribution. During the remaining (virtual) 5 min, all four reactions took place, in addition to Hb diffusion.
Bcd, Hb and Kr network simulation
The simulation consisted of 12 chemical reactions and two diffusive species. The 12 reactions were: 1) Bcd binds to the Kr promoter; 2) Bcd unbinds from the Kr promoter; 3) Kr is produced; 4) Kr is degraded; 5) Kr binds to the Hb promoter; 6) Kr unbinds from the Hb promoter; 7) Bcd binds to the Hb promoter; 8) Bcd unbinds from the Hb promoter; 9) Hb is produced; 10) Hb is degraded; 11) Hb binds to the Kr promoter; 12) Hb unbinds from the Kr promoter. The two diffusive species were Hb and Kr. Cooperativity is assumed in all DNA-binding events. As in the Bcd-Hb case described above, Hb and Kr were both produced when five Bcd molecules occupied their respective promoters. Production, however, was repressed when five molecules of the repressing species were also bound to the promoter region. Table 2 summarizes all reactions and reaction rates present in the system.
Table 2.
Reactions, reaction rates, and constants used to simulate the Bcd-Hb-Kr system
| Reaction/diffusion | Reaction/diffusion rate | Rate constant | |
|---|---|---|---|
| I | Bcd → BcdPK | k1·[Bcd] | k1 =1 |
| II | BcdPK → Bcd | k3(BcdPK = 1 − 4) | k3 = 0.5 |
| k4(BcdPK = 5) | k4 = 0.05 | ||
| III |
 Kr Kr |
k5 | k5 = 10 |
| IV | Kr 
|
k6·[Kr] | k6 = 10 − 4 |
| V | Kr → KrP | k1·[Kr] | k1 = 1 |
| VI | KrP → Kr | k7(BcdPK = 1 − 4) | k7 = 2 |
| k4(BcdPK = 5) | k4 = 0.05 | ||
| VII | 1D Kr diffusion |  |
D = 0.06 |
| VIII | Bcd → BcdPH | k1·[Bcd] | k1 = 1 |
| IX | BcdPH → Bcd | k2(BcdPH = 1 − 4) | k2 = 25 |
| k4(BcdPH = 5) | k4 = 0.05 | ||
| X |
 Hb Hb |
k5 | k5 = 10 |
| XI | Hb 
|
k6·[Hb] | k6 = 10 − 4 |
| XII | Hb → HbP | k1·[Hb] | k1 = 1 |
| XIII | HbP → Hb | k8(BcdPK = 1 − 4) | k8 = 37 |
| k4(BcdPK = 5) | k4 = 0.05 | ||
| XIV | 1D Hb diffusion |  |
D = 0.06 |
Three cases were simulated, corresponding to low, high, and increasing nuclear density. The first two consisted of 26 and 101 nuclei, along a one-dimensional axis. In the third case, the initial 26 nuclei were first doubled to include 51 nuclei and then again to reach the final 101 nuclei. On event of doubling, new nuclei were placed in between previously existing nuclei, so nuclear dispersion was kept uniform. In all “old” nuclei, at the onset of every new “division cycle”, levels of Hb, Kr, and all promoter occupancies were fixed at their previous values, while “new” nuclei acquired the values of their anteriorly neighboring nucleus. All 12 reactions were restricted to sub-volumes defined as nuclei. Hb and Kr were allowed to diffuse through all “nuclear” sub-volumes. In all cases, a total virtual time of 10 min was simulated.
Results and discussion
Estimating the precision of Bcd readout
We begin by reviewing the formalism used to calculate the precision of Bcd readout. This formalism follows the general approach described by Berg and Purcell [21], and adapted recently to the Bcd system by Gregor et al. [19]. The first thing to consider is the signal level, s, which is the difference in the mean level of Bcd between two adjacent nuclei:
 |
4 |
Here, [Bcd](x) denotes the position-dependent concentration of Bcd along the A-P axis and Δx is the distance between two neighboring nuclei. The Bcd profile was well estimated by an exponential function:
 |
5 |
with λ the length-scale of the exponential decay. Considering the measured values, λ = ~100 μm and the distance between adjacent nuclei at cycle 14, Δx = ~10 μm, the relative Bcd signal is estimated to be s ≈ 10%.
Clearly, the variability (noise) in estimating the Bcd level in any individual nucleus should be lower than 10% to enable reliable distinction between two adjacent nuclei. The minimal level of noise in Bcd measurement can be estimated by considering the variations in promoter occupancy, namely the fraction of time the Bcd-binding site is occupied, given by kon[Bcd]/koff. Since the binding flux is limited by diffusion (kon[Bcd] ≤ 4 πDa[Bcd], where D is the Bcd diffusion coefficient and a the binding site length), the (maximal) mean number of new Bcd molecules that bind to the promoter at time T is given by 4 πDa[Bcd] T, according to the von Smoluchowski equation describing the flux of molecules to an absorbing sphere [34]. Consequently, the minimal noise, n, in estimating this value is [22]:
 |
6 |
With the measured values D = 0.3 μm2/sec, a = 3 nm, [Bcd] (at ~mid-embryo) = 4.8 nM [19] noise will only be reduced to the required 10% following T~30 min averaging, which appears too high considering the typical times available for the process of pattern formation. Note that this time constraint would be even more severe (by a factor of 4π) when using the expression by Gregor et al. [27], who followed the “perfect instrument” analysis by Berg and Purcell [21].
Pre-steady-state decoding can improve the signal-to-noise ratio in Bcd measurement
The analysis above assumes that the Bcd gradient had reached its steady state at the time of measurement and is well described by an exponential profile. As a first approach to examine whether pre-steady state decoding might be beneficial, we examine the signal-to-noise ratio prior to steady state. Clearly, before reaching steady state, Bcd levels at every position are lower, and noise levels are therefore higher. However, at the same time, the shape of the Bcd concentration profile changes, becoming smoother with time. The sharper decay at earlier stages increases the effective signal and in principle, this could compensate for the increase in noise. To examine the balance between these two effects, we calculate rigorously the signal-to-noise ratio at different time points following the initiation of Bcd translation.
As shown by Bergmann et al. [35], the time-dependent pre-steady-state morphogen concentration along the A-P axis is given by:
 |
7 |
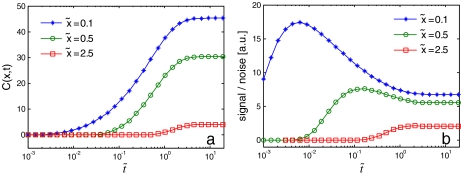
where s0 is the production rate (at the anterior pole), D is the diffusion coefficient of Bcd in the cytoplasm,  is the steady state decay length and τ the Bcd degradation time. Figure 2a depicts the concentration of Bcd, C(x,t), as a function of time, for three values of x. Substituting this profile in (4), we calculate the signal:
 |
8 |
with  and
and  , where we have used the normalized spatial and temporal variables
  and
and  .
.
Fig. 2.
a Bcd concentration (7) at three different points along the A-P axis:  0.1, 0.5 and 2.5 (
 0 is the anterior pole), as a function of normalized time
  . λ and D are set equal to 1, s0 = 100.
  and
and  were normalized according to:
  ,
,  . b Signal-to-noise ratio (Eq. (10), arbitrary units; (a.u.)), as a function of normalized time
  - for the same three positions as in a. High ratio values correspond to higher levels of precision. Both plots start from pre-steady-state and reach steady state (0
  20)
20)
We next compare this signal to stochastic noise in Bcd measurement:
 |
9 |
which, after using (7), can be reduced to:
 |
10 |
We note that this representation of signal/noise is not an exact description, as the expression for the noise contains additional parameters (6) that where factored out. Nevertheless, the expression in (10) provides a qualitative description of the behavior of the signal-to-noise ratio as a function of space and time.
Evidently, as seen in Fig. 2b, the signal-to-noise ratio reaches a maximum value at some finite time topt(x). This optimal time varies according to the position on the A-P axis. We conclude that for any given position along the A-P axis, optimal signal-to-noise ratio is obtained prior to reaching a steady state, suggesting that pre-steady-state decoding can improve the accuracy of Bcd measurements, similar to the conclusion reached by recent studies [35, 36].
Early decoding entails a larger signal due to larger spacing between neighboring nuclei
An additional, and probably more important, contribution of early decoding is the increased spacing between adjacent nuclei (larger Δx). Indeed, as all nuclei reach the periphery of the embryo at the end of cycle 9 while the embryo does not increase in size, every subsequent division cycle will increase nuclear density. While larger spacing during early stages will clearly improve precision in initiating positioning of the gap genes, a key question is whether this initial pattern will be stabilized during subsequent divisions.
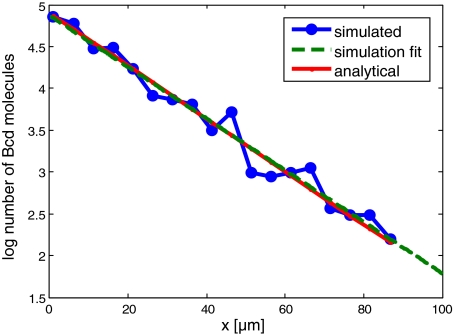
We examined this issue using stochastic simulations based on the Gillespie algorithm [30, 31]. While this algorithm was initially proposed for simulating a well-mixed reaction volume, we extended it to the case of spatial-dependent patterning (see Materials and methods). For simplicity, all simulations assume one-dimensional geometry. An example for the use of this extended Spatial Gillespie Algorithm (SGA) simulating the formation of the Bcd gradient is shown in Fig. 3.
Fig. 3.
Formation of a gradient by the SGA model. The SGA was tested using the case of gradient formation in a 1D system. The gradient forms via anterior production, diffusion, and uniform degradation. Natural log of Bcd molecules is plotted for the anterior region (0<x<100; total egg length is 500 μm). Posterior regions were omitted due to low molecule copy numbers. A comparison of the results of the SGA simulation with analytical prediction (Materials and methods) is shown. The simulation result was linearly fit
Stochastic simulation of a simplified Bcd-Hb system with a fixed number of nuclei
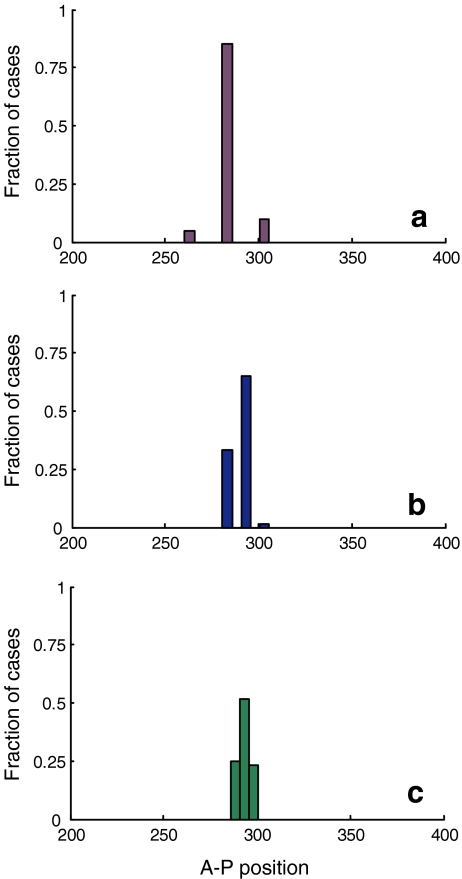
We first consider a single Bcd target gene, Hb, assume a fixed Bcd gradient, and simulate induction of Hb. To include cooperative effects, we assumed that Bcd can bind to the Hb promoter at five different sites and that occupied sites increase the probability of additional binding events. Hb was produced only when all sites were fully occupied. We measured the variability in Bcd decoding by repeating the simulations with different realizations of the same stochastic parameters. We then measured the location of the resulting Hb expression boundary, defined as the anterior-most nucleus in which Hb is reduced to half its maximum. These simulations were performed for different densities of nuclei. The Bcd gradient was not changed between the simulations, following the observation that the intracellular level of Bcd remains constant between division cycles 9 and 14. The results are summarized in Fig. 4.
Fig. 4.
Distribution of the Hb expression boundary location. Three different nuclear densities were simulated: low (a), medium (b) and high (c) consisting of 26, 51, and 101 nuclei, respectively. Each nuclear density simulation was repeated 60 times, from which distributions were extracted. Low nuclear density decoding is more precise (85% of the cases produce same boundary location) than high nuclear density decoding (51.6% reproducibility), but accounts for larger errors. Medium nuclear density is intermediate with respect to both of these criteria
Two effects were observed. First, as expected, the embryo-to-embryo variability in Hb boundary position increases with increasing number (density) of nuclei. For the low-density case (corresponding to division cycle 9 embryos), 85% of the simulated embryos positioned the Hb boundary at the same precise position. Higher densities (corresponding to cycles 12 and 14) reduced this number to only 65% and 51.6%, respectively. Second, also as expected, the actual variation in position of the Hb boundary between embryos (measured in microns) was larger for low-density nuclei. Clearly, as in most cases the imprecision in boundary position was restricted to only one nucleus, and the deviation scaled with the inter-nucleus distance.
Stochastic simulation of a simplified Bcd-Hb-Kr system with increasing number of nuclei
The key question is how the described variability changes during nuclear proliferation. We hypothesized that the high percentage of embryos achieving precise boundary definition in early stages is maintained during the subsequent divisions. We further reasoned that this will be made possible by the interaction between gap genes themselves, which will introduce memory into the system and facilitate the initial definition of the gap-gene expression domains.
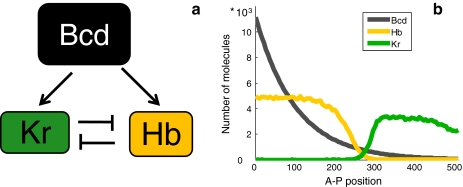
To examine these hypotheses, we considered the two gap genes Hb and Krüppel (Kr). In our simulation, Bcd induces Kr at a higher concentration than that which induces Hb [37–39]. We captured this characteristic by assigning a lower ‘on’ rate of Bcd to the Kr promoter compared to the Hb promoter, while maintaining the same cooperative effects. These two gap genes are further subject to mutual repression, leading to their expression in two distinct domains [12, 13, 15, 17] (Fig. 5a). This feature was actualized by allowing Hb (Kr) to bind to the Kr (Hb) promoter and assuming that this binding prevents expression.
Fig. 5.
The Bcd, Hb, and Kr network. a Bcd, Hb, and Kr network interactions that were simulated. Bcd activates transcription of Hb and Kr. Hb and Kr mutually repress each other. b Expression pattern of the Bcd gradient and Hb and Kr regions following the network design described in Fig. 5a. Activation of Kr by Bcd is greater than Hb activation, while Kr repression by Hb is stronger than the reciprocal repression of Hb by Kr
We first simulated the system at fixed low and high nuclear densities (26 and 101 nuclei, analogous to cycles 9 and 14, respectively). Next, we considered a gradual increase in nuclear density: starting from the initial value of 26 nuclei we doubled the density to 51 nuclei and then again to a final nuclear population of 101 nuclei. Upon each doubling event, new nuclei were positioned in between existing nuclei. All three cases were simulated for the same virtual time of 10 min, thereby maintaining equal averaging time.
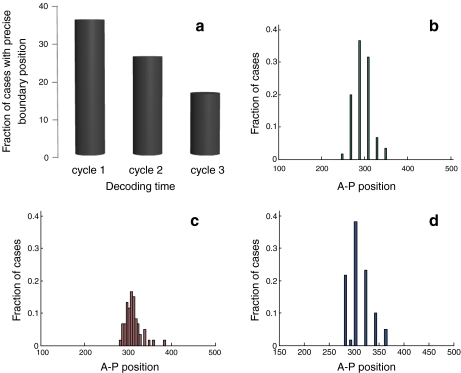
The stochastic simulation produced the correct pattern of expression: Hb and Kr were expressed in distinct domains, separated by a sharp boundary, with Kr being more posterior (Fig. 5b). As before, we measured the embryo-to-embryo variability by repeating the simulations for different realizations of the same stochastic process. The results are summarized in Fig. 6. Evidently, increasing the nuclear density in time reproduces the results of the low-nuclear-density case. While the reproducibility in boundary location was 36.66% and 38.33% when nuclear density was low and when increased gradually, respectively, this reproducibility was reduced to 16.66% when patterning was initiated at high nuclear density. This suggests that indeed, precision in early decoding of the Bcd gradient can be preserved in later stages by the network of interactions among the gap genes.
Fig. 6.
The Hb-Kr expression boundary. a Fraction of cases (out of 60 repeats) that resulted in precise boundary definition, for three different nuclear densities corresponding to three decoding timings, similar to those described for the Bcd-Hb system. Cycle 1 is the earliest, consisting of 26 total nuclei, cycle 2 is intermediate in time and consists of 51 nuclei, and cycle 3 is the latest, consisting of 101 nuclei. As in the Bcd-Hb system simulation, the earlier the decoding takes place, the more reproducible the boundary definition is. b–d Distribution of location of the Hb-Kr expression boundary for three different cases of decoding: low nuclear density (b), high nuclear density (c) and increasing nuclear density (d) decoding. Each nuclear density simulation was repeated 60 times, from which distributions were extracted. The low nuclear density and increasing nuclear density cases are very similar in terms of precise boundary location reproducibility (36.66% and 38.33% of the cases, respectively), while the high nuclear density case is considerably less reproducible (16.66% of the cases)
In addition to location, we also analyzed the sharpness of the Hb-Kr boundary by measuring the level of decrease in Kr molecules between two adjacent nuclei at the boundary. Low nuclear density and increasing nuclear density cases resulted in a mean difference of 1,850 and 1,700 Kr molecules, respectively, while the high-density case gave rise to a difference of just 574 molecules, suggesting that early decoding contributes to the quality of the boundary that is formed, in addition to its contribution to precision in defining boundary location.
Conclusions
Decoding of the Bcd morphogen gradient in the Drosophila embryo is performed with high fidelity. Previous estimates concluded that this precision is difficult to account for, considering inevitable noise in the estimation of Bcd concentration. Here we argue that this apparent inconsistency might be resolved, at least partially, if Bcd is decoded at early stages, prior to nuclear division cycle 14 when gap gene expression domains were typically measured. The reason for this improved accuracy is not a better estimate of Bcd levels, but rather the larger distance between the nuclei, which makes them more distinct, therefore enabling better tolerance of noise levels. Refinement of the initial crude pattern established in these early stages may proceed while maintaining precision, due to repressing interactions between the gap genes.
In this study, we modeled the formation of a model boundary, between Hb and Kr stripes, using stochastic simulation. We have shown that a dense array of nuclei may still assume a precisely reproduced pattern by utilizing the aforementioned mechanism. Moreover, we have shown that early gradient decoding more accurately defines the regions of the resulting pattern, compared to late decoding, by giving rise to sharper boundaries between expression stripes.
Acknowledgements
This work was supported by the European Research Council, the Israel Science Foundation, and by the Helen and Martin Kimmel Award for Innovative Investigation.
Contributor Information
Zvi Tamari, Email: zvi.tamari@weizmann.ac.il.
Naama Barkai, Email: Naama.Barkai@weizmann.ac.il.
References
- 1.Driever W, Nusslein-Volhard C. The bicoid protein determines position in the Drosophila embryo in a concentration-dependent manner. Cell. 1988;54:95–104. doi: 10.1016/0092-8674(88)90183-3. [DOI] [PubMed] [Google Scholar]
- 2.Driever W, Thoma G, Nusslein-Volhard C.Determination of spatial domains of zygotic gene expression in the Drosophila embryo by the affinity of binding sites for the bicoid morphogen Nature 1989340363–367.1989Natur.340..363D 10.1038/340363a0 [DOI] [PubMed] [Google Scholar]
- 3.Struhl G, Struhl K, Macdonald PM. The gradient morphogen bicoid is a concentration-dependent transcriptional activator. Cell. 1989;57:1259–1273. doi: 10.1016/0092-8674(89)90062-7. [DOI] [PubMed] [Google Scholar]
- 4.Burz DS, Rivera-Pomar R, Jackle H, Hanes SD. Cooperative DNA-binding by Bicoid provides a mechanism for threshold-dependent gene activation in the Drosophila embryo. EMBO J. 1998;17:5998–6009. doi: 10.1093/emboj/17.20.5998. [DOI] [PMC free article] [PubMed] [Google Scholar]
- 5.Lebrecht D, Foehr M, Smith E, Lopes FJ, Vanario-Alonso CE, Reinitz J, Burz DS, Hanes SD.Bicoid cooperative DNA binding is critical for embryonic patterning in Drosophila Proc. Natl. Acad. Sci. U.S.A. 200510213176–13181.2005PNAS..10213176L 10.1073/pnas.0506462102 [DOI] [PMC free article] [PubMed] [Google Scholar]
- 6.Burz DS, Hanes SD. Isolation of mutations that disrupt cooperative DNA binding by the Drosophila bicoid protein. J. Mol. Biol. 2001;305:219–230. doi: 10.1006/jmbi.2000.4287. [DOI] [PubMed] [Google Scholar]
- 7.Ma X, Yuan D, Diepold K, Scarborough T, Ma J. The Drosophila morphogenetic protein Bicoid binds DNA cooperatively. Development. 1996;122:1195–1206. doi: 10.1242/dev.122.4.1195. [DOI] [PubMed] [Google Scholar]
- 8.Yuan D, Ma X, Ma J. Sequences outside the homeodomain of bicoid are required for protein–protein interaction. J. Biol. Chem. 1996;271:21660–21665. doi: 10.1074/jbc.271.35.21660. [DOI] [PubMed] [Google Scholar]
- 9.Capovilla M, Eldon ED, Pirrotta V. The giant gene of Drosophila encodes a b-ZIP DNA-binding protein that regulates the expression of other segmentation gap genes. Development. 1992;114:99–112. doi: 10.1242/dev.114.1.99. [DOI] [PubMed] [Google Scholar]
- 10.Eldon ED, Pirrotta V. Interactions of the Drosophila gap gene giant with maternal and zygotic pattern-forming genes. Development. 1991;111:367–378. doi: 10.1242/dev.111.2.367. [DOI] [PubMed] [Google Scholar]
- 11.Gaul U, Jackle H. Analysis of maternal effect mutant combinations elucidates regulation and function of the overlap of hunchback and Krüppel gene expression in the Drosophila blastoderm embryo. Development. 1989;107:651–662. doi: 10.1242/dev.107.3.651. [DOI] [PubMed] [Google Scholar]
- 12.Hoch M, Gerwin N, Taubert H, Jackle H.Competition for overlapping sites in the regulatory region of the Drosophila gene Krüppel Science 199225694–97.1992Sci...256...94H 10.1126/science.1348871 [DOI] [PubMed] [Google Scholar]
- 13.Hoch M, Schroder C, Seifert E, Jackle H. Cis-acting control elements for Krüppel expression in the Drosophila embryo. EMBO J. 1990;9:2587–2595. doi: 10.1002/j.1460-2075.1990.tb07440.x. [DOI] [PMC free article] [PubMed] [Google Scholar]
- 14.Hulskamp M, Pfeifle C, Tautz D.A morphogenetic gradient of hunchback protein organizes the expression of the gap genes Krüppel and knirps in the early Drosophila embryo Nature 1990346577–580.1990Natur.346..577H 10.1038/346577a0 [DOI] [PubMed] [Google Scholar]
- 15.Jackle H, Tautz D, Schuh R, Seifert E, Lehmann R.Cross-regulatory interactions among the gap genes of Drosophila Nature 1986324668–670.1986Natur.324..668J 10.1038/324668a0 [DOI] [Google Scholar]
- 16.Kraut R, Levine M. Mutually repressive interactions between the gap genes giant and Krüppel define middle body regions of the Drosophila embryo. Development. 1991;111:611–621. doi: 10.1242/dev.111.2.611. [DOI] [PubMed] [Google Scholar]
- 17.Treisman J, Desplan C.The products of the Drosophila gap genes hunchback and Krüppel bind to the hunchback promoters Nature 1989341335–337.1989Natur.341..335T 10.1038/341335a0 [DOI] [PubMed] [Google Scholar]
- 18.Houchmandzadeh B, Wieschaus E, Leibler S.Establishment of developmental precision and proportions in the early Drosophila embryo Nature 2002415798–802.2002Natur.415..798H 10.1038/415798a [DOI] [PubMed] [Google Scholar]
- 19.Gregor T, Tank DW, Wieschaus EF, Bialek W. Probing the limits to positional information. Cell. 2007;130:153–164. doi: 10.1016/j.cell.2007.05.025. [DOI] [PMC free article] [PubMed] [Google Scholar]
- 20.Tostevin F, Wolde PR, Howard M.Fundamental limits to position determination by concentration gradients PLoS Comput Biol 20073782007PLSCB...3...78T 10.1371/journal.pcbi.0030078 [DOI] [PMC free article] [PubMed] [Google Scholar]
- 21.Berg HC, Purcell EM.Physics of chemoreception Biophys. J. 197720193–219.1977BpJ....20..193B 10.1016/S0006-3495(77)85544-6 [DOI] [PMC free article] [PubMed] [Google Scholar]
- 22.Tamari Z, Barkai N, Fouxon I. Physical aspects of precision in genetic regulation. J. Biol. Phys. 2010;37:227–238. doi: 10.1007/s10867-010-9208-2. [DOI] [PMC free article] [PubMed] [Google Scholar]
- 23.Knipple DC, Seifert E, Rosenberg UB, Preiss A, Jackle H.Spatial and temporal patterns of Krüppel gene expression in early Drosophila embryos Nature 198531740–44.1985Natur.317...40K 10.1038/317040a0 [DOI] [PubMed] [Google Scholar]
- 24.Porcher A, Abu-Arish A, Huart S, Roelens B, Fradin C, Dostatni N. The time to measure positional information: maternal hunchback is required for the synchrony of the bicoid transcriptional response at the onset of zygotic transcription. Development. 2010;137:2795–2804. doi: 10.1242/dev.051300. [DOI] [PubMed] [Google Scholar]
- 25.Pritchard DK, Schubiger G. Activation of transcription in Drosophila embryos is a gradual process mediated by the nucleocytoplasmic ratio. Genes Dev. 1996;10:1131–1142. doi: 10.1101/gad.10.9.1131. [DOI] [PubMed] [Google Scholar]
- 26.Jaeger J, Sharp DH, Reinitz J. Known maternal gradients are not sufficient for the establishment of gap domains in Drosophila melanogaster. Mech. Dev. 2007;124:108–128. doi: 10.1016/j.mod.2006.11.001. [DOI] [PMC free article] [PubMed] [Google Scholar]
- 27.Gregor T, Wieschaus EF, McGregor AP, Bialek W, Tank DW. Stability and nuclear dynamics of the bicoid morphogen gradient. Cell. 2007;130:141–152. doi: 10.1016/j.cell.2007.05.026. [DOI] [PMC free article] [PubMed] [Google Scholar]
- 28.Bergmann S, Tamari Z, Schejter E, Shilo BZ, Barkai N. Re-examining the stability of the bicoid morphogen gradient. Cell. 2008;132:15–17. doi: 10.1016/j.cell.2007.12.022. [DOI] [PubMed] [Google Scholar]
- 29.Saunders T, Howard M. When it pays to rush: interpreting morphogen gradients prior to steady-state. Phys. Biol. 2009;6:46020. doi: 10.1088/1478-3975/6/4/046020. [DOI] [PubMed] [Google Scholar]
- 30.Gillespie DT.A general method for numerically simulating the time evolution of coupled chemical reactions J. Comp. Phys. 197622403–434.5033701976JCoPh..22..403G 10.1016/0021-9991(76)90041-3 [DOI] [Google Scholar]
- 31.Gillespie DT. Exact stochastic simulation of coupled chemical reactions. J. Phys. Chem. 1977;71:2340–2361. doi: 10.1021/j100540a008. [DOI] [Google Scholar]
- 32.Doncic, A., Elf, J.: Simulating Intracellular Stochastic Reaction-Diffusion Systems. Uppsala University UPTEC X:02 043 (2002)
- 33.Hattne, J., Elf, J.: The Algorithms and Implementation of MesoRD. Uppsala University, Department of Information Technology, Scientific Computing (2006)
- 34.Smoluchowski M.Drei vortrage über diffusion, brownsche bewegung und koagulation von kolloidteilchen Z. Phys. 191617557–585.1916ZPhy...17..557S [Google Scholar]
- 35.Bergmann S, Sandler O, Sberro H, Shnider S, Schejter E, Shilo BZ, Barkai N. Pre-steady-state decoding of the bicoid morphogen gradient. PLoS. Biol. 2007;5:46. doi: 10.1371/journal.pbio.0050046. [DOI] [PMC free article] [PubMed] [Google Scholar]
- 36.Lachapelle AM, Bergmann S. Precision and scaling in morphogen gradient read-out. Mol. Syst. Biol. 2010;6:351. doi: 10.1038/msb.2010.7. [DOI] [PMC free article] [PubMed] [Google Scholar]
- 37.Driever W, Nusslein-Volhard C.The bicoid protein is a positive regulator of hunchback transcription in the early Drosophila embryo Nature 1989337138–143.1989Natur.337..138D 10.1038/337138a0 [DOI] [PubMed] [Google Scholar]
- 38.Hoch M, Seifert E, Jackle H. Gene expression mediated by cis-acting sequences of the Krüppel gene in response to the Drosophila morphogens bicoid and hunchback. EMBO J. 1991;10:2267–2278. doi: 10.1002/j.1460-2075.1991.tb07763.x. [DOI] [PMC free article] [PubMed] [Google Scholar]
- 39.Simpson-Brose M, Treisman J, Desplan C. Synergy between the hunchback and bicoid morphogens is required for anterior patterning in Drosophila. Cell. 1994;78:855–865. doi: 10.1016/S0092-8674(94)90622-X. [DOI] [PubMed] [Google Scholar]


