Abstract
We conducted a pharmacokinetic (PK) study of mitoxantrone (Novantrone®), a clinically well-established anticancer agent, in mice and developed a mechanism-based PBPK (physiologically based pharmacokinetic) model to describe its disposition. Mitoxantrone concentrations in plasma and six organs (lung, heart, liver, kidney, spleen, and brain) were determined after a 5 mg/kg i.v. dose. We evaluated three different PBPK models in order to characterize our experimental data: model 1 containing Kp values, model 2 incorporating a deep binding compartment, and model 3 incorporating binding of mitoxantrone to DNA and protein. Among the three models, only model 3 with DNA and protein binding captured all the experimental data well. The estimated binding affinity for DNA (KDNA) and protein (Kmacro) were 0.0013 and 1.44 μM, respectively. Predicted plasma and tissue AUC values differed from observed values by <19 %, except for heart (60 %). Model 3 was further used to simulate plasma mitoxantrone concentrations in humans for a 12-mg/m2 dose, using human physiological parameters. The simulated results generally agreed with the observed time course of mitoxantrone plasma concentrations in patients after a standard dose of 12 mg/m2. In summary, we reported for the first time a mechanism-based PBPK model of mitoxantrone incorporating macromolecule binding which may have clinical applicability in optimizing clinical therapy. Since mitoxantrone is a substrate of the efflux transporters ABCG2 and ABCB1, the incorporation of efflux transporters may also be necessary to characterize the data obtained in low-dose studies.
KEY WORDS: DNA binding, human scale-up, mitoxantrone, physiologically based pharmacokinetic model
INTRODUCTION
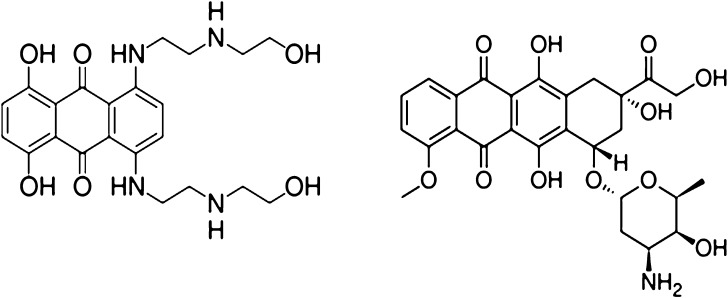
Mitoxantrone (Novantrone®), a synthetic anthracenedione derivative, is a clinically well-established anticancer agent with a wide spectrum of antitumor activities (1). Mitoxantrone has shown high efficacy in breast cancer, acute leukemia, and non-Hodgkin's lymphoma (2). Marginal activity of mitoxantrone was observed in non-small cell lung cancer and cancer of the neck, liver, prostate, and bladder (3, 4). In addition to its role as an anticancer agent, mitoxantrone also shows efficacy in the treatment of secondary progressive multiple sclerosis (5). The main dose-limiting toxicity of mitoxantrone is myelosuppression. Mitoxantrone was originally synthesized and developed as a doxorubicin analogue with the aim of finding a cytotoxic agent with decreased cardiotoxicity compared with doxorubicin. Without the amino-sugar moiety at C9 on the parent molecule (Fig. 1), mitoxantrone shows comparable anticancer activity but considerably lower cardiotoxicity than doxorubicin. Moreover, several other toxicities such as gastrointestinal toxicity and stomatitis, although occurring frequently with doxorubicin, are uncommon with mitoxantrone.
Fig. 1.
Chemical structures of mitoxantrone (left) and doxorubicin (right)
The most studied potential mechanism for the cytotoxicity of mitoxantrone is through intercalation of the planar electron-rich chromophore in the DNA, resulting in DNA crosslinking and strand breaks and the inhibition of DNA replication, DNA-dependent RNA, and protein synthesis (6). It has also been reported that mitoxantrone can inhibit topoisomerase II and consequently interferes with DNA repair (7, 8). In addition to intercalation, electrostatic interaction of the side chains containing a basic amino group with the phosphate moiety of DNA has also been considered as one possible mechanism of action (9).
The pharmacokinetics of mitoxantrone has been evaluated in many species. In both animal and human studies, mitoxantrone disappears rapidly from plasma with extensive tissue distribution (2, 6, 10, 11). The reported half-life for mitoxantrone is controversial, with the values varying from 2.9 to 215 h (12). Mitoxantrone only undergoes moderate phase I metabolism (20–35 %), with monocarboxylic and dicarboxylic acids of mitoxantrone identified as the major metabolite forms (13). Although mitoxantrone and its metabolites are eliminated by both biliary and renal excretion, the former route is the predominant excretion pathway (13, 14). Renal clearance only accounts for 10~30 % of the total clearance in different species (6). Similar to many other anticancer agents, ATP-binding cassette (ABC) efflux transporters are also involved in the transport of mitoxantrone. Many investigations have shown that mitoxantrone is a substrate of breast cancer resistance protein (BCRP, ABCG2) with high affinity and a substrate of P-glycoprotein (P-gp, ABCB1) with moderate affinity (15).
Physiologically based pharmacokinetic (PBPK) modeling is a useful tool for evaluating and predicting the disposition of a compound of interest in various organs or tissues. A PBPK model is often considered as a mathematical representation of a biological system because it incorporates several independent physiological and biological parameters, such as tissue volume and organ blood flow (16). Based on the fact that the concentrations in tissues may be more relevant than plasma levels for the pharmacological activities of many drugs, one advantage of PBPK models is that the drug concentrations in different tissues can be predicted and more importantly, drug concentrations in various human organs or tissues can be obtained through extrapolation. PBPK is especially useful for anticancer agents because they usually have extensive tissue distribution and the tissue concentrations are highly related to both their cytotoxic effects and toxicities.
PBPK models have been developed for many anticancer agents, including doxorubicin (17), docetaxel (18), methotrexate (19–21), cisplatin (22), and topotecan (23). However, currently there are no PBPK models for mitoxantrone available in the literature. In the present study, we proposed several different PBPK models in order to capture the mitoxantrone concentration-versus-time data in plasma and six different tissues in mice. Three models were evaluated: model 1 incorporates Kp values, model 2 incorporates a deep compartment, and model 3, which is the most mechanism-based model, incorporates mitoxantrone DNA and macromolecule binding within tissues. Among the PBPK models that were evaluated, the most appropriate one, based on goodness-of-fit criteria, was used to simulate the plasma concentration–time course of mitoxantrone in humans.
MATERIALS AND METHODS
Chemicals
Mitoxantrone, ascorbic acid, sulfosalicylic acid, and triethylamine were purchased from Sigma (St. Louis, MO). Ametantrone, the internal standard, was a generous gift from the Drug Synthesis and Chemistry Branch, Development and Therapeutics Program, Division of Cancer Treatment and Diagnosis, National Cancer Institute (Bethesda, MD, USA). Citric acid was purchased from Fisher Scientific (Hampton, NJ). Phosphoric acid was obtained from EM Science (Gibbstown, NJ). HPLC-grade acetonitrile and sodium phosphate were obtained from J.T. Baker (Phillipsburg, NJ).
Mitoxantrone PK Studies in Mice
Male ND4 Swiss Webster mice (Harlan Labs, Indianapolis, IN) weighing 24–32 g were housed in a temperature-controlled environment with a 12-h light/12-h dark cycle and received a standard diet and water ad libitum. Mice were randomized according to body weight and administered an IV dose of 5 mg/kg mitoxantrone by penile vein injection. Mitoxantrone was dissolved in saline at a concentration of 1.25 mg/ml and delivered as 4 μl/g body weight. At each time point (5, 15, and 30 min, and 1, 2, 4, 8, and 48 h), blood samples were taken by aortic puncture and centrifuged shortly after collection to separate plasma. To prevent oxidative degradation, 10 μl of 100 mg/ml ascorbic acid in 0.1 M citric buffer was added to each 200 μl of plasma sample. Heart, lung, liver, kidneys, spleen, and brain were removed immediately after blood collection. All samples were stored at −80°C until the time of HPLC analysis. Three to four mice were used for each time point in each group.
The animal study was approved by the Institutional Animal Care and Use Committee, University at Buffalo.
Mitoxantrone HPLC Analysis
The concentrations of mitoxantrone in the plasma and tissue samples from the mitoxantrone PK study were analyzed using a validated HPLC method which we recently published (24). Liver, heart, kidneys, lung, spleen, and brain samples were homogenized in 100 mg/ml ascorbic acid in 0.1 M citric buffer (pH 3.0). In brief, 5 μl or 10 μl of 5 μg/ml ametantrone (I.S.) was added to 100 μl of plasma sample or 200 μl tissue homogenates, to a final concentration of 250 ng/ml. An equal volume of sulfosalicylic acid and acetonitrile (25:75, v/v) was then added to precipitate proteins. After vigorous vortexing, the samples were centrifuged for 15 min at 16,000×g at 4°C. The supernatant (120 μl) was injected into the HPLC system. The HPLC analysis was carried out on a Nucleosil C18 (250 × 4 mm, I.D.) column (Macherey-Nagel, Easton, WA). The isocratic mobile phase consisted of 19:81 (v/v) acetonitrile: sodium phosphate (pH 2.3 with 0.1 % TEA), at a flow rate of 1.0 ml/min. The system consisted of a Waters 1,525 pump, 717 plus autosampler, a 2,847 UV detector, and a Waters Breeze workstation. Mitoxantrone and the I.S. were detected at 610 nm with a retention time of 6.4 and 4.2 min, respectively. The standard curve was linear over the concentration range of 5–1,000 ng/ml in plasma and 12.5–2,500 ng/ml in tissue homogenates. The lower limit of quantification of mitoxantrone was 5 ng/ml in plasma and 12.5 ng/ml in tissue homogenates.
Mitoxantrone PBPK Model Development
Global Model
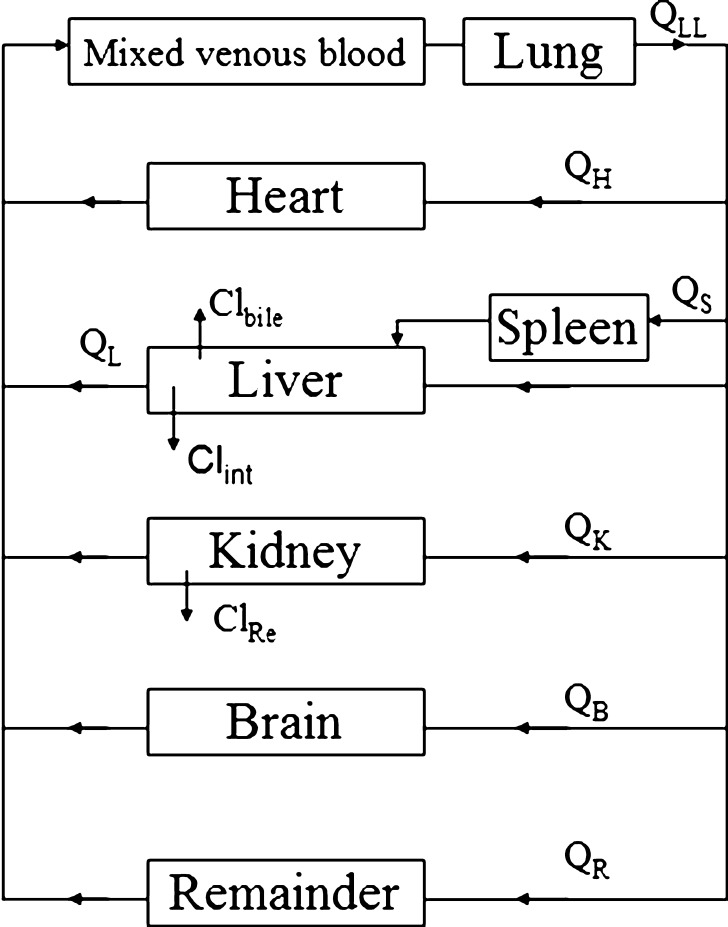
The global (whole body) PBPK model was developed with mitoxantrone data from six organs, namely lung, heart, spleen, liver, kidney, and brain (Fig. 2). Mitoxantrone concentrations in other organs which were not determined, such as muscle, fat, bone, intestine, and skin, were included in the “remainder” compartment. The PBPK model fittings for mitoxantrone PK and tissue distribution in mice were performed in ADAPT 5 (version 5, Biomedical Simulations Resource, Los Angeles, CA). All physiologic parameters used in current study for the three models that were evaluated are listed in Table I. The values of the organ weights are the actual organ weights measured directly in the current study. Since our mice weighted on average 27.4 g, organ blood flow (Qi) was scaled from literature data for a 25 g mouse (25) using the following equation:
 |
1 |
where BW1 is the standard body weight of mice (25 g) and BW2 is the actual mean body weight of mice used in current study (27.4 g).
Fig. 2.
Schematic representation of a physiologically based pharmacokinetic model for mitoxantrone in the mouse
Table I.
Physiological and Kinetic Parameters for Modeling Mitoxantrone PK in Mice
| Physiological and kinetic parameters used in model 1 (parameters were fixed in modeling mitoxantrone PK in mice) | Physiological and kinetic parameters used in model 2 (parameters were fixed in modeling mitoxantrone PK in mice) | Physiological and kinetic parameters used in model 3 (parameters were fixed in modeling mitoxantrone PK in mice) | The calculated Kp values of mitoxantrone in different tissues | ||||||||||||
|---|---|---|---|---|---|---|---|---|---|---|---|---|---|---|---|
| Organ | Blood flow rate (ml/min)a | Organ volume (ml)b | Extracellular volume (ml)c | Cellular volume (ml)c | Blood flow rate (ml/min)a | Organ volume (ml)b | Extracellular volume (ml)c | Cellular volume (ml)c | Blood flow rate (ml/min)a | Organ volume (ml)b | Extracellular volume (ml)c | Cellular volume (ml)c | DNA concentration [T DNA] (μM) d | Protein concentration [T macro] (μM) e | Kp f |
| Plasma | 9 | 1.2 | – | – | 9 | 1.2 | – | – | 9 | 1.2 | – | – | – | ||
| Lung | 9 | 0.136 | 0.045 | 0.091 | 9 | 0.136 | 0.045 | 0.091 | 9 | 0.136 | 0.045 | 0.091 | N/A | N/A | 526 |
| Heart | 0.5 | 0.144 | 0.0475 | 0.0965 | 0.5 | 0.144 | 0.0475 | 0.0965 | 0.5 | 0.144 | 0.0475 | 0.0965 | 20.6 | 43.8 | 441 |
| Spleen | 0.05 | 0.06 | 0.0198 | 0.0402 | 0.05 | 0.06 | 0.0198 | 0.0402 | 0.05 | 0.06 | 0.0198 | 0.0402 | N/A | N/A | 889 |
| Liver | 1.21 | 1.18 | 0.3894 | 0.7906 | 1.21 | 1.18 | 0.3894 | 0.7906 | 1.21 | 1.18 | 0.3894 | 0.7906 | 26.0 | N/A | 224 |
| Kidney | 1.99 | 0.489 | 0.1614 | 0.3276 | 1.99 | 0.489 | 0.1614 | 0.3276 | 1.99 | 0.489 | 0.1614 | 0.3276 | 50.2 | 52.3 | 1259 |
| Brain | 1 | 0.36 | 0.119 | 0.241 | 1 | 0.36 | 0.119 | 0.241 | 1 | 0.36 | 0.119 | 0.241 | N/A | N/A | 0.373 |
| Other | 4.32 | 25.03 | 8.26 | 16.77 | 4.32 | 25.03 | 8.26 | 16.77 | 4.32 | 25.03 | 8.26 | 16.77 | N/A | N/A | N/A |
aThe blood flow rate in each tissue was calculated based on literature data and actual body and organ weight of mice used in the current study
bThe organ volume in each tissue was calculated based on literature data and actual body and organ weight of mice used in the current study
cExtracellular and cellular volume of each organ were calculated based on literature data (25). For models 1 and 3, only organs with low permeability (i.e., the remainder compartment) require the intracellular and extracellular values
dDNA content in heart, liver, and kidney were taken from Gustafson et al. (17)
eProtein content (T macro) in heart and kidney were fixed using literature reported cardiolipin values (27)
fKp values listed here were obtained by calculation (Eq. 5)
Local Model
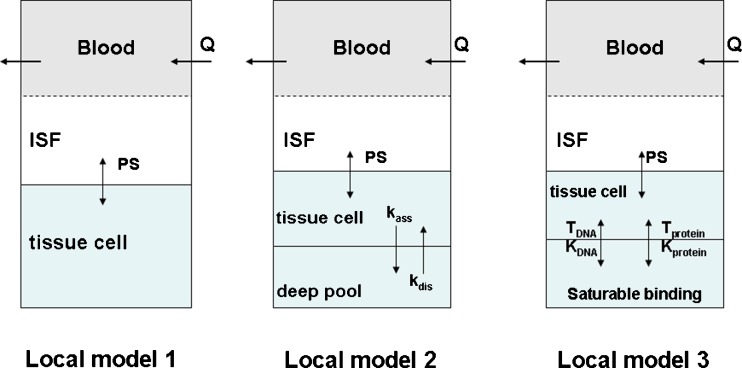
Although the structure of the global model is the same, we proposed three different local models for mitoxantrone in each organ (Fig. 3).
Fig. 3.
Three proposed local models for mitoxantrone disposition in each organ. Model 1: classical model with Kp values; model 2: model with a deep tissue compartment; model 3: semi-mechanistic model incorporating DNA and protein binding
Model 1
In this local model, a well-stirred model was used for perfusion-limited organs (heart, liver, kidney, brain, spleen, and lung). A model incorporating the permeability surface area product was included for those organs with low permeability (the remainder compartment). Equations for well-stirred non-eliminating organs were:
 |
2 |
Equations for permeability-limited organs were:
 |
3 |
 |
4 |
where abbreviations represent mitoxantrone concentrations in tissue (Ct) and plasma (Cp), tissue blood flow (Qt), tissue volume (Vt), tissue to plasma partition coefficient (Kpt), permeability surface area product (PSt), unbound fraction of mitoxantrone in plasma (fu), tissue concentration in the interstitial fluid (Ct,ISF) and tissue cells (Ct,c), extracellular volume (Vt,ISF), and intracellular volume (Vt,c).
The partition coefficient (Kp) for each tissue was calculated by following equation:
 |
5 |
where AUC is the area under the concentration–time curves from 0 to 48 h. AUC values were determined by the trapezoidal rule.
Model 2
Since mitoxantrone was extensively distributed to and only slowly eliminated from tissues, we proposed a model with a deep binding compartment. In this model, each organ was first separated as extracellular and intracellular space. The intracellular compartment was further divided into two compartments and the intracellular interaction occurred by slow exchange of cell-internalized mitoxantrone with a deep binding compartment; these processes were characterized by first-order rate constants (kass and kdis; Fig. 3).
Equations for model 2 which include a deep tissue compartment:
 |
6 |
 |
7 |
 |
8 |
In the above equations, ISF, c1, and c2 represent the interstitial space, intracellular compartment 1, and intracellular compartment 2 (i.e., deep pool), respectively. kass is the first-order association rate constant and kdis is the first-order dissociation rate constant. All the other symbols have been defined in local model 1.
Model 3
Mitoxantrone is known to bind to DNA, which represents the mechanism for its cytotoxicity. In addition to DNA binding, it has been reported that mitoxantrone can also bind to microsomal protein. To account for binding of mitoxantrone to intracellular macromolecules within tissues, we proposed a more physiologically relevant model including DNA and protein binding using the following equations:
Equations for well-stirred organs (heart, liver, kidney, brain, spleen, and lung) were:
 |
9 |
Equations for the permeability-limited organs (the remainder compartment) were:
 |
10 |
 |
11 |
In the above equations, TDNA and Tmacro are the binding capacity of DNA and protein, respectively, and KDNA and Kmacro are the binding affinity of mitoxantrone to DNA and protein, respectively. All the other symbols have been defined in local models 1 and 2.
Regarding mitoxantrone tissue protein binding, although the exact macromolecules involved remain unclear, based on the fact that doxorubicin is known to bind to cardiolipin (26), we assume that cardiolipin may also be a major representative of mitoxantrone protein binding. It should be noted that among the six tissues that were collected in our mouse study, the mouse DNA and cardiolipin content was only available in the literature for liver, heart, and kidney (17). Therefore, the DNA and cardiolipin content, providing the TDNA and Tmacro values in liver, heart, and kidney were fixed to the reported experimental values (17, 27). The unknown DNA and cardiolipin content in lung, brain, and spleen were estimated by fitting TDNA and Tmacro in the model. These parameters with the corresponding CV% are provided in Table II.
Table II.
Mitoxantrone Parameter Estimation and CV% in Models 1–3 (Results of all Fitted Parameters Given Below were Obtained from Modeling Mitoxantrone PK in Mice)
| Model 1 | Model 2 | Model 3 | |||||
|---|---|---|---|---|---|---|---|
| Kp | k ass | k dis | T macro | K macro | T DNA | K DNA | |
| Tissues | (h−1) | (h−1) | (nmol/g tissue) | (μM) | (nmol/g tissue) | (μM) | |
| Lung | 15.42 (20.1 %) | 0.048 (>300 %) | 0.00014 (>300 %) | 19.0 (87 %) | 1.44 (52 %) | 16.2 (13 %) | 0.0013 (29 %) |
| Heart | 12.74 (18.5 %) | 0.359 (>300 %) | 0.0012 (>300 %) | – | 1.44 (52 %) | – | 0.0013 (29 %) |
| Spleen | 26.26 (20.8 %) | 0.049 (>300 %) | 0.000053 (>300 %) | 3.54 (>300 %) | 1.44 (52 %) | 18.4 (18 %) | 0.0013 (29 %) |
| Liver | 11.64 (70.1 %) | 0.097 (>300 %) | 0.00044 (292 %) | 514 (45 %) | 1.44 (52 %) | – | 0.0013 (29 %) |
| Kidney | 45 (36.7 %) | 0.845 (>300 %) | 0.0012 (>300 %) | – | 1.44 (52 %) | – | 0.0013 (29 %) |
| Brain | 0.065 (22.7 %) | 0.010 (35.5 %) | 0.032 (67.2 %) | – | 1.44 (52 %) | 0.10 (11 %) | 0.0013 (29 %) |
| Other | 20.33 (18.5 %) | 0.128 (128 %) | 3.52 (63.9 %) | 4.67 (>300 %) | 1.44 (52 %) | 4.82 (43 %) | 0.0013 (29 %) |
T DNA in heart, liver, and kidney and T macro in heart and kidney were fixed to the values provided in Table I
Data Analysis
In the data fitting, fu was fixed to 0.2 and the physiological parameters (organ intracellular and extracellular volumes and organ blood flow), TDNA in heart, liver and kidney, and Tmicro in heart and kidney were fixed to those values provided in Table I, The estimated parameters were hepatic and renal clearance (Clint,H and Clint,R), PS, Kp (model 1), kass (model 2), kdis (model 2), TDNA and Tmacro in other tissues (lung, brain and spleen, and the remainder compartment) (model 3), KDNA and Kmacro (model 3). All the plasma and tissue data were fitted simultaneously using the maximum likelihood estimation in ADAPT5 with following variance model:
 |
12 |
where σ1 and σ2 are the variance parameters, Y(t) is the model output at time t and Var (t) is the variance associated with the output. Standard goodness-of-fit criteria including Akaike Information Criterion and Schwartz Criterion were used to evaluate the predictive capability of the constructed PBPK models.
Scale-Up from Mice to Humans
The final mitoxantrone PBPK model developed for mice was used to simulate plasma and tissue concentrations of mitoxantrone after an IV dose of 12 mg/m2 to humans. The PBPK simulations for mitoxantrone PK in humans were performed in ADAPT 5 (version 5, Biomedical Simulations Resource, Los Angeles, CA). Human physiological parameters, including organ volume, blood flow, and human tissue DNA content, were fixed to the literature values (Table III). It should be noted that regarding human DNA tissue content, only values for DNA content in liver, heart, and kidney are available in the literature and values for human DNA content in lung, spleen, and other tissues are unknown. However, Gustafson et al. (17) measured DNA content in rapidly perfused organs and slowly perfused organs. As lung and spleen represent rapidly perfused organs, we used the human DNA value for the rapidly perfused organs for spleen and lungs. The remainder compartment in our model includes many slowly perfused organs (including muscle, fat, bone, and skin). The human DNA content in the remainder compartment was fixed to the reported human DNA value in slowly perfused organs.
Table III.
Physiological and Kinetic Parameters for Mitoxantrone PBPK Simulations in Humans
| Organ | Blood flow rate (L/min)a | Organ volume (L)a | DNA concentration (μM)b | Protein concentration (μM)c |
|---|---|---|---|---|
| Plasma | 5.6 | 3 | ||
| Lung | 5.6 | 1.17 | 15d | 19 |
| Heart | 0.24 | 0.31 | 8.3 | 43.8 |
| Spleen | 0.077 | 0.192 | 15d | 3.54 |
| Liver | 1.45 | 1.69 | 23.7 | 514 |
| Kidney | 1.24 | 0.28 | 16.2 | 52.3 |
| Brain | 0.7 | 1.45 | 0.1 | – |
| Other | 1.893 | 62 | 4.5d | 4.67 |
These parameters were fixed for our simulations of mitoxantrone PK in humans
aThe blood flow rate and organ volume in each tissue were obtained based on a 70-kg man from literature data (25)
bDNA content were taken from Gustafson et al. (17)
cProtein content (T macro) in different tissues were assumed to be identical among mammals and values were fixed using values obtained from mouse mitoxantrone PBPK model 3
dHuman lung and spleen DNA contents used in the simulations were the literature reported human DNA content in rapidly perfused organs. DNA content in the remainder compartment used in the simulations was the reported DNA content in slowly perfused organs (17). DNA content in the brain used in the simulations was the value obtained from the mouse mitoxantrone PBPK model 3
Blood and tissue distribution parameters, including fu (0.2), KDNA (0.0013 μM), Kmacro (1.44 μM), and Tmacro in different tissues (values provided in Table III) were assumed to be identical in mammals. PSt was scaled up to humans by use of a previously described allometric equation (28):
 |
13 |
where M is organ weight, and A and B are the coefficient and power function for the allometric relationship, respectively. A fixed value of 0.75 was used for B. PSt used in the human simulation was 31.1 L/h.
Clint,H in human was calculated with the assumption of the well-stirred hepatic distribution model:
 |
14 |
QH is the human hepatic blood flow, and fu (0.2) is the fraction of unbound mitoxantrone. A similar method was used to estimate renal clearance. CLH and CLR were taken from literature (19 and 2.7 L/h/m2, respectively) (6). Clint,H and Clint,R used in human simulation were 250 L/h and 27 L/h, respectively.
RESULTS
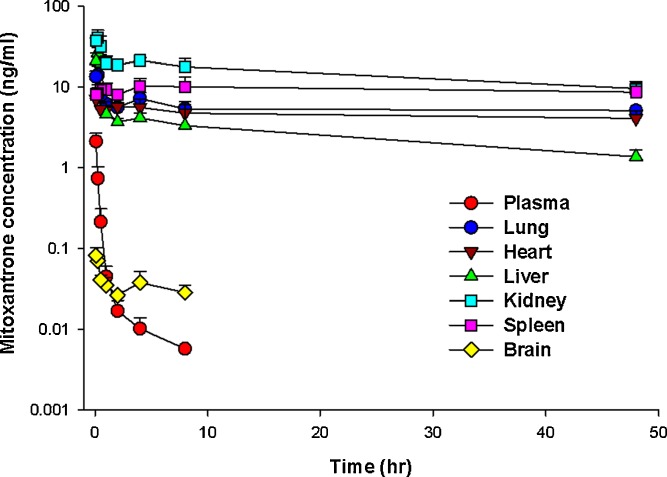
Mitoxantrone pharmacokinetics was investigated in mice following a single IV dose of 5 mg/kg. As shown in Fig. 4, in contrast to mitoxantrone plasma concentrations, which were low and could not be detected after 8 h, mitoxantrone concentrations in most tissues were substantially higher and were measurable even at 48 h. On the other hand, mitoxantrone brain levels were consistently low at all time points, indicating poor penetration across the blood brain barrier. It should be noted that the terminal slope of mitoxantrone from its plasma concentration–time curve was 0.176 h−1 and this value was much higher than the terminal slope of mitoxantrone in heart (0.0022 h−1), lung (0.0026 h−1), spleen (0.0021 h−1), liver (0.0195 h−1), and kidney (0.0123 h−1). Since the terminal slope of mitoxantrone in plasma eventually should be parallel with that in tissues, the much higher mitoxantrone terminal slope observed in plasma indicates that this is not the real terminal slope. The real terminal slope has not been captured by the plasma data due to concentrations being below the assay detection limit. Correspondingly, the calculated half-life (3.9 h, Table IV) using the current terminal slope (0.176 h−1) value will be much shorter than the real half-life. Based on the mean terminal slope of mitoxantrone in heart, lung, spleen, liver, and kidney (0.00774 h−1), the calculated mitoxantrone half-life is about 89.5 h in our mouse PK study.
Fig. 4.
Mitoxantrone concentrations in plasma and in six examined tissues (lung, heart, spleen, liver, kidney, and brain) following the intravenous administration of 5 mg/kg mitoxantrone in mice. Plasma and tissue levels of mitoxantrone were determined by HPLC. Three mice were used at each time point. Data are presented as mean + SD, n = 3 or 4
Table IV.
Mitoxantrone Pharmacokinetic Parameters for Mice Determined Using Models 1–3
| Parameters | Unit | Actual data a | Model 1 | Model 2 | Model 3 |
|---|---|---|---|---|---|
| Cmax | μg/ml | 2.12 | 1.84 | 4.35 | 2.99 |
| t 1/2 | h | 3.9 | 45.6 | 8.4 | 29.8 |
| AUCplasma | μg h/ml | 0.6 | 3.28 | 0.79 | 0.7 |
| AUClung | μg h/ml | 263 | 197 | 338 | 242 |
| AUCheart | μg h/ml | 221 | 167 | 217 | 355 |
| AUCspleen | μg h/ml | 452 | 345 | 374 | 364 |
| AUCliver | μg h/ml | 138 | 146 | 389 | 127 |
| AUCkidney | μg h/ml | 718 | 592 | 874 | 757 |
| AUCbrain | μg h/ml | 0.28 | 0.21 | 0.31 | 0.32 |
aActual data was determined by noncompartmental analysis
Mitoxantrone PBPK Model in Mice
Model 1
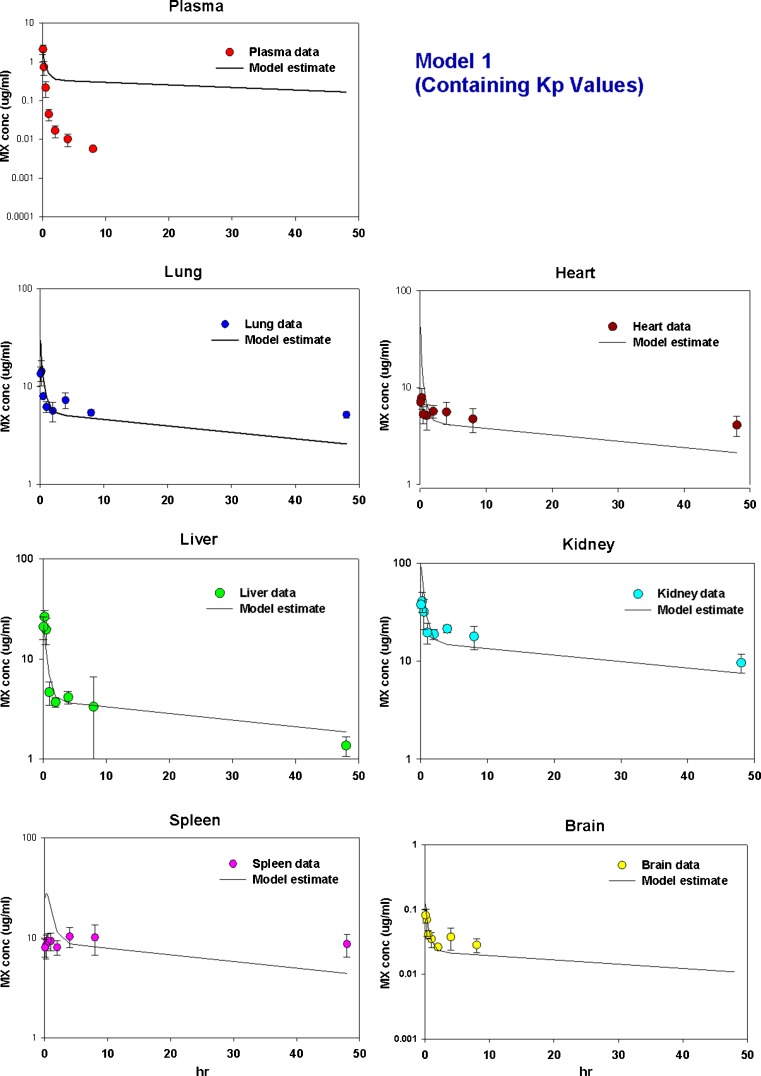
As shown in Fig. 5a and Table IV, although this model was able to predict the overall behavior of mitoxantrone disposition in tissues, it could not capture mitoxantrone plasma data, indicating that this is not an appropriate model for determining the mitoxantrone PK profile. Moreover, the estimated Kp values (Table II) were much lower than the calculated Kp values (Table I). The estimated intrinsic hepatic and renal clearance rates were 0.28 and 0.0051 ml/min, respectively. The estimated permeability was 3.2 ml/min.
Fig. 5.
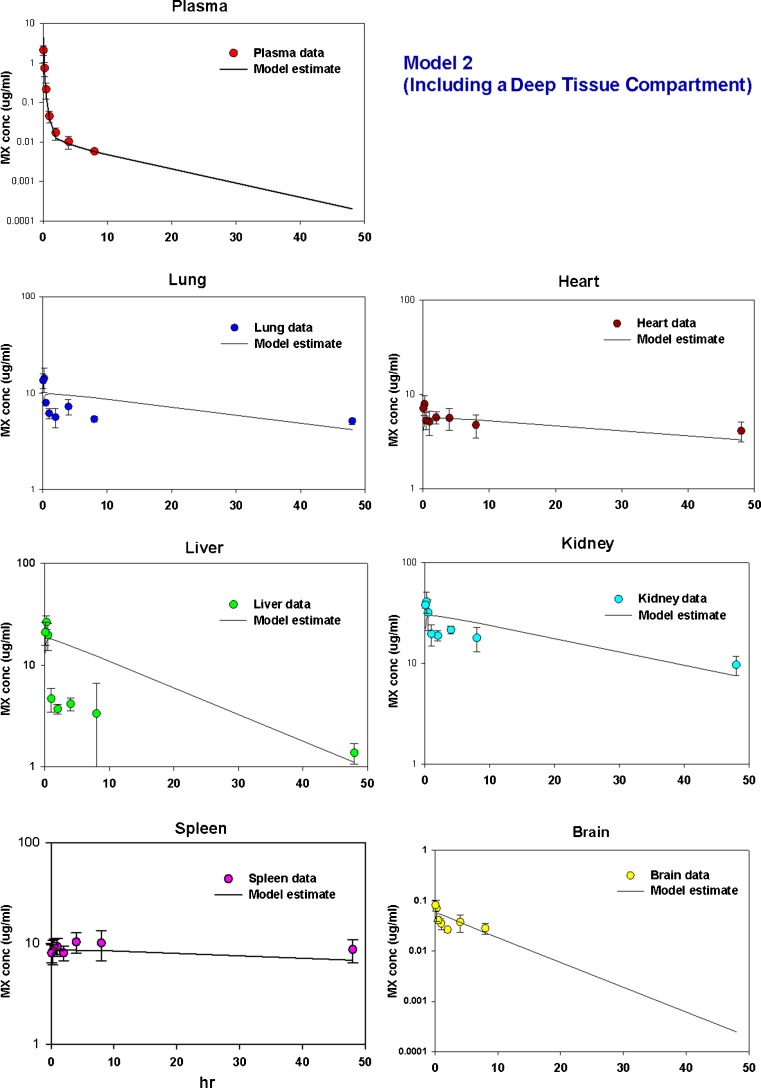
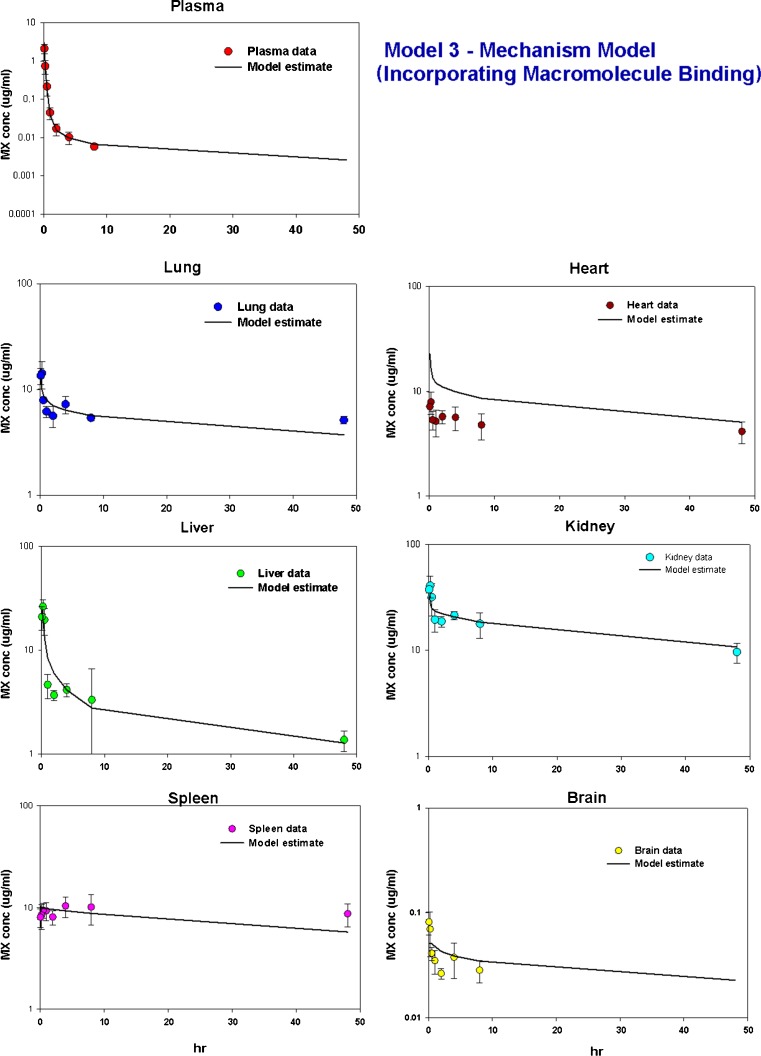
Time courses of measured and predicted mitoxantrone concentrations in plasma, lung, heart, liver, kidney, and spleen and brain in mice using a Model 1 (containing Kp values), b Model 2 (including a deep tissue compartment), and c Model 3 (incorporating DNA and other macromolecule binding). Solid symbols are the experimental values which were obtained as described in MATERIALS AND METHODS section. Solid lines are the predicted results which were obtained by simultaneous fitting of all data using ADAPT 5
Model 2
Since mitoxantrone was extensively distributed to and slowly cleared from tissues, we proposed a model which has a deep tissue compartment, as depicted in Fig. 3. The estimated kass and kdis are provided in Table II. As shown in Fig. 5b, although this model captured the plasma data fairly well, the terminal slope was very steep, and consequently, the estimated mitoxantrone half-life (8.4 h, Table IV) is much shorter than the real half-life (89.5 h). Moreover, the model fittings in a few tissues, including liver and brain, were poor. High CV% was obtained for most of the estimated parameters. The intrinsic hepatic and renal clearance values were assumed to be the same, namely 0.254 ml/min. The estimated permeability was 4.6 ml/min.
Model 3
It has been reported that mitoxantrone remains in tissues for long periods due to tight binding to DNA and proteins (6, 8). Therefore, in the current study, we constructed a PBPK model incorporating DNA and protein binding. The relationship between doxorubicin tissue partitioning and DNA content has been established by Terasaki et al. (29, 30). Since the chemical structure of mitoxantrone is similar to that of doxorubicin, we evaluated the relationship between the Kp value of mitoxantrone and mouse tissue DNA content. It should be noted that among the six tissues that were collected in our study, murine DNA tissue content was only available for three tissues (liver, heart, and kidney) (17). Our preliminary data indicated that the DNA content in these three tissues correlate well with the calculated Kp values of mitoxantrone in each corresponding tissue (data not shown). Therefore, in our final model 3, the TDNA in liver, heart, and kidney were fixed to the corresponding mouse DNA content which was reported by Gustafson et al. (17). The identities of other macromolecules, besides DNA, involved in mitoxantrone tissue binding interactions are unknown. Doxorubicin has been reported to bind to anionic lipids, particularly cardiolipin (26). Based on the structural similarity between doxorubicin and mitoxantrone, it is likely that cardiolipin may contribute to mitoxantrone tissue binding. Similar to DNA, literature reports of cardiolipin murine tissue content can only be found in some tissues, including liver, heart, and kidney (17, 27). Initially we fixed the Tmacro in liver, heart, and kidney using the experimental cardiolipin values in these three tissues, with Tmacro in the remaining tissues being estimated. However, the combination of liver cardiolipin and DNA cannot capture mitoxantrone concentration in liver. Therefore, in our final model 3, only heart Tmacro and kidney Tmacro were fixed to the corresponding cardiolipin values, with Tmacro in the liver and the remaining tissues being estimated. The estimated liver Tmacro (514 μM) is higher than the liver cardiolipin content (44.6 μM), suggesting that other protein(s) may also be involved in mitoxantrone protein binding in the liver.
As shown in Fig. 5c, this mechanism-based model was able to capture well the mitoxantrone time–concentration profiles in plasma and in various tissues. In addition, the model-predicted Cmax and AUC were in good agreement with the observed values (Table IV). Additionally, the estimated mitoxantrone half-life (29.8 h, Table IV) is also close to the half-life calculated from mitoxantrone mean tissue terminal slope. The estimated values and CV% of intrinsic hepatic and renal clearances were 29.5 ml/min (22 %) and 2.14 ml/min (54 %), respectively. Based on the estimated intrinsic clearance, the hepatic and renal clearances were estimated to be 0.98 ml/min and 0.21 ml/min, respectively. The estimated DNA concentrations in spleen, lung, and the remainder compartment were 18.4, 16.2, and 4.82 μM, respectively. The estimated binding affinity for DNA (KDNA) and protein (Kmacro) were 0.0013 and 1.44 μM, respectively. The estimated permeability was 1.44 ml/min.
Mitoxantrone Model Simulations in Humans
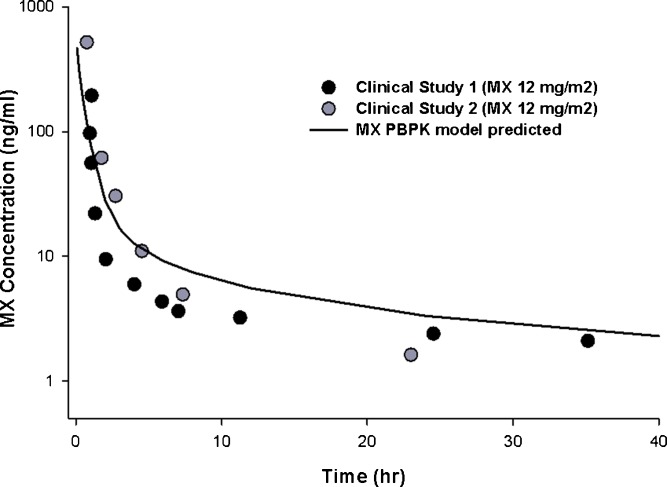
A human PBPK model was generated using human parameters for organ volume, blood flow, and tissue DNA content (Table III). As mitoxantrone only undergoes moderate metabolism, with biliary and urinary excretion representing the primary elimination pathways, using in vitro microsome data may not be an appropriate method to predict the in vivo hepatic intrinsic clearance. Therefore, in the current study, the in vivo intrinsic hepatic and renal clearances of mitoxantrone in humans were estimated based on Eq. 14. The simulated results were compared with observed human data sets from two previously published studies, both of which used a standard IV dose of 12 mg/m2 mitoxantrone (31, 32). As shown in Fig. 6, the predicted mitoxantrone plasma concentrations in humans were in good agreement with the observed values.
Fig. 6.
Measured (black and gray symbols) and PBPK model-predicted (solid line) plasma concentrations of mitoxantrone in patients after a standard dose of mitoxantrone. The dose of mitoxantrone used in both clinical studies (Larson et al. 1987 [gray symbols] and Peng et al. 1982 [black symbols]) was 12 mg/m2
DISCUSSION
Although the disposition of mitoxantrone in plasma has been investigated by numerous studies in different species, the reported mitoxantrone half-lives vary considerably, with values ranging from 2.9 to 214.8 h (2, 6, 12). The shorter half-life reported by many investigators is mainly due to the limited assay sensitivity: mitoxantrone levels in plasma decline very rapidly because of mitoxantrone's extensive tissue distribution and correspondingly plasma concentrations fall below the assay detection limit within a few hours. Mitoxantrone is known to be sequestered in tissues. For example, in a study conducted by Alberts et al. (33), even at 35 days after the administration of 14C-mitoxantrone (4.83 μCi/mg), the concentration of mitoxantrone was still relatively high in many tissues including liver, pancreas, spleen, and heart, with about 15 % of the administered dose still retained in the body. The longest half-life of mitoxantrone (214.8 h) was reported by Ehninger et al. (12), using a sensitive assay that can detect mitoxantrone concentrations as low as 1 ng/ml.
Gaining insight into the PK behavior of a therapeutic compound in different tissues, especially for those anticancer drugs which usually have extensive tissue distribution, is highly desirable for optimizing therapies. In the present study, we constructed a PBPK model for mitoxantrone, a well-established anticancer drug. The first PBPK model we tried was the classical model containing Kp values, with the examined organs described by perfusion-limited models and the remainder compartment by a permeability-limited model. However, although the tissue concentration–time profile can be predicted, this classical model was not able to capture the plasma data, with the predicted plasma values around two orders of magnitude higher than the observed values. We constructed a linear deep pool model based on the fact that mitoxantrone was sequestered in tissues for a prolonged period of time. Although the model fitting in plasma was good, it should be noted that the terminal slope was very steep, indicating that this model may underestimate mitoxantrone plasma concentrations at later times. Moreover, all predicted tissue data followed a mono-exponential decline, which was not able to capture the observed tissue concentration–time profiles.
Since the first two PBPK models did not provide satisfactory fittings, we constructed another PBPK model, with the aim of increasing the mechanistic nature of the model. Mitoxantrone, similar as other anticancer drugs such as doxorubicin and daunorubicin, is known to bind tightly to DNA resulting in cytotoxicity (9, 34, 35). In addition to DNA binding, mitoxantrone has also been reported to bind to macromolecules in tissue, including microsomal protein. Therefore, we constructed a mechanism-based PBPK model which incorporates macromolecule binding. Terasaki et al. (29, 30) measured tissue DNA content in rats, rabbits, and pigs and found that doxorubicin tissue partitioning correlates well with the corresponding tissue DNA content. Gustafson et al. measured the DNA contents in different tissues in several other species, including mice, dog, and human; then they leveraged their experimental DNA data to explain the PK and tissue distribution of doxorubicin (17). Since the chemical structure of mitoxantrone is similar to that of doxorubicin, we evaluated the relationship between Kp value of mitoxantrone and mouse tissue DNA content and our preliminary data indicated that the DNA content in these three tissues correlated well with the calculated Kp values of mitoxantrone in each corresponding tissue (data not shown). As shown in Fig. 5c, data fitting using this semi-mechanistic model was good in both plasma and tissues. The estimated DNA concentration in the remainder compartment was 4.82 μM, which is lower than the DNA content for other tissue compartments (Table II). This relatively low content of DNA in the remainder compartment may be attributed to the low DNA concentrations in muscle and adipose tissue, both of which were included in the remainder compartment. The estimated intrinsic hepatic clearance was 25.2 ml/min; this value is much larger than the hepatic blood flow rate of mice (1.21 ml/min). This indicates that the mitoxantrone hepatic clearance in mice is liver blood flow limited. In addition, the estimated mitoxantrone hepatic clearance (0.98 ml/min) is higher than the estimated renal clearance (0.21 ml/min) and this is consistent with the report that biliary excretion is the major excretory pathway for mitoxantrone (36). Moreover, the estimated mitoxantrone total clearance is 1.19 ml/min (i.e., 2.7 L/h/kg); this value is within the range of values reported in the literature (0.72 to 10.4 L/h/kg) (37, 38). Additionally, the estimated binding affinity of mitoxantrone to DNA was much higher than to the second binding site, with values of 0.0013 μM for DNA and 1.44 μM for the protein binding site. It should be noted that the estimated Kmacro (1.44 μM) and KDNA (0.0013 μM) are at the limit of, or even beyond, the observed plasma concentration range, and therefore, the values should be interpreted with caution. Further investigation is warranted to validate these model- estimated results.
Mitoxantrone has been reported to be a substrate of BCRP with high affinity and a substrate of P-gp with moderate affinity (15, 39). The administered dose of mitoxantrone was high (5 mg/kg) in the current study and the observed mitoxantrone concentrations in most examined tissues were higher than 5 μM over the time period of the study; this concentration is higher than the mitoxantrone concentration tested in many in vitro studies (40, 41). The role of efflux transporters in mitoxantrone tissue distribution may not be very important considering the possible saturation of transport at these high mitoxantrone concentrations. However, it should be noted that this model was developed only using one dosage (5 mg/kg). Therefore, further investigation is warranted to evaluate this model in different dosages. In addition, the incorporation of efflux transporters may also be necessary for data obtained using low doses of mitoxantrone. It should be noted that in the current study mitoxantrone tissue samples were only collected up to 48 h. Therefore, the model results should be interpreted with caution when it is extrapolated to longer time periods. Further investigation is warranted to evaluate mitoxantrone tissue distribution over longer periods of time. As there is a need to further evaluate the role of transporters in mitoxantrone tissue distribution when mitoxantrone is administered at low doses, the development of more sensitive assays may also be required.
One attractive feature of a PBPK model is the ability to extrapolate the PK of the compound of interest from one species to other species. In the current study, based on the plasma and tissue distribution data of mitoxantrone obtained in the mouse, we successfully predicted the PK of mitoxantrone in humans using a mechanism-based PBPK model. The ability of the current model to successfully extrapolate the PK of mitoxantrone from mice to humans supports the validity of incorporation of macromolecule binding in the model development. Mitoxantrone plasma concentrations in humans drop rapidly and usually fall below the assay detection limit within a few hours. Considering the extensive tissue distribution of mitoxantrone, plasma concentration may not be a good indicator for mitoxantrone exposure at the target site or organ of toxicity. Since our semi-mechanistic PBPK model cannot only predict mitoxantrone concentrations in plasma but also in various organs, our model may also have clinical application in efficacy and safety assessment of mitoxantrone and may provide additional input for the optimization of therapy.
In summary, we reported for the first time a semi-mechanistic PBPK model of mitoxantrone, incorporating macromolecule binding, which is able to capture mitoxantrone plasma and tissue data in mice. We also used this model to predict plasma mitoxantrone concentration in humans, with physiological parameters scaled up from mice to humans. The predicted results generally agreed with the observed time course of mitoxantrone plasma concentrations in patients after a standard dose of 12 mg/m2. A shortcoming of this model is the fact that it is based on plasma and tissue data obtained after a single dose. Validation of the model using additional doses is necessary.
Acknowledgment
Supported in part by a grant from the Susan G. Komen Breast Cancer Foundation (BCTR0601385). We thank Dr. Donald Mager and Dr. Chao Xu for their valuable suggestions in the PBPK model construction.
References
- 1.Smith IE. Mitoxantrone (novantrone): a review of experimental and early clinical studies. Cancer Treat Rev. 1983;10:103–115. doi: 10.1016/0305-7372(83)90008-7. [DOI] [PubMed] [Google Scholar]
- 2.Batra VK, Morrison JA, Woodward DL, Siverd NS, Yacobi A. Pharmacokinetics of mitoxantrone in man and laboratory animals. Drug Metab Rev. 1986;17:311–329. doi: 10.3109/03602538608998294. [DOI] [PubMed] [Google Scholar]
- 3.Durr FE, Wallace RE, Citarella RV. Molecular and biochemical pharmacology of mitoxantrone. Cancer Treat Rev. 1983;10(Suppl B):3–11. doi: 10.1016/0305-7372(83)90016-6. [DOI] [PubMed] [Google Scholar]
- 4.Young CW, Raymond V. Clinical assessment of the structure-activity relationship of anthracyclines and related synthetic derivatives. Cancer Treat Rep. 1986;70:51–63. [PubMed] [Google Scholar]
- 5.Scott LJ, Figgitt DP. Mitoxantrone: a review of its use in multiple sclerosis. CNS Drugs. 2004;18:379–396. doi: 10.2165/00023210-200418060-00010. [DOI] [PubMed] [Google Scholar]
- 6.Ehninger G, Schuler U, Proksch B, Zeller KP, Blanz J. Pharmacokinetics and metabolism of mitoxantrone. A review. Clin Pharmacokinet. 1990;18:365–380. doi: 10.2165/00003088-199018050-00003. [DOI] [PubMed] [Google Scholar]
- 7.De Isabella P, Palumbo M, Sissi C, Capranico G, Carenini N, Menta E, Oliva A, Spinelli S, Krapcho AP, Giuliani FC, et al. Topoisomerase II DNA cleavage stimulation, DNA binding activity, cytotoxicity, and physico-chemical properties of 2-aza- and 2-aza-oxide-anthracenedione derivatives. Mol Pharmacol. 1995;48:30–38. [PubMed] [Google Scholar]
- 8.Thielmann HW, Popanda O, Gersbach H, Gilberg F. Various inhibitors of DNA topoisomerases diminish repair-specific DNA incision in UV-irradiated human fibroblasts. Carcinogenesis. 1993;14:2341–2351. doi: 10.1093/carcin/14.11.2341. [DOI] [PubMed] [Google Scholar]
- 9.Foye WO, Vajragupta O, Sengupta SK. DNA-binding specificity and RNA polymerase inhibitory activity of bis(aminoalkyl)anthraquinones and bis(methylthio)vinylquinolinium iodides. J Pharm Sci. 1982;71:253–257. doi: 10.1002/jps.2600710228. [DOI] [PubMed] [Google Scholar]
- 10.Lu K, Savaraj N, Loo TL. Pharmacological disposition of 1,4-dihydroxy-5-8-bis[[2 [(2-hydroxyethyl)amino]ethyl]amino]-9,10-anthracenedione dihydrochloride in the dog. Cancer Chemother Pharmacol. 1984;13:63–66. doi: 10.1007/BF00401450. [DOI] [PubMed] [Google Scholar]
- 11.Reszka R, Beck P, Fichtner I, Hentschel M, Richter J, Kreuter J. Body distribution of free, liposomal and nanoparticle-associated mitoxantrone in B16-melanoma-bearing mice. J Pharmacol Exp Ther. 1997;280:232–237. [PubMed] [Google Scholar]
- 12.Ehninger G, Proksch B, Heinzel G, Schiller E, Weible KH, Woodward DL. The pharmacokinetics and metabolism of mitoxantrone in man. Invest New Drugs. 1985;3:109–116. doi: 10.1007/BF00174157. [DOI] [PubMed] [Google Scholar]
- 13.Richard B, Fabre G, Fabre I, Cano JP. Excretion and metabolism of mitoxantrone in rabbits. Cancer Res. 1989;49:833–837. [PubMed] [Google Scholar]
- 14.Alberts DS, Peng YM, Leigh S, Davis TP, Woodward DL. Disposition of mitoxantrone in cancer patients. Cancer Res. 1985;45:1879–1884. [PubMed] [Google Scholar]
- 15.Sharom FJ. ABC multidrug transporters: structure, function and role in chemoresistance. Pharmacogenomics. 2008;9:105–127. doi: 10.2217/14622416.9.1.105. [DOI] [PubMed] [Google Scholar]
- 16.Gerlowskiand LE, Jain RK. Physiologically based pharmacokinetic modeling: principles and applications. J Pharm Sci. 1983;72:1103–1127. doi: 10.1002/jps.2600721003. [DOI] [PubMed] [Google Scholar]
- 17.Gustafson DL, Rastatter JC, Colombo T, Long ME. Doxorubicin pharmacokinetics: macromolecule binding, metabolism, and excretion in the context of a physiologic model. J Pharm Sci. 2002;91:1488–1501. doi: 10.1002/jps.10161. [DOI] [PubMed] [Google Scholar]
- 18.Bradshaw-Pierce EL, Eckhardt SG, Gustafson DL. A physiologically based pharmacokinetic model of docetaxel disposition: from mouse to man. Clin Cancer Res. 2007;13:2768–2776. doi: 10.1158/1078-0432.CCR-06-2362. [DOI] [PubMed] [Google Scholar]
- 19.Zaharko DS, Dedrick RL, Bischoff KB, Longstreth JA, Oliverio VT. Methotrexate tissue distribution: prediction by a mathematical model. J Natl Cancer Inst. 1971;46:775–784. [PubMed] [Google Scholar]
- 20.Li J, Gwilt P. The effect of malignant effusions on methotrexate disposition. Cancer Chemother Pharmacol. 2002;50:373–382. doi: 10.1007/s00280-002-0512-9. [DOI] [PubMed] [Google Scholar]
- 21.Bischoff KB, Dedrick RL, Zaharko DS, Longstreth JA. Methotrexate pharmacokinetics. J Pharm Sci. 1971;60:1128–1133. doi: 10.1002/jps.2600600803. [DOI] [PubMed] [Google Scholar]
- 22.Farris FF, Dedrick RL, King FG. Cisplatin pharmacokinetics: applications of a physiological model. Toxicol Lett. 1988;43:117–137. doi: 10.1016/0378-4274(88)90024-0. [DOI] [PubMed] [Google Scholar]
- 23.Shah DK, Balthasar JP. Physiologically based pharmacokinetic model for topotecan in mice. J Pharmacokinet Pharmacodyn. 2011;38:121–42. doi: 10.1007/s10928-010-9181-1. [DOI] [PubMed] [Google Scholar]
- 24.An G, Morris ME. HPLC analysis of mitoxantrone in mouse plasma and tissues: application in a pharmacokinetic study. J Pharm Biomed Anal. 2010;51:750–753. doi: 10.1016/j.jpba.2009.09.027. [DOI] [PubMed] [Google Scholar]
- 25.Davies B, Morris T. Physiological parameters in laboratory animals and humans. Pharm Res. 1993;10:1093–1095. doi: 10.1023/A:1018943613122. [DOI] [PubMed] [Google Scholar]
- 26.Goormaghtigh E, Chatelain P, Caspers J, Ruysschaert JM. Evidence of a specific complex between adriamycin and negatively-charged phospholipids. Biochim Biophys Acta. 1980;597:1–14. doi: 10.1016/0005-2736(80)90145-5. [DOI] [PubMed] [Google Scholar]
- 27.Courtade S, Marinetti GV, Stotz E. The structure and abundance of rat tissue cardiolipins. Biochim Biophys Acta. 1967;137:121–134. doi: 10.1016/0005-2760(67)90015-x. [DOI] [PubMed] [Google Scholar]
- 28.Kawai R, Mathew D, Tanaka C, Rowland M. Physiologically based pharmacokinetics of cyclosporine A: extension to tissue distribution kinetics in rats and scale-up to human. J Pharmacol Exp Ther. 1998;287:457–468. [PubMed] [Google Scholar]
- 29.Terasaki T, Iga T, Sugiyama Y, Hanano M. Pharmacokinetic study on the mechanism of tissue distribution of doxorubicin: interorgan and interspecies variation of tissue-to-plasma partition coefficients in rats, rabbits, and guinea pigs. J Pharm Sci. 1984;73:1359–1363. doi: 10.1002/jps.2600731008. [DOI] [PubMed] [Google Scholar]
- 30.Terasaki T, Iga T, Sugiyama Y, Hanano M. Experimental evidence of characteristic tissue distribution of adriamycin. Tissue DNA concentration as a determinant. J Pharm Pharmacol. 1982;34:597–600. doi: 10.1111/j.2042-7158.1982.tb04804.x. [DOI] [PubMed] [Google Scholar]
- 31.Peng YM, Ormberg D, Alberts DS, Davis TP. Improved high-performance liquid chromatography of the new antineoplastic agents bisantrene and mitoxantrone. J Chromatogr. 1982;233:235–247. doi: 10.1016/S0378-4347(00)81750-8. [DOI] [PubMed] [Google Scholar]
- 32.Larson RA, Daly KM, Choi KE, Han DS, Sinkule JA. A clinical and pharmacokinetic study of mitoxantrone in acute nonlymphocytic leukemia. J Clin Oncol. 1987;5:391–397. doi: 10.1200/JCO.1987.5.3.391. [DOI] [PubMed] [Google Scholar]
- 33.Alberts DS, Peng YM, Leigh S, Davis TP, Woodward DL. Disposition of mitoxantrone in patients. Cancer Treat Rev. 1983;10(Suppl B):23–27. doi: 10.1016/0305-7372(83)90018-X. [DOI] [PubMed] [Google Scholar]
- 34.Lown JW, Hanstock CC. High field 1H-NMR analysis of the 1:1 intercalation complex of the antitumor agent mitoxantrone and the DNA duplex [d(CpGpCpG)] J Biomol Struct Dyn. 1985;2:1097–1106. doi: 10.1080/07391102.1985.10507626. [DOI] [PubMed] [Google Scholar]
- 35.Kapuscinski J, Darzynkiewicz Z. Relationship between the pharmacological activity of antitumor drugs Ametantrone and mitoxantrone (Novatrone) and their ability to condense nucleic acids. Proc Natl Acad Sci U S A. 1986;83:6302–6306. doi: 10.1073/pnas.83.17.6302. [DOI] [PMC free article] [PubMed] [Google Scholar]
- 36.Rentsch KM, Schwendener RA, Pestalozzi BC, Sauter C, Wunderli-Allenspach H, Hanseler E. Pharmacokinetic studies of mitoxantrone and one of its metabolites in serum and urine in patients with advanced breast cancer. Eur J Clin Pharmacol. 1998;54:83–89. doi: 10.1007/s002280050425. [DOI] [PubMed] [Google Scholar]
- 37.Rentsch KM, Horber DH, Schwendener RA, Wunderli-Allenspach H, Hanseler E. Comparative pharmacokinetic and cytotoxic analysis of three different formulations of mitoxantrone in mice. Br J Cancer. 1997;75:986–992. doi: 10.1038/bjc.1997.170. [DOI] [PMC free article] [PubMed] [Google Scholar]
- 38.Wang YF, Ahmad A, Abu-Qare AW, Dudkowski C, Ayoub JE, Zhang A, Ahmad I. Rapid determination of liposomal and non-liposomal mitoxantrone in mouse plasma. Preclinica. 2004;2:279–286. [Google Scholar]
- 39.Mao Q, Unadkat JD. Role of the breast cancer resistance protein (ABCG2) in drug transport. AAPS J. 2005;7:E118–E133. doi: 10.1208/aapsj070112. [DOI] [PMC free article] [PubMed] [Google Scholar]
- 40.Zhang S, Yang X, Morris ME. Flavonoids are inhibitors of breast cancer resistance protein (ABCG2)-mediated transport. Mol Pharmacol. 2004;65:1208–1216. doi: 10.1124/mol.65.5.1208. [DOI] [PubMed] [Google Scholar]
- 41.Minderman H, Suvannasankha A, O'Loughlin KL, Scheffer GL, Scheper RJ, Robey RW, Baer MR. Flow cytometric analysis of breast cancer resistance protein expression and function. Cytometry. 2002;48:59–65. doi: 10.1002/cyto.10111. [DOI] [PubMed] [Google Scholar]


