Abstract
The analysis of particulates has been a longstanding challenge in biopharmaceutical drug product development and quality control because the active constituents themselves may form particulate matter as a degradation product that may be difficult to quantify. These analytical challenges were met with success as long as the definition of particulate matter remained well within the capabilities of the instruments and methods used to measure it. The current testing as per USP <788> for parenterals at ≤100 mL stipulates that the sample “passes” the test if the average number of particles present does not exceed 6,000 per container at ≥10 μm and does not exceed 600 per container at ≥25 μm. The new challenge, posed by regulatory direction and academic research, is to count and to characterize subvisible particulates that are ≤10 μm with the goal of providing higher resolution information about the particulate levels and potential consequences of this product quality attribute in vivo. The present discussion focuses on two parallel efforts: (a) to develop a model system for protein subvisible particulates in samples with high protein concentrations and (b) to evaluate the capabilities and limitations of different technologies available (at the time these studies were conducted) for subvisible and submicron particle (<1 μm in diameter) sizing and counting. Our findings illustrate the importance of using appropriate instrumentation that is adapted to the characteristics of the samples to be analyzed. Any sample manipulation to meet the capabilities and to accommodate the limitations of the analytical technique should be carefully evaluated.
Electronic supplementary material
The online version of this article (doi:10.1208/s12248-012-9335-8) contains supplementary material, which is available to authorized users.
KEY WORDS: light-scattering methods for particle characterization, particle analysis in high-concentration protein solutions, particle formation, particle size and distribution analysis, submicron particle characterization, subvisible particle characterization
INTRODUCTION
Soluble proteins exist as physically fragile macromolecules (1) that are colloidal dispersions in solution. As a result of their marginal stability, proteins are prone to unfolding, aggregation, and particulate formation in response to physical stresses (thermal, agitation, and freezing) encountered among the numerous routes of degradation. A protein’s propensity to form particulate matter may be affected by a combination of its surface active characteristics and its structural and colloidal stability (2,3). Presently however, most aspects of protein particulate in biopharmaceutical drug products are not fully understood. The formation mechanisms, mitigation or control strategies, product safety impact, and methods for their thorough characterization have not yet been completely defined.
The analysis of particulates has been a longstanding challenge in biopharmaceutical drug product development and quality control. Existing analytical methods were originally developed to measure levels of foreign particulate matter. In biopharmaceutical products, degradation of the active product ingredient (API) can also lead to particulate matter, confounding the analysis of foreign particulate matter. More importantly, the protein particulate matter adds complexity with a heterogeneous population of sizes, morphologies, and a potential impact to product safety. The new challenge, recently posed by regulatory direction and academic research (4), is to improve upon existing methodologies (Table I) to measure subvisible particulate (SbVP) at a size of ≤10 μm. A limited number of methods have been expressly developed for particle characterization in biopharmaceutical products, and even fewer have been validated for quality control in accordance with good manufacturing practices. Of this select group, the methods are currently used only for particles with diameters of >10 μm.
Table I.
Instruments and Manufacturer Specifications for Particle Sizing/Counting Measurements
| Method | Manufacturer | Capabilities | ||
|---|---|---|---|---|
| Size range | Max count | Volume required | ||
| (μm) | (#/mL) | (mL) | ||
| Light obscuration | HIAC-Royco | 2–100 | 18,000 | 5 |
| MFI—high magnification | Brightwell | 0.75–100 | 825,000 | 2 |
| MFI—low magnification | Brightwell | 2.25–400 | 275,000 | 1 |
| Coulter–Counter | Beckman Coulter Instruments | 0.4–12, 2–60 | 1 × 10⁶ | 10 |
| Laser diffraction | Particle Measuring System | 0.02–2.0 | 10,000 | 5 |
| Microtrac Bluewave | 0.1–2.0 | N/A | 7 | |
| Beckman Coulter LS320 | 0.04–2.0 | N/A | 10 | |
| DLS | Brookhaven Instruments | 0.01–4.0 | N/A | 0.5 |
| Wyatt Technology, Dynapro | 0.002–1.0 | N/A | 0.05 | |
| Backscatter DLS | Microtrac Nanotrac | 0.001–6.5 | N/A | 0.5 |
MFI micro-flow imaging, N/A not applicable, DLS dynamic light scattering
Many analytical methods and instruments can measure the size, distribution, number per unit volume, composition, and other subvisible particle characteristics (5), but most have been developed for a set of ideal instrument- and technique-specific analytical conditions. Despite the variety of techniques available to measure particle sizes and counts, most impose constraints that limit their utility to analyze particles in solution suspensions. Some techniques are applicable only to powders and aerosols, while others, such as acoustic methods, require detailed knowledge of numerous system parameters. Other techniques such as size exclusion chromatography (SEC), hydrodynamic chromatography, and scanning or transmission electron microscopy involved additional manipulation of the sample. Among the least-intrusive techniques are those based on light scattering. In particular, small-angle scattering of X-rays and neutrons, dynamic light scattering, Rayleigh scattering, Lorenz–Mie scattering, Frauenhofer diffraction, and microscopy have well-documented applications for particle characterization of different size ranges (5). Unfortunately, no single technique can provide complete and accurate information about particle sizes and counts over the entire size range of interest (1–105 nm), and each technique has strengths and limitations. Most techniques, including the light scattering methods, perform best for systems of well-defined particle characteristics (spherical shape, uniform density, high contrast/refractive index, etc.), and thus instrument performance characteristics are often established with polystyrene (PS) bead size and/or count standards.
Biotherapeutic protein solutions, for a number of reasons, are systems that challenge the capability of currently available particle sizing and counting instruments. The solutions consist of surface-active components and also have a variety of viscosity, density, and refractive index modifying cosolutes and API. As the analyte of interest, protein particulate matter can be very morphologically heterogeneous compared with the PS beads. Protein-based particulate matter is often at very low levels, and the low mass fraction of particulate is very difficult to quantify as losses at high protein concentrations.
High-concentration protein solutions pose additional challenges to particulate analysis because of the physical properties of the solution and the often-limited sample volumes. The optical properties of these solutions may pose contrast issues for most optical or light-based methods of particle characterization, and more viscous solutions can also pose flow/analysis interference issues as well.
Progress in the characterization of particulates in biopharmaceuticals is further limited by the lack of a representative protein particulate reference sample as a relevant control to determine instrument performance. This is usually due to the morphological and size heterogeneity as well as potential instability of protein particulate matter (6,7). A stable model protein-particulate sample that could be used to evaluate the different characterization techniques and the performance of instrumentation is therefore highly desirable. Using a system that readily forms protein particulate under stress conditions, we employed various techniques to characterize this material. We used a two-pronged approach to determine the feasibility of characterizing SbVP matter in high-concentration protein solutions. Optical methods such as flow microscopy and light obscuration were used to detect and quantify particles with sizes of >1 μm. Using light scattering methods such as turbidity at 350 nm, static and dynamic light scattering, and laser diffraction, we investigated the possibility of obtaining more information on subvisible and submicron (<1 μm) particle populations present in the solutions as well. In this initial work, we evaluated a model system for protein particulate to investigate the impact of different sample handling methodologies for subvisible particle characterization. We also compared several techniques for characterizing subvisible and submicron particulate matter in concentrated protein solutions, in an attempt to discern some of the limitations associated with current analytical technologies.
MATERIALS AND METHODS
High-Concentration Antibody Solutions
High-concentration protein solutions consisting of an IgG4 antibody (MAb-A) at 150 mg/mL in 20-mM histidine buffer (pH 5.7) without additional stabilizers were used for the generation and analysis of protein particulate matter. The particulate matter was generated from 20 mL of the MAb-A material by horizontal agitation at 70 oscillations/min at room temperature for a period of up to 72 h in 50-mL type-1 glass vials with 20-mm Daikyo Flurotec stoppers. The dense protein particulate suspension produced after 48-h agitation was divided into aliquots in 2-mL glass vials and stored at −70°C until use. Prior to use, aliquoted samples were thawed at room temperature and degassed with transfer/sample handling steps conducted in a laminar flow hood.
An IgG1 (MAb-B) was formulated (100 mg/mL with buffer, disaccharide, and surfactant) for use as a matrix for PS latex particle standards that are used to assess the methods of particle analysis.
SEC Analysis
The aggregate, monomer, and fragment for MAb-A were determined by using an Agilent 1100 HPLC system and TSKgel G3000SWXL (7.8 mm ID × 30 cm 5 μm) column (Tosoh Bioscience LLC, King of Prussia, PA). The protein was eluted at ambient temperature using an isocratic flow rate of 0.5 mL/min of mobile phase for 30 min. The mobile phase contained 0.45 M phosphate salts at pH 6.2. The UV absorbance at 280 nm was used to detect and quantify the eluted protein. Injections of 25 μL were made with samples diluted to 2.5 mg/mL in mobile phase.
Degassing Procedure
The use of vacuum exposure as a degassing procedure to minimize the impact of entrained air bubbles on characterization was investigated. To determine the effect of degassing duration on particle counts, one sample, which was prepared as a 20-fold dilution of the agitated MAb-A sample, was divided equally among several test tubes for micro-flow imaging (MFI) measurement as a function of degassing time and time between preparation and measurement. Samples were placed into the vacuum chamber together and measured immediately after the degassing intervals of 5, 10, and 50 min. Prior to analysis, all solutions were gently swirled just to mitigate the potential effects of particle settling. Other methods for air bubble removal were investigated, including the use of ultrasonication and the addition of ethanol or 1% formaldehyde.
Polystyrene Particle Standards
The investigations used freshly thawed agitation stressed MAb-A material and surrogate protein of concentrated MAb-B solutions spiked with PS beads of known sizes. PS particle count standards were obtained as suspensions in water for 2-, 5-, and 10-μm particles at 3,000 ± 300 particles/mL from Duke Scientific Corp. (Palo Alto, CA, USA). PS size standards with 20-, 100-, 560-, 980-, and 1,000-nm sizes were obtained as 1% (w/v) suspension in water.
Instrumentation and Techniques for Characterization
The techniques used to characterize subvisible and submicron particulate in the high-concentration protein solution included SEC, turbidity measured as an absorbance average at 350 nm, light obscuration, flow microscopy, UV–vis spectrophotometry, dynamic light scattering, Coulter counting, and laser diffraction. See Table I in the ELECTRONIC SUPPLEMENTARY MATERIAL (ESM) for a summary of instrumentation utilized. Though not evaluated as part of these initial studies, the standard deviations of SbVP methods for particles of >2 μm determined for MAb-A solutions that have been typically found are provided as an estimate of potential variability of data presented here: ±1,000 counts/mL (HIAC-Royco), ±1,700 counts/mL (MFI), ±2,000 counts/mL (Coulter Counter, small volume), and for UV–vis turbidity ±0.01 AU (A350).
RESULTS AND DISCUSSION
Model Protein Particulate System
Particulate formation in protein solutions resulting from agitation stress is commonly observed and often provides the rationale for selecting surface active agents, such as polysorbate or copolymer surfactants as additives in biopharmaceutical drug product formulations. The initial objective of this work was to generate a protein particle reference standard using an IgG4 monoclonal antibody, which at high concentrations and in the absence of surfactants was sensitive to agitation stress, forming high levels of particulate matter. Figure 1a in the ESM shows the progressive changes in the appearance of the protein solution as a function of agitation time. Using MFI (high magnification) analysis of this material confirmed that high levels of particulate matter were generated (Fig. 1b in the ESM). The characterization of soluble high-molecular weight species and insoluble aggregates by SEC and turbidity <A350>, respectively, also showed that both species increased as a function of agitation time. After intervals of 14, 24, and 72 h of agitation, samples had soluble aggregate levels of 5%, 6.5%, and ∼24%, respectively, with turbidity values that increased from an initial value of 0.3% to a final level of ∼3.5 absorbance units (AU).
We identified several challenges and caveats regarding the preparation and use of this protein-based particulate system as a reference standard for SbVP characterization, including air bubble interference, dilution and handling effects, and the instability of the formed particles.
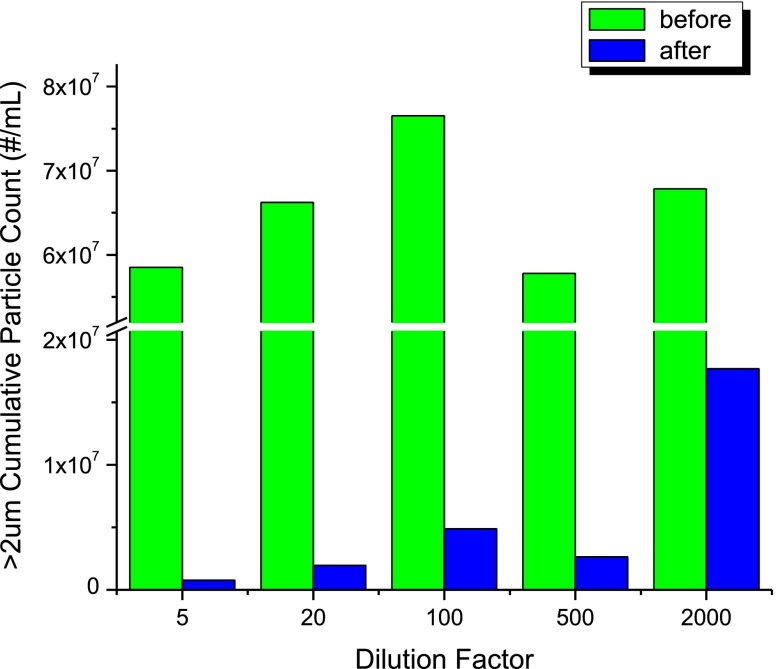
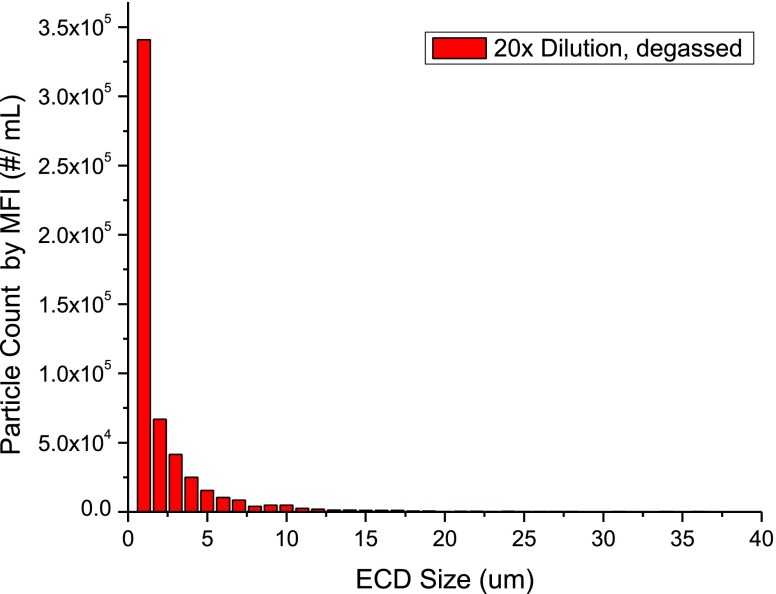
Proteins, as surface active species in aqueous solutions, foam easily and at higher concentrations entrain air bubbles that are small enough to persist for a long period of time. Because they are difficult to distinguish from particulate matter during software-automated image analysis, air bubbles can contribute to the total particles counted. The effect of degassing duration on the total particle counts was investigated using material stressed by agitation for 2 days diluted 20-fold with formulation buffer. Initial particle counts using microscope flow imaging for the solution without degassing were ∼6 × 10⁷ particles/mL, while degassing for 10 min reduced the counts by more than an order of magnitude to ∼1.3 × 10⁶ particles/mL as shown in Fig. 1. We observed a much smaller decrease in particle counts as a function of degassing times from 5 to 50 min (Fig. 2 in the ESM). Subsequent experiments, also discussed below, determined that the count decrease observed between 5 and 50 min of degassing was not attributable to improved removal of air bubbles from the 20-fold diluted solution. After degassing for 10 min, a typical MFI particle distribution (Fig. 2) for the stressed-antibody sample showed a bias toward smaller particulate matter, with numbers of particles increasing exponentially for diameters smaller than 10 μm. Although the agitation-stressed solutions present an extreme example, the higher viscosities of concentrated protein solutions also can contribute, retaining or trapping air bubbles for long periods of time. Even simple forms of sample handling, such as syringe dispensing or pipetting, may introduce air bubbles into the sample. Thus, degassing prior to sample analysis for particulate appears critical to obtaining reliable and reproducible results. A degassing time of 10 min was applied to all subsequent sample preparations in the following sections. To minimize the interference of air bubbles in SbVP measurements, the appropriate degassing interval should be evaluated and optimized for each new solution composition or each sample type.
Fig. 1.
Total particle counts of >2 μm by microscope flow imaging (high magnification) corrected for dilution factor as a function of dilution factor before (green bars) and after (blue bars) a 10-min vacuum degassing procedure applied to the samples (agitated for 48 h)
Fig. 2.
Equivalent circular diameter (ECD) particle size vs. Particle count. Typical particle size distribution observed for agitation-stressed MAb-A with microscope flow imaging (high magnification). Sample was diluted 20-fold in buffer before measurement
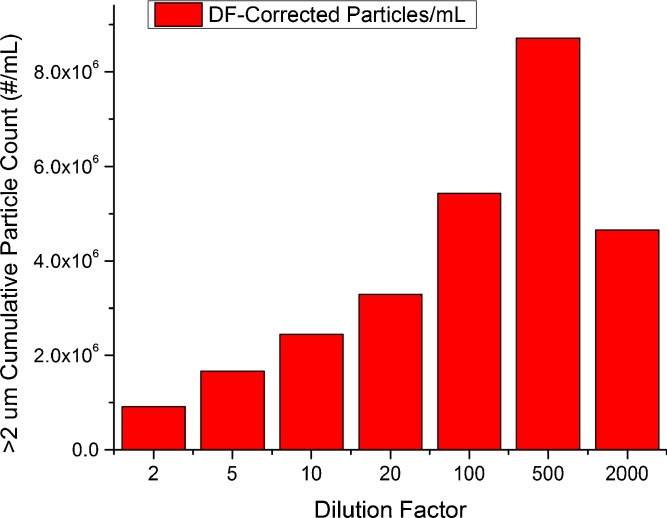
Even with appropriate degassing, MAb-A particle counts showed evidence of increase at greater dilution (with formulation buffer) when corrected for dilution factor. Additional measurements of subvisible particle counts as a function of dilution factor (Fig. 3) showed that greater dilution dramatically increased the particle counts per unit volume. Repeated experiments verified this trend, although absolute particle counts were inconsistent between different experiments conducted similarly (Figs. 1 and 3). Although the numerical results for total particle counts remained difficult to reproduce, they suggest that the agitation-stressed MAb-A particulates were not stable and could be increased by dilution. Several hypothesis can be put forth to explain these observations; including sampling heterogeneity, particulate formation as a result of dilution osmotic shock in absence of surfactant (note that the presence of surfactant may have ramifications as well) or an improved sample contrast factor due to dilution, which enables greater detection. Irrespective of any underlying cause, the data indicate that the effects of sample dilution and diluent composition on SbVP analytical results and response linearity should be determined before use, as part of method development. Subvisible particle analysis of undiluted samples may be considered preferable in order to minimize the impact of sample handling whenever possible.
Fig. 3.
Subvisible particle count in agitation-stressed (48 h) MAb-A using microscope flow imaging (high magnification), total particle counts as a function of stock solution dilution factor. DF dilution factor, MFI microscope-flow imaging
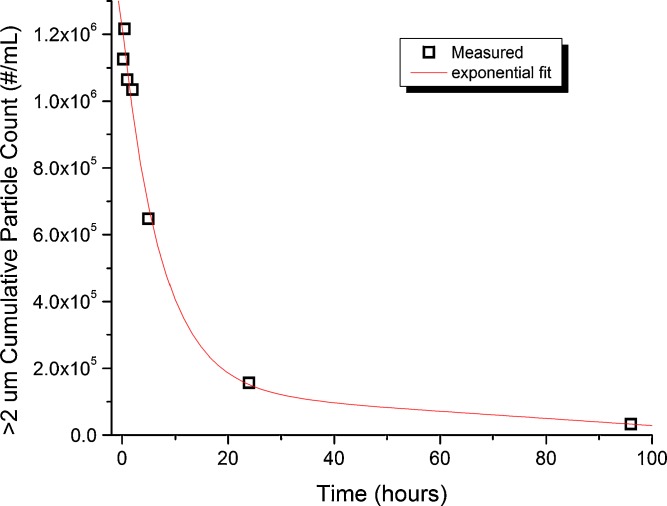
The stability of particulate levels as a function of handling time at ambient room temperature for MAb-A samples was also considered. Particle count and size measurements were made with high-magnification MFI over a 72-h period after preparation as shown in Fig. 4. The changes observed in the first hour are consistent with the magnitude of particle number decrease seen with extended (>10 min) degassing times. Total particle counts decreased rapidly from >1.2 × 10⁶ to <2 × 10⁵ particles/mL within the first 24 h, decreasing more gradually thereafter. Particle size distributions remained unchanged as function of time (as in Fig. 2), suggesting that the aggregated protein species were distributed in a homogenous way throughout the particulate population. The data in Fig. 4, along with the visual observation of aged samples inverted to re-suspend any settled particulates (no change from non-inverted), demonstrate that agitation-induced particles were unstable and capable of returning to more soluble forms. This reversibility of MAb-A particulate suggests a low degree of unfolding or weak cohesion between aggregate species that did not prevent re-solubilization and/or refolding of the protein in agitation stressed samples. Some important additional sample handling features to consider (though not evaluated here) for a protein particulate standard include; freeze thaw stability, particulate settling, and vial-to-vial variability. Clearly, evaluation of sample homogeneity and stability during the storage and analysis interval can be critical for robust analytical method development for subvisible particulate levels for both protein-based reference standards and sample solutions.
Fig. 4.
Total subvisible particle counts by microscope flow imaging (high magnification) of MAb-A agitation-stressed samples (48 h) diluted 20-fold in buffer and degassed for 10 min, as a function of storage time at room temperature. Particulate level changes observed over short durations are consistent with data shown in Supplemental Fig. 2 in the ESM
Recognizing the limitations of agitation stress-induced MAb-A particulate materials, we also searched for methods that could improve the stability of the formed particles. These efforts included the addition of ethanol as a non-solvent/denaturant, use of ultrasonication, (neither of which had the desired effect) and the addition of formaldehyde to crosslink protein particles. Attempts to crosslink protein particulate were made by adding formaldehyde to the diluted (20-fold) suspensions. 1% to 10% formaldehyde solutions were used without achieving the desired room-temperature stability of crosslink MAb-A particles. The lack of success cross-linking the agitation -induced protein particles may be attributed to the relatively high remaining concentration of soluble protein, and the lower efficiency of heterogeneous phase reactions. Moore et al. confirmed the difficulty of stabilizing protein aggregates by cross-linking agents (8). They found that transglutaminase catalyzed covalent crosslink formation more effectively than between nascent protein molecules. Thus, generation of a stable sample of protein particulate or aggregate species is not unique to monoclonal antibodies, but presents a more general technical challenge. While the particulates formed by agitation stress of MAb-A were found to be reversible, other types of stress-induced protein particulate (i.e., thermal or shear induced) may result in a more stable sample of protein for particulate characterization.
Subsequent investigation of instruments to characterize subvisible and submicron particulates in protein solutions relied on the use of freshly thawed and degassed MAb-A particulate suspension aliquots or a model system consisting of MAb-B solutions spiked with PS beads of known sizes.
Measurement of Subvisible and Submicron Particulate Using Scattering Methods
Optical measurement methods, including MFI and the HIAC Liquid Particle Counting System, have size resolution limitations that preclude reliable determination of particulate sizes of <1–2 μm in mean spherical diameter. Nevertheless, when these techniques are employed to measure protein samples, they frequently indicate that the number of particles with diameters of <10 μm increase most dramatically as the limit of 1–2 μm diameter is approached (for example, see Fig. 2). This common observation suggests that the distribution of particle sizes extends below 1 μm, leaving an obvious gap in the minimum characterization of what sizes and quantities are present in the submicron size range of 10–1,000 nm. We present an initial evaluation of the techniques currently available to address this gap in protein solution and particulate analysis. We consider the use of a spectrophotometer for turbidity measurements, laser diffraction instrumentation, and dynamic light scattering instrumentation as methods for the detection or characterization of submicron particles.
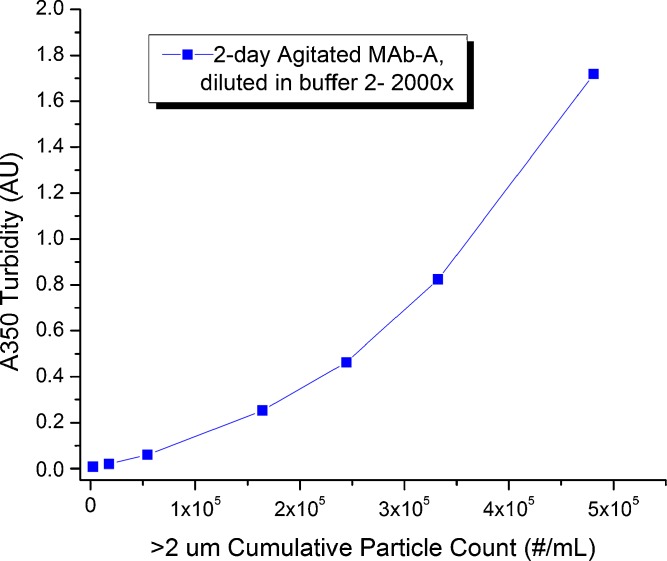
Turbidity measurements as described here rely on the use of the common UV–vis spectrophotometer. Turbidity is defined as the reduction in transmitted intensity in the forward direction, measuring the combined effects of light absorption and scattering. The measurements can be wavelength specific, either over 340–360 nm at 5-nm intervals and averaged to obtain <A350> or reported for a single wavelength such as A690. Current common practice is to use turbidity as a relative and qualitative monitor of changes in sample physical stability and the propensity to form particulates. We characterized the relationship between protein subvisible particulate counts (obtained from dilution) and <A350> for the agitation-stressed MAb-A sample. A strong correlation exists between <A350> and the number of SbVPs determined by high-magnification MFI, although this relationship is non-linear (Fig. 5). Potential factors contributing to the non-linearity were further explored by using submicron PS bead standards (diameters, 20–980 nm) diluted in buffer, to provide insight into the relationship between particle size, mass fraction, and absorbance values.
Fig. 5.
Correlation between subvisible particle count values by microscope flow imaging (high magnification) and turbidity values determined from the absorbance average <A350> for the agitation-stressed MAb-A sample diluted in buffer
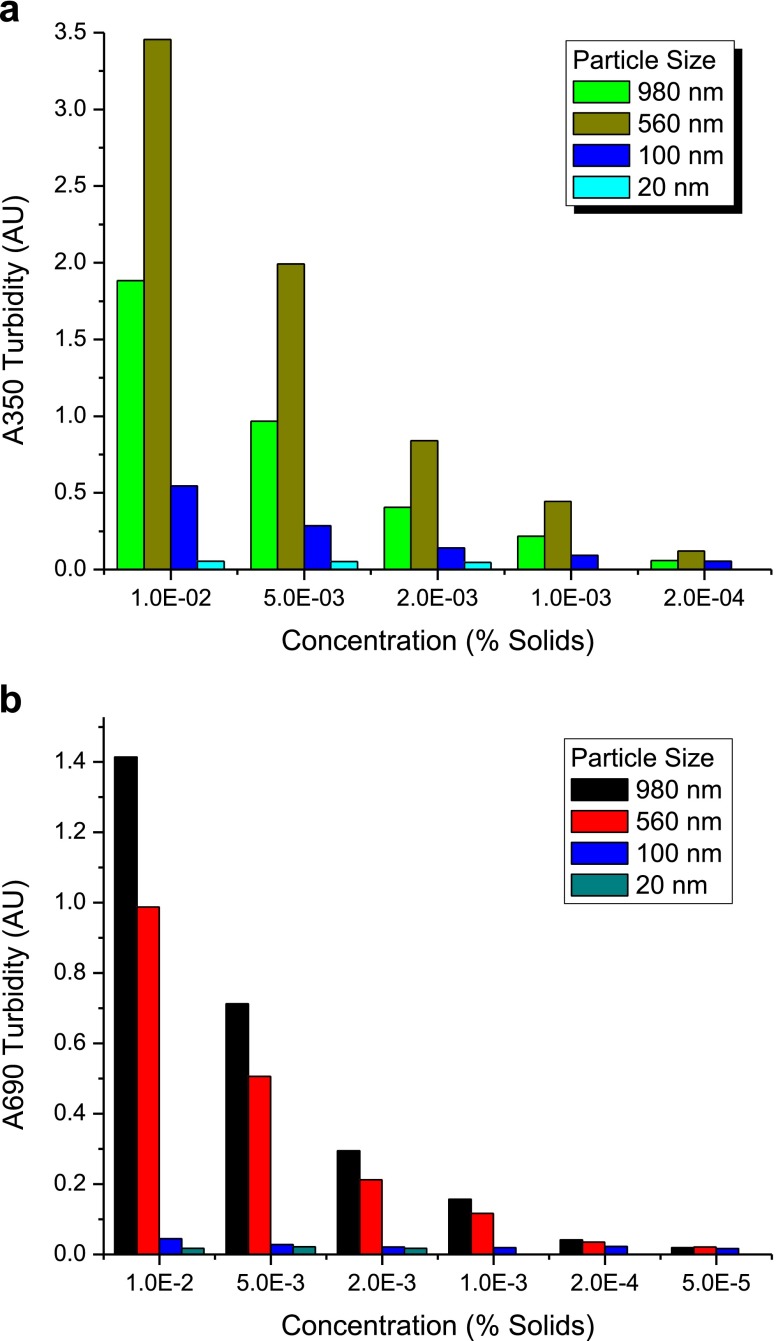
UV–vis spectra of the various PS bead standards, obtained as 1% w/v suspensions, were measured in a series with dilution factors ranging from 1 to 5 × 10⁵. An illustrative absorbance spectrum for 0.002% w/v suspensions in water of PS beads is shown in Fig. 3 in the ESM. Absorbance values at 350 and at 690 nm (a wavelength frequently used in laser diffraction and light scattering instrumentation) for different bead sizes were linear with particle concentration (Fig. 4 in the ESM). The dependence of the absorbance change with particle percent solids content is also dependent on the PS bead size. Used as a qualitative guide, analysis of the PS particle mean absorbance values at 350 nm (<A350>) as a function of PS bead size and PS particle concentration shows that <A350> is most sensitive to submicron particulates, with sensitivity decreasing from ∼560 > 980 > 100 > 20-nm diameter PS beads (Fig. 6a). At a wavelength of 690 nm the spectrophotometer sensitivity is greatest for the ∼1-μm diameter particles, and the sensitivity for particle sizes follows the order 980 > 560 > 100 > 20 nm (Fig. 6b). In mixtures of particles of different sizes, the deconvolution of wavelength dependence and scattering sources can become highly complex. In high concentration protein solutions, the protein absorbance band (peak at ∼280 nm) can have an increasing contribution to measurements such that <A350> values obtained consist of both absorbance and scattering effects. However, the utility of turbidimetric measurements comes from the ability to vary wavelength and to utilize shorter wavelengths to provide qualitative information about submicron particulate levels. Similar more sophisticated, measurements made with laser transmission spectroscopy suggest that substantial advances have been made in the potential use of wavelength dependent scattering phenomena for submicron particle characterization (9).
Fig. 6.
a A summary of particle size and weight fraction dependence of turbidity <A350> measurements. The turbidity assay shows good sensitivity for particles of >100 μm even at 0.0002 wt.% solids. b Particle size and weight fraction dependence of A690 turbidity measurements. The turbidity assay appears sensitive for particles of >500 μm even at 0.001 wt.% solids
Other light scattering methods have already been used to more specifically characterize suspended subvisible particle sizes and distributions. Instrumentation for dynamic light scattering (DLS) and Mie scattering/Frauenhofer diffraction methods are available through several manufacturers. We examined the ability of different instruments to characterize submicron particulate in protein solutions. The experiments did not employ consistent sample types for analysis, which we recognize as a shortcoming. This is partly because the samples, and thus the experiments also needed to be tailored to the specific instrument’s operational parameters. Nevertheless, the different sample types/experiments allowed us to observe and comment on some of the instrument limitations for protein particulate characterization. Instruments from Particle Measurement Systems, Inc. (Liquilaz 02; Boulder, CO, USA), Microtrac Inc. (Bluewave Particle Size Analyzer; Montgomeryville, Pennsylvania, USA), and Beckman Coulter, Inc. (LS320; Brea, California, USA) were evaluated.
The Particle Measurement Systems Liquilaz 02 is a diffraction instrument with a size detection range of 0.2–2.2 μm and count limit of 1.0 × 10⁴ particles/mL calibrated by flow rate/count standards. Initial evaluation utilized the 2-μm PS count standard (3,000/mL). We found measurements of both undiluted count standard and 4-fold diluted standard in water indicated a highly sensitive response to submicron particulate, but significantly under counted the 2.0-μm beads. Further testing with 0.98-μm and 0.56-μm PS beads size standards diluted 105- to 107-fold with 0.2-μm filtered aqueous buffer indicated that both size and count number results could be sample-concentration dependent and, in general, required high levels of dilution to fall within the instrument’s count limitation of <10,000/mL.
Evaluation of other laser diffraction instruments (Beckman–Coulter SL 13 320 and Microtrac, BlueWave particle Size analyzer) that have wide-size characterization capabilities were made with MAb-A samples at high concentrations. The results with both instruments suggested additional limitations of the current designs of laser diffraction instruments. Both instruments either required large sample volumes or used smaller volume containers (5–10 mL, which is still a large sample volume) with large glass cell windows, which were difficult to fill without introducing air bubbles. If filling could be accomplished without introducing air bubbles, additional air bubbles can form over time on the cell windows nonetheless, imparting artifacts to the data collected. In-cell degassing procedures could mitigate the air bubble issues, but the diffraction instruments also required a minimum of forward scattering intensity, and typical protein solutions in our experience do not scatter light sufficiently for reproducible measurements.
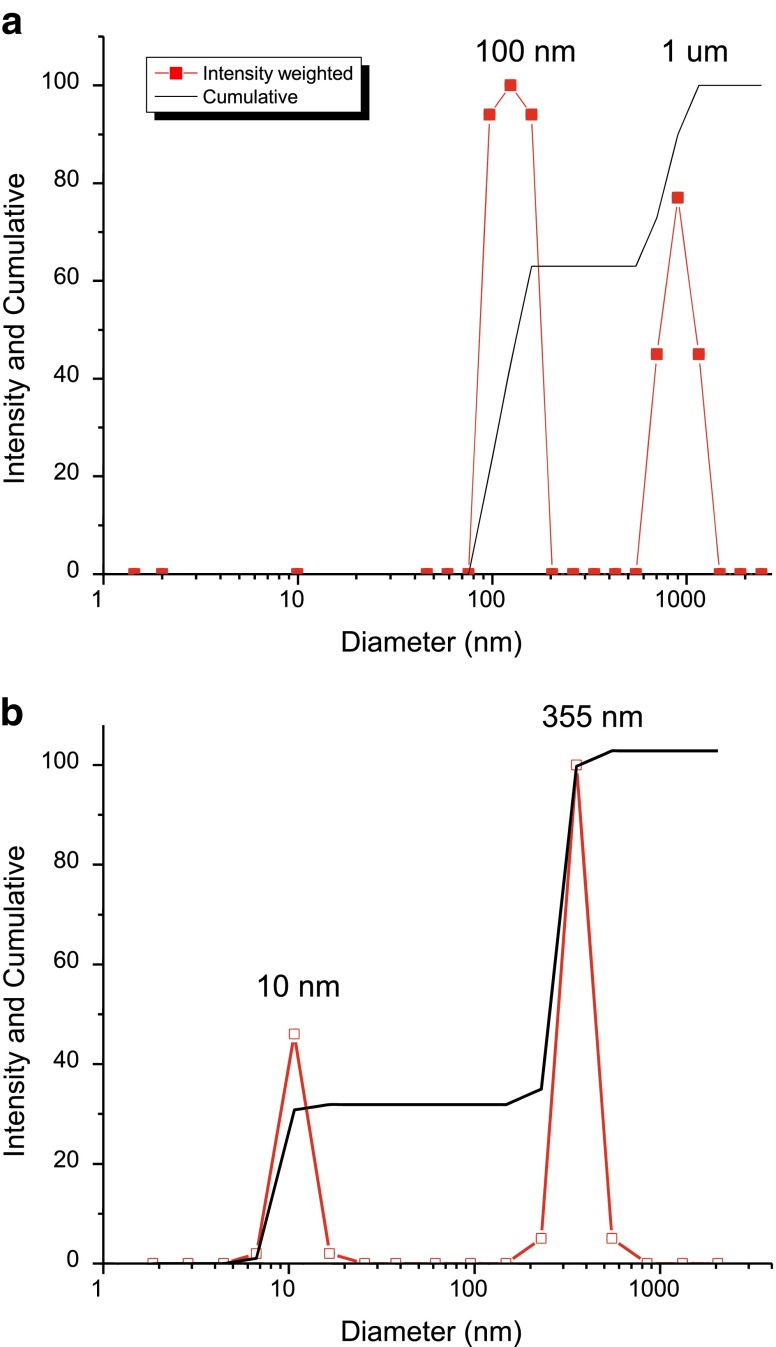
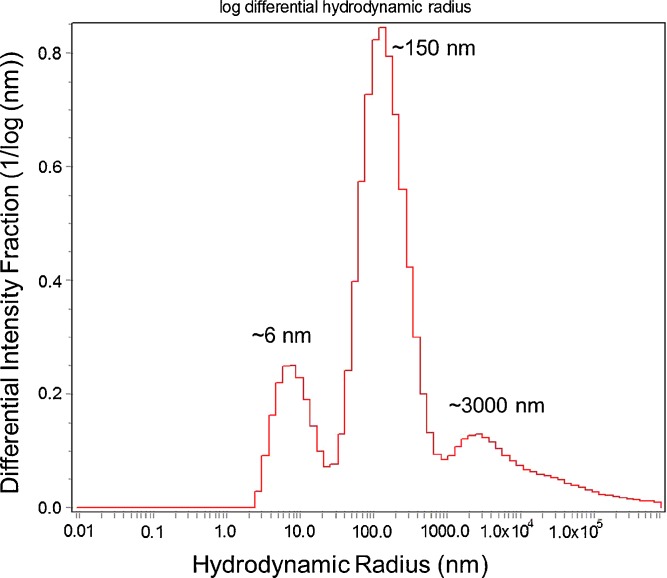
Both transmission and backscattering dynamic light scattering instruments were investigated as a method of characterizing subvisible and submicron particles. One advantage of the DLS instruments is that they are generally designed for making measurements on small sample volumes of 0.02–1 mL, and are therefore well suited for characterization of typical protein samples. However, some of the well-known limitations of DLS were also apparent when investigating PS size standard suspension mixtures, or PS size standards spiked into 100 mg/mL antibody solutions (Dh, ∼10–12 nm). When two PS particle size standards, different by an order of magnitude, were analyzed by DLS in aqueous buffer, they could be resolved as two separate species in suspension. However, due to the logarithmic form of auto-correlation functions, even monodisperse PS particle species with a 3-fold difference in diameter cannot be reproducibly resolved with correct sizes (5). When PS particles (0.001% solids) were spiked into 100 mg/mL MAb-B solutions, 100-nm size standards were characterized as 350-nm particles due to changes in the solution viscosity (Fig. 7). Additional knowledge of the bulk solution viscosity would be required to accurately size even mono-disperse species in concentrated protein solutions, due to the inverse dependence of particle diffusion and hydrodynamic size determination on solution viscosity in the Stokes–Einstein equation. In some instances, this may also be used to an advantage (10). Similar experiments with backscatter DLS instrumentation (Microtrac Nano) showed that although 980-nm sized PS beads were detected, smaller-sized components (10-nm monoclonal antibody or 50-nm PS beads in high-protein concentration solutions were not resolved or detected. The sensitivity of the backscattering DLS (Microtrac, Nanotrac) instrumentation is inherently biased toward the more strongly scattering large particulate/species due to the low angle of back scattering observation. Conversely, experiments with PS beads spiked in high-concentration protein solution or buffer with a WTC Dynapro DLS system designed for dilute protein solutions, showed that the samples required significant dilution to avoid auto-correlator signal saturation caused by the high protein or PS size standard concentrations. After a 1,000-fold dilution, analysis of the agitation-induced MAb-A particulate provided a picture of a complex sample (similar results were produced across sample dilutions of 20- to 500-fold) as shown in Fig. 8. Soluble protein components and apparent multiple distributions of particle sizes were observed in the intensity-weighted scattering data as a function of hydrodynamic radius. For polydisperse systems the limitation in DLS peak resolution can be on the order of 10x diameter as seen in Fig 8, but whether multi-modal distributions reflect real submicron and subvisible populations in the protein solution must be questioned. Although the reproducibility of DLS measurements has been demonstrated with monodisperse systems, results from polydisperse samples have been previously shown to be much less accurate and reliable (5). Even ideal spherical particles prepared from two mono-disperse synthetic latexes yield results for particle sizes, distributions, and percent composition that can vary considerably between laboratories and instruments (11,12).
Fig. 7.
a Dynamic light scattering characterization (Brookhaven BI-200SM) of a sample containing equal weight fractions of 100 and 980 nm PS bead size standards, successfully resolving particle species with a different size by a factor of 10-fold. b DLS characterization of 100 nm PS bead size standard in a 100-mg/mL protein solution using. Diffusion of the larger species was influenced by the greater bulk viscosity of the high concentration MAb-B solution, producing a 3-fold larger-than-expected diameter for the PS beads. PS polystyrene
Fig. 8.
Example of histograph results from experiments with WTC Dynapro on a highly diluted sample (1,000-fold dilution) of agitation-stressed MAb-A, indicating multimodal populations of species
The evaluation of a number of dynamic light-scattering instruments determined that different instrument designs can have biases in sensitivity towards larger or smaller scattering species. At the same time, all dynamic light scattering instruments have limited resolution of particle sizes within one order of magnitude difference in diameters, as the exponential autocorrelation functions cannot be sufficiently deconvoluted to identify similarly sized species or populations of particles. Whether DLS results with multimodal distributions of species can be interpreted as accurate representations of components in protein solutions requires further careful evaluation. Such complex multimodal results from dynamic light scattering instrumentation clearly stimulate discussion about the particulate species present in the sample, but also underscore the need for orthogonal approaches to subvisible and submicron particulate characterization to verify the conclusions drawn from any particular method.
CONCLUSIONS
The issues and challenges of subvisible particle characterization in protein solutions comprise both sample handling and instrumental limitations. Sample handling can affect the results of analytical characterization of particulate matter in protein solutions. The work to develop a protein-based reference standard for subvisible particulate measurements described here represent our initial attempts only, but serve to underscore the need for careful characterization and method development to include all aspects of sample handling and stability. In general, we found that the adaptation of samples to instrument capabilities to be problematic. Under ideal circumstances the samples for SbVP characterization should not be modified and preferably have minimal handling prior to measurements, however, this may be required due to specific sample requirements for different technologies.
We conclude that currently available methods are not capable of unambiguously quantitating SbVP matter present in protein solutions (13). Future instrumentation for subvisible and submicron particulate quantification and characterization should be designed considering the complexity of protein solutions and need for minimal sample manipulations. Until then, it seems necessary to pursue analytical characterization of SbVP matter with multiple orthogonal methods, with the results remaining closely identified with the method used to obtain them. We remain optimistic about the development of new instruments, technologies, and methods to characterize subvisible and submicron particulate matter in the future, as the biopharmaceutical industry strives to follow guidelines and meet regulatory requirements.
ELECTRONIC SUPPLEMENTARY MATERIAL
Below is the link to the electronic supplementary material.
(DOC 949 kb)
ACKNOWLEDGMENTS
Drs. Jun Liu and Barthelme Demeule are gratefully acknowledged for helpful discussions and insights.
REFERENCES
- 1.Taverna DM, Goldstein RA. Why are proteins marginally stable? Proteins. 2002;46:105–109. doi: 10.1002/prot.10016. [DOI] [PubMed] [Google Scholar]
- 2.Chi EY, Krishnan S, Randolph TW, Carpenter JF. Physical stability of proteins in aqueous solution: mechanism and driving forces in nonnative protein aggregation. Pharm Res. 2003;20(9):1325–1336. doi: 10.1023/A:1025771421906. [DOI] [PubMed] [Google Scholar]
- 3.Chi EY, Krishnan S, Kendrick BS, Chang BS, Carpenter JF, Randolph TW. Roles of conformational stability and colloidal stability in the aggregation of recombinant human granulocyte colony-stimulating factor. Protein Sci. 2003;12(5):903–913. doi: 10.1110/ps.0235703. [DOI] [PMC free article] [PubMed] [Google Scholar]
- 4.Carpenter JF, Randolph TW, Jiskoot W, Crommelin DJ, Middaugh CR, Winter G, et al. Overlooking subvisible particles in therapeutic protein products: gaps that may compromise product quality. J Pharm Sci. 2008;98(4):1201–1205. doi: 10.1002/jps.21530. [DOI] [PMC free article] [PubMed] [Google Scholar]
- 5.Xu R. Particle characterization: light scattering methods. Boston: Kluwer; 2000. [Google Scholar]
- 6.Wang W. Protein aggregation and its inhibition in biopharmaceutics. Int J Pharm. 2005;289(1–2):1–30. doi: 10.1016/j.ijpharm.2004.11.014. [DOI] [PubMed] [Google Scholar]
- 7.Lee H, Kirchmeier M, Mach H. Monoclonal antibody aggregation intermediates visualized by atomic force microscopy. J Pharm Sci. 2011;100(2):416–423. doi: 10.1002/jps.22279. [DOI] [PubMed] [Google Scholar]
- 8.Moore BD, Rangachari V, Tay WM, Milkovic NM, Rosenberry TL. Biophysical analyses of synthetic amyloid-beta(1–42) aggregates before and after covalent cross-linking. Implications for deducing the structure of endogenous amyloid-beta oligomers. Biochemistry. 2009;48(49):11796–11806. doi: 10.1021/bi901571t. [DOI] [PubMed] [Google Scholar]
- 9.Li F, Schafer R, Hwang CT, Tanner CE, Ruggiero ST. High-precision sizing of nanoparticles by laser transmission spectroscopy. Applied Optics. 2010;49:6602–6611. doi: 10.1364/AO.49.006602. [DOI] [PubMed] [Google Scholar]
- 10.He F, Becker GW, Litowski JR, Narhi LO, Brems DN, Razinkov VI. High-throughput dynamic light scattering method for measuring viscosity of concentrated protein solutions. Anal Biochem. 2010;399(1):141–143. doi: 10.1016/j.ab.2009.12.003. [DOI] [PubMed] [Google Scholar]
- 11.Finsy R, de Jaeger N, Sneyers R, Geladé E. Particle sizing by photon correlation spectroscopy. Part III: mono and bimodal distributions and data analysis. Part Part Syst Char. 1992;9(1–4):125–137. doi: 10.1002/ppsc.19920090117. [DOI] [Google Scholar]
- 12.Finsy R, Deriemaeker L, De Jaeger N, Sneyers R, Vanderdeelen J, Van der Meeren P, et al. Particle sizing by photon correlation spectroscopy. Part IV: resolution of bimodals and comparison with other particle sizing methods. Part Part Syst Char. 1993;10(3):118–128. doi: 10.1002/ppsc.19930100304. [DOI] [Google Scholar]
- 13.Barthelemy Demeule SM, Shire SJ, Liu J. Characterization of particles in protein solutions: reaching the limits fo current technologies. AAPS J. 2010;12(4):708–715. doi: 10.1208/s12248-010-9233-x. [DOI] [PMC free article] [PubMed] [Google Scholar]
Associated Data
This section collects any data citations, data availability statements, or supplementary materials included in this article.
Supplementary Materials
(DOC 949 kb)


