Abstract
Basal cell carcinoma (BCC) is the most common cancer in the U.S. Dermatoscopes are devices used by physicians to facilitate the early detection of these cancers based on the identification of skin lesion structures often specific to BCCs. One new lesion structure, referred to as dirt trails, has the appearance of dark gray, brown or black dots and clods of varying sizes distributed in elongated clusters with indistinct borders, often appearing as curvilinear trails. In this research, we explore a dirt trail detection and analysis algorithm for extracting, measuring, and characterizing dirt trails based on size, distribution, and color in dermoscopic skin lesion images. These dirt trails are then used to automatically discriminate BCC from benign skin lesions. For an experimental data set of 35 BCC images with dirt trails and 79 benign lesion images, a neural network-based classifier achieved a 0.902 area under a receiver operating characteristic curve using a leave-one-out approach, demonstrating the potential of dirt trails for BCC lesion discrimination.
Index Terms: Basal Cell Carcinoma, Image analysis, Dirt Trails, Neural Network, Dermoscopy
I. INTRODUCTION
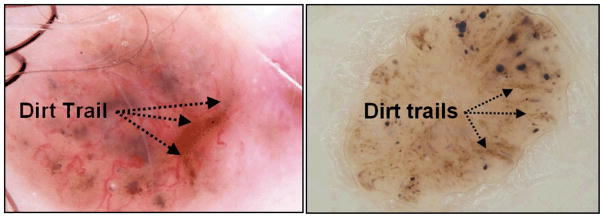
Basal cell carcinoma (BCC), a slowly growing skin malignancy, is the most common cancer, with an estimate of 3 million new cases annually in the US [1]. To allow early detection of these skin cancers, physicians employ a device called a dermatoscope (3Gen LLC, San Juan Capistrano, CA; Heine Optotechnik, Herrsching, Germany). Classic basal cell carcinoma structures, visible and measurable with the dermatoscope, have been summarized by the BASAL acronym: Blue-gray ovoids and globules, Arborizing telangiectasia, Semitranslucency/Spoke wheel structures, Atraumatic ulcerations, and Leaf-like structures [2]. One newly described feature is brown to black dots/globules, which were found in 132 cases (21.7%) of a series of 609 basal cell carcinomas [3]. The distribution of these tiny pigmented structures has not been previously characterized. In one series of 351 basal cell carcinomas in a previous study, we found 46 cases (13.1%) of 351 BCCs to have the appearance of dark gray, brown or black dots and clods of varying sizes distributed in elongated clusters with indistinct borders, often appearing as curvilinear trails. These clustered objects may be characterized as dirt trails. Figure 1 gives two examples of dirt trails present in dermoscopy skin lesion images. In this research, we explore a dirt trail detection and analysis algorithm for extracting, measuring, and characterizing dirt trails based on size, distribution, and color in dermoscopic skin lesion images. These dirt trails are then used to automatically discriminate basal cell carcinoma from benign skin lesions. The following sections of the paper include: II. Methodology, III. Experimental Results, IV. Conclusion, and References.
Figure 1.
Dirt trail examples in dermoscopic skin lesion images, shown by arrows, with dirt trails containing dots and clods of varying sizes.
II. METHODOLOGY
1. Data Set Description
The image set used for this study includes contact, non-polarized dermoscopic images of 35 basal cell carcinomas (BCCs) with dirt trail areas and 79 non-BCC benign lesions collected from two clinics: The Dermatology Center, Rolla, Missouri; and Skin and Cancer Associates, Plantation, Florida. All lesions with any dermoscopy features of malignancy and any benign lesions for which there was any uncertainty were biopsied. All images were contact, non-polarized dermoscopy images taken with a Sony DSC-W70 7.2 megapixel digital camera with a 3Gen DermLite Fluid dermoscopy attachment (3Gen LLC, San Juan Capistrano, CA). The 79-image competitive set to which the BCC set was compared consisted of a variety of lesions encountered in the clinic during the same period in which the BCC images were acquired, included 38 actinic keratoses (pre-cancers), 15 acquired nevocellular nevi (benign moles), 9 cases of sebaceous hyperplasia, and 15 cases of other benign diagnoses.
2. Dirt Trail Detection Algorithm Overview
An overview of the dirt trail detection algorithm is given in Figure 2. First, for the dermoscopy image data set, the individual red, green and blue (R,G,B) color planes were used for skin lesion analysis. Next, a Gaussian bandpass filter was applied to each color plane. To find the small dirt trail dots and clods, the bandpass-filtered image was next subtracted from each 3x3 median-filtered image. A scalarized Otsu threshold was then applied, followed by hair and bubble noise filtering. Features were determined for the resultant objects remaining in the mask. A backpropagation neural network using a leave-one-out method was applied to these features to determine presence or absence of dirt trails. The dirt trail detection algorithm, feature extraction and lesion discrimination are presented in detail in sections II.3 and II.4, respectively.
Figure 2.
Overview of the dirt trail detection algorithm.
3. Dirt Trail Detection Algorithm
a. Gaussian Bandpass Filter
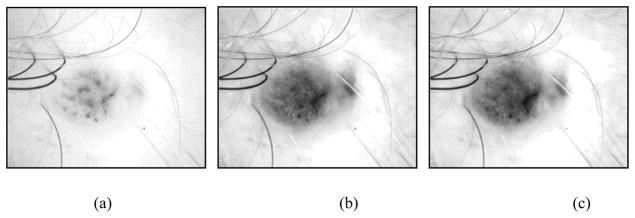
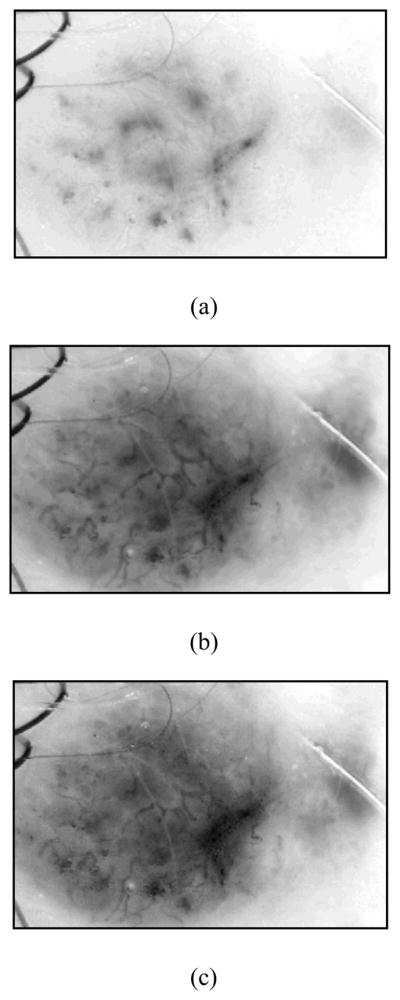
The first step in the dirt trail detection algorithm is to obtain the individual R, G, and B color planes for the skin lesion image (Figure 3). The second step is to apply Gaussian bandpass filtering to the individual color planes. A Gaussian lowpass filter, denoted as H, defined for each pixel position (u,v) is constructed and is given in Eqs. 1 and 2[4] :
| (1) |
| (2) |
where M and N represent the width and height of the image and (M/2, N/2) is the center of the frequency rectangle. H(u,v) is the resulting lowpass filtered image based on the value for D0. Two different Gaussian lowpass filters were determined empirically to find dirt trail objects by setting D0 to be 40 and 100. The difference between these lowpass filters, denoted as W(u,v), represents the bandpass filter, as given in Eq. (3).
Figure 3.
RGB plane. (a) Red plane. (b) Green plane. (c) Blue plane.
| (3) |
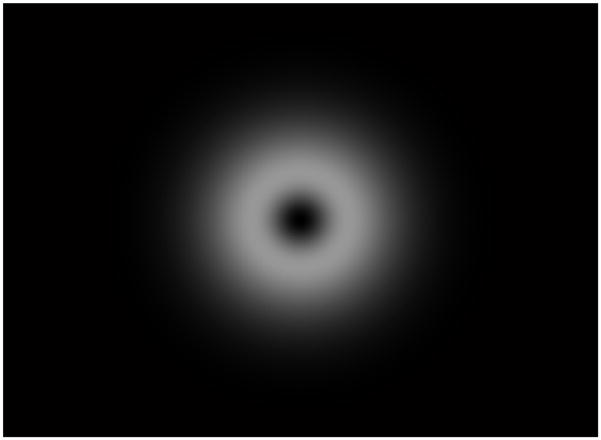
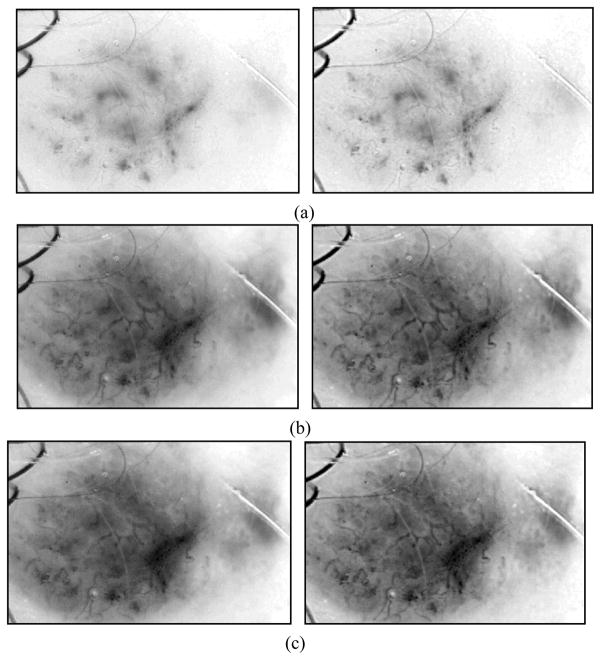
Figure 4 shows the representation for the bandpass filter W. W is applied to the spatial frequency domain representation from the discrete Fourier transform for each of the color plane images for the skin lesion (see Figure 3). The Gaussian filtered images for the R, G, and B planes are determined based on the frequency domain and converted to the spatial domain. The resulting bandpass images for the R, G, and B planes are denoted as WR, WG, and WB respectively. Figure 5 presents examples of the bandpass filter process for each color plane, with the original color plane image on the left side and the filtered image on the right side.
Figure 4.
Gaussian bandpass filter representation in the spatial frequency domain. The middle frequencies are kept.
Figure 5.
Bandpass-filtered images converted to spatial domain for R, G, and B planes. (a) Red plane. (b) Green plane. (c) Blue plane. The original color plane images are on the left, and the filtered images WR, WG, and WB are on the right.
b. Median filter
Since the dirt trail resembles small salt-and-pepper noise, a 3x3 median filter is applied to each original color plane image, with median filter results shown in Figure 6 for the individual color plane images from Figure 3. Let FR, FG, and FB denote the median-filtered images for the R, G, and B color planes, respectively.
Figure 6.
Median filter output images from R,G,B planes. (a) FR, (b) FG, (c) FB.
c. Image subtraction
The small dirt trail objects are found by computing the difference between the bandpass filtered image and the median filtered image for each color plane. Let SR, SG, and SB represent the difference images for the R, G, and B color planes, respectively, with SR = FR – WR. SG and SB are similarly defined. This corresponds to subtracting the corresponding color plane images, Figure 5, from the median filtered images, Figure 6.
d. Histogram processing
Using the difference images SR, SG, and SB for the pixels inside lesion border, the Otsu method is implemented for these pixels to find the histogram threshold [5], with the threshold multiplied by a scalar of 2, determined empirically from the experimental data set, in order to increase the sensitivity of dirt trail detection. Let TR, TG, and TB denote the threshold images for the R, G, and B color planes, respectively. These are shown in Figure 7.
Figure 7.
Output images from scalarized Otsu method from R,G,B planes. (a) TR, (b) TG, (c) TB.
e. Logic operation
In order to extract dirt trail-like objects, the threshold images for the different color planes are merged using a logical AND operation, as given in equation 4 and denoted as A. Figure 8 gives an AND image example for the threshold images from Figure 7.
Figure 8.
Otsu output image A after logical ANDing of the threshold color plane images.
| (4) |
f. Noise filtering for hairs and bubbles
The logical AND of the threshold images (A) provides an initial mask for dirt trail-like objects. A mathematical morphological-based approach was applied in order to filter hairs and bubbles commonly observed in dermoscopy skin lesion images [6]. Let B represent the resulting hair and bubble objects detected from A. Then, the resultant mask is given by R = A-B.
g. Noise filtering for isolated noise
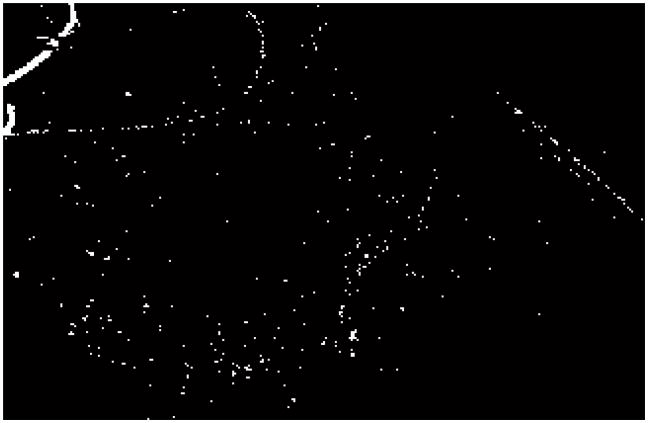
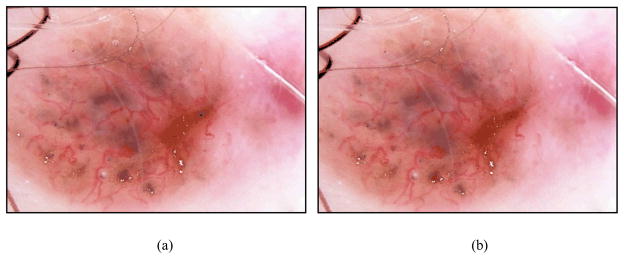
A secondary noise filter was applied to R in order to remove isolated objects I. This step was motivated by the fact that dirt trails consist of a cluster of objects (black dots and clods). Each object in R was given a blob label. All objects within an empirically determined radius of 300 pixels of the object’s centroid were counted. If the number of objects within this radius was less than 10, the isolated noise object I was removed from R, to create the final dirt trail mask K = R-I. Let K represent the final dirt trail mask after performing the clustering operation. An example image is given in Figure 9, with overlays on the original color image in (a) showing the mask R after hair and bubble removal and (b) the dirt trail mask K after hair and bubble and isolated object removal.
Figure 9.
Image overlay. (a) Image overlay R, after hair and bubble removal. (b) Dirt trail image overlay K after isolated object removal.
4. Classifier Input Features and Classifier Methodology
a. Features Computed for Lesion Discrimination
Using the final dirt trail mask K from the previous section and the RGB skin lesion image, nine features were calculated from each dirt trail mask for each image for lesion discrimination, as shown in Table 1. These nine features were selected from known dirt trail features—they are dark elongated areas within a relatively bright, pink area of the BCC.
Table 1.
Descriptions for Dirt Trail Dermoscopic Features
| Feature | Description of features for objects within lesion | Meaning | p-val, Wald Chi-sq * |
|---|---|---|---|
| OBN | Number of objects | BCC have more dirt trails | 0.3301* n.s. |
| AREA_AV | Average area of objects | BCC have clods in trails | 0.4335 n.s. |
| MAX_EC | Maximum eccentricity of objects: ratio of elliptical axes | Dirt trail objects are longer | 0.1902 n.s. |
| AVE_EC | Average eccentricity of objects: ratio of elliptical axes | Dirt trail objects are longer | > 0.5 n.s. (feature not selected) |
| RED_AV | Average red value of objects | BCC trails are darker | 0.0689 n.s. |
| GREEN_AV | Average green value of objects | BCC trails are darker | 0.0108 |
| BLUE_AV | Average blue value of objects | BCC trails are darker | 0.0085 |
| REL_BLUE | Ratio of BLUE_AV to average blue surrounding object | BCC surrounds are pink | 0.2826 n.s. |
| GR/BLUE | Ratio GREEN_AV/BLUE_AV | BCC objects are greener (brighter) | 0.1232 n.s. |
p-values from SAS model for all variables in logistic regression model with p < 0.5, maximum likelihood estimate, Wald Chi-sq.
b. Classifier description
The dirt trail detection algorithm and lesion features presented in the previous section were examined for BCC versus benign lesion discrimination in the data set of 35 BCC images with dirt trails and 79 benign lesion images described above. BCC versus benign skin lesion discrimination was done based on a standard backpropagation neural network classifier. For the neural network classifier, an architecture of 11x5x1 was used: 10 features and a bias for the input layer, 5 nodes in a hidden layer, and one output was employed. Linear transfer functions were used for the input and output layers, and sigmoid transfer functions were utilized in the hidden layer. A leave-one-out methodology was used for training and testing the neural network with each network being trained for a maximum of 200 epochs (on-line weight updating) or RMSE < 0.001. Discrimination results were generated and examined using a receiver operating characteristic (ROC) curve, varying the neural network threshold and computing the sensitivity vs. 1-specificity (true positive and false negative rates) at each threshold value.
III. Experimental Results
1. Dirt trail mask examples
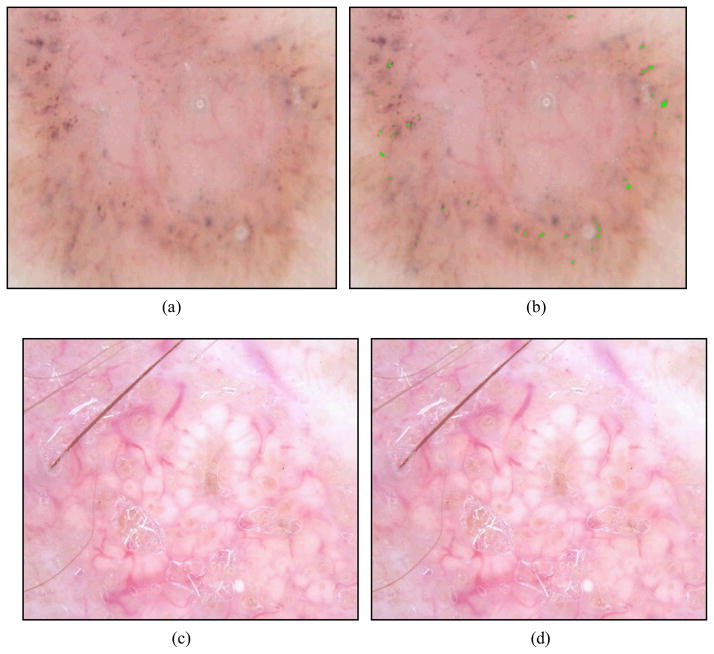
Figure 10 presents the dirt trail detection masks for a BCC lesion and a benign lesion. As observed in Figure 10, the detection algorithm finds dirt trail regions with some false positive areas. Features are computed based on the dirt trail masks found from the BCC and benign lesion data set. Ideally, the dirt trail mask is empty for the benign lesions. We found that 51 of the 79 benign lesions contained false positive objects similar to dirt trails. Accordingly, features are calculated based on the generated dirt trails mask determined for each lesion image.
Figure 10.
Dirt trail detection mask examples. (a) Dirt trail image. (b) Dirt trail image overlay. (c) Benign image. (d) Benign image overlay.
2. Feature analysis using logistic regression
Statistical analysis using Wald Chi-Square maximum likelihood estimates [7] was performed on the features computed for the BCC and benign lesions for objects found in the experimental test set of lesions in order to evaluate the discrimination capability of those features. Table 1 presents the statistical results for these features for the nine features analyzed.
The features are shown in the order selected by logistic regression, using SAS software (SAS Institute, Cary, NC), with the features OBN, the number of objects, selected first. Eight of the nine features were included in the model, with only one feature, AVE_EC, the average eccentricity of the objects, not selected. The other eight features were all included in the final model. Only two features reached significance using the Wald Chi-Square maximum likelihood estimates, GREEN_AV and BLUE_AV. The blue and green planes distinguish the dirt trails from their surrounds better than the red plane, Figure 3.
3. Lesion discrimination results
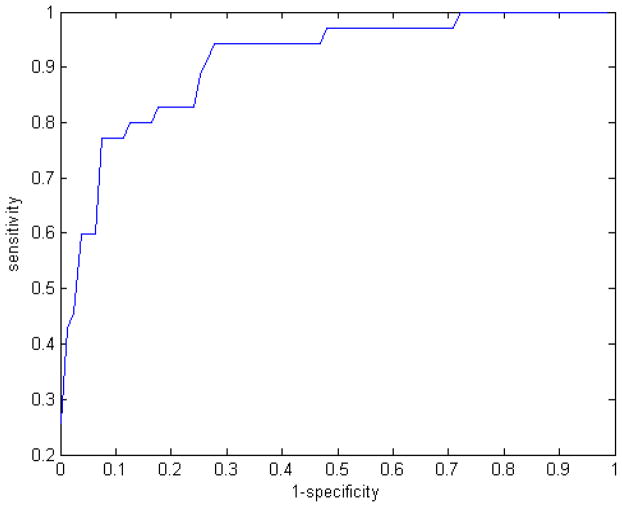
Figure 11 shows the plot of the ROC curve and the area under the ROC curve, denoted as AUC, for the neural network results based on the above features using on-line neural network training and leave-one-out training and testing.
Figure 11.
ROC curve and AUC (area under curve) for backpropagation neural network. AUC=0.902.
IV. Conclusion
Results obtained from this study show that automatic detection of dirt trails in dermoscopic images of BCC is feasible. This is important because of the large number of these skin cancers seen every year and the challenge of discovering these earlier with instrumentation. Filtering techniques developed in this study include the combined use of band-pass Gaussian filtering and median filtering. In this manner, the primary filter is a spatial screen for the small objects and the secondary filter removes midrange frequencies. Dot-size noise can easily mimic the objects seen in dirt trails. Since dot-size objects are very common in benign lesions [8,9], the neural network classifier results of AUC =0.902 are higher than might be expected in this noisy environment. The features in the individual objects therefore have meaningful information for detecting dirt trails, allowing discrimination of BCC from benign skin lesions. Future studies could incorporate assessments of cluster elongation and global distribution analysis using lesion deciles [10]. It is likely that parameters describing paracentral location of dirt trail objects will be useful in achieving better discrimination results. In addition, further optimization of Gaussian bandpass filter parameters may improve classification results.
Acknowledgments
This publication was made possible by Grant Number SBIR R43 CA153927-01 of the National Institutes of Health (NIH). Its contents are solely the responsibility of the authors and do not necessarily represent the official views of NIH.
References
- 1.Rogers HW, Weinstock MA, Harris AR, Hinckley MR, Feldman SR, Fleischer AB, Coldiron BM. Incidence estimate of nonmelanoma skin cancer in the United States, 2006. Arch Dermatol. 2010;146:283–287. doi: 10.1001/archdermatol.2010.19. [DOI] [PubMed] [Google Scholar]
- 2.Stoecker WV, Stolz W. Dermoscopy and the diagnostic challenge of amelanotic and hypomelanotic melanoma. Arch Dermatol. 2008;144:1120–1127. doi: 10.1001/archderm.144.9.1207. [DOI] [PubMed] [Google Scholar]
- 3.Altamura D, Menzies SW, Argenziano G, Zalaudek I, Soyer HP, Sera F, Avramidis M, DeAmbrosis K, Fargnoli MC, Peris K. Dermatoscopy of basal cell carcinoma: morphologic variability of global and local features and accuracy of diagnosis. J Am Acad Dermatol. 2010;62:67–75. doi: 10.1016/j.jaad.2009.05.035. [DOI] [PubMed] [Google Scholar]
- 4.González RC, Woods RE. Digital Image Processing. Upper Saddle River, NJ: Pearson/Prentice Hall; 2008. [Google Scholar]
- 5.Otsu N. A threshold selection method from gray-level histograms. IEEE Trans Sys Man Cyb. 1979;9:62–66. [Google Scholar]
- 6.Wang H, Moss RH, Chen X, Stanley RJ, Stoecker WV, Celebi E, Malters JM, Grichnik JM, Marghoob AA, Rabinovitz HS, Menzies SW, Szalapski TM. Modified watershed technique and post-processing for segmentation of skin lesions in dermoscopy images. Comput Med Imag Graph, Special Dermatology Issue. 2011;35(2):116–120. doi: 10.1016/j.compmedimag.2010.09.006. [DOI] [PMC free article] [PubMed] [Google Scholar]
- 7.Corder GW, Foreman DI. Nonparametric Statistics for Non-Statisticians: A Step-by-Step Approach. Hoboken, NJ: Wiley; 2009. [Google Scholar]
- 8.Xu J, Gupta K, Stoecker WV, Krishnamurthy Y, Rabinovitz HS, Bangert A, Calcara D, Oliviero M, Malters JM, Drugge R, Stanley RJ, Moss RH, Celebi ME. Analysis of globule types in malignant melanoma. Arch Dermatol. 2009;11:1245–1251. doi: 10.1001/archdermatol.2009.285. [DOI] [PMC free article] [PubMed] [Google Scholar]
- 9.Salopek TG, Kopf AW, Stefanato CM, Vossaert K, Silverman M, Yadav S. Differentiation of atypical moles (dysplastic nevi) from early melanomas by dermoscopy. Dermatol Clin. 2001;19:337–345. doi: 10.1016/s0733-8635(05)70271-0. [DOI] [PubMed] [Google Scholar]
- 10.Dalal A, Moss RH, Stanley RJ, Stoecker WV, Gupta K, Calcara DA, Xu J, Shrestha B, Drugge R, Malters JM, Perry LA. Concentric decile segmentation of white and hypopigmented areas in dermoscopy images of skin lesions allows discrimination of malignant melanoma. Comput Med Imaging Graph. 2011;35:148–154. doi: 10.1016/j.compmedimag.2010.09.009. [DOI] [PMC free article] [PubMed] [Google Scholar]


