


Abstract
We address the challenge of regulatory sequence alignment with a new method, Pro-Coffee, a multiple aligner specifically designed for homologous promoter regions. Pro-Coffee uses a dinucleotide substitution matrix estimated on alignments of functional binding sites from TRANSFAC. We designed a validation framework using several thousand families of orthologous promoters. This dataset was used to evaluate the accuracy for predicting true human orthologs among their paralogs. We found that whereas other methods achieve on average 73.5% accuracy, and 77.6% when trained on that same dataset, the figure goes up to 80.4% for Pro-Coffee. We then applied a novel validation procedure based on multi-species ChIP-seq data. Trained and untrained methods were tested for their capacity to correctly align experimentally detected binding sites. Whereas the average number of correctly aligned sites for two transcription factors is 284 for default methods and 316 for trained methods, Pro-Coffee achieves 331, 16.5% above the default average. We find a high correlation between a method's performance when classifying orthologs and its ability to correctly align proven binding sites. Not only has this interesting biological consequences, it also allows us to conclude that any method that is trained on the ortholog data set will result in functionally more informative alignments.
INTRODUCTION
Elucidating gene regulation is a major goal of molecular biology. Most eukaryotic genes are controlled by a non-transcribed region, usually located immediately upstream of the genes, and named a promoter. Promoters may be described as sequences containing protein binding motifs able to interact with a class of regulatory proteins known as Transcription Factors (TFs). The nature of the TF Binding Sites (TFBS) and the way they are combined in the promoter form part of the regulatory process that controls gene expression via some specific interactions with the transcriptional machinery. Identifying and characterizing these TFBSs is therefore an important task, best carried out using experimental techniques such as ChIP-Seq (1).
Unfortunately, the cost of ChIP-Seq experiments and their reliance on TF-specific antibodies can be a limiting factor. When this problem arises, comparative genomics can be used to produce useful inferences. This approach relies on the observation that conserved sequences in promoter regions of orthologous genes, also known as footprints, often indicate the presence of functional TF binding sites (2,3). [The reverse statement that functional binding sites are conserved is not true, see for example (4).] It is therefore common practice to use pairwise or multiple sequence alignments as a starting point for predicting TFBSs. This approach, however, can be hampered by the difficulty to assemble accurate genomic DNA alignments. Two factors best explain this difficulty: the low information content resulting from a limited nucleotide alphabet and the lack of strong structural constraints (as happens in proteins) that would limit the amount of variation through purifying selection. Moreover, duplications of transcription factor binding sites and a high-turnover rate in adjacent non-functional DNA often make it impossible to consecutively align corresponding pieces of sequence.
The most common way to address this problem is to run motif-finding algorithms on sets of sequences expected to contain similar TFBSs, see e.g. (5–10). Overall, these approaches amount to aligning the putative sites while essentially ignoring their context. This purely local analysis makes a lot of sense when dealing with the promoter of non-homologous co-expressed genes. Yet, situations exist where one would need to accurately align orthologous promoter regions. For instance, when doing whole-genome alignments, it would make sense to use specific TFBSs as constraint sources, since some of them [although heavily depending on the binding factor and the evolutionary distance between genomes, as TFBS turnover is a common phenomenon (11)], have been shown to evolve significantly slower than their environment (12). The easiest way to do so is to use experimentally known TFBSs and incorporate their information in position-specific weight matrices (PWMs) during the alignment process. This approach has recently been used in several packages (7,8,13–16) as it can help breaking the vicious circle resulting from the mutual dependency between accurate alignments and accurately predicted TFBSs.
Aside from improving whole-genome alignment accuracy, the main interest of this approach is to allow the construction of global alignments, thus making it possible to study the evolution of regulatory regions within their genomic context. In practice, however, precious little experimental evidence is available when it comes to vertebrate genomes thus making the reliance on PWMs sometimes difficult. Indeed, a given promoter may contain a regulatory motif that cannot be associated with any known PWM. For this reason, a method is needed that would be able to align promoter regions at nucleotiode level without relying extensively on a priori knowledge. This last task defines the goal of our current work: delivering highly accurate alignments of homologous promoter regions, suitable for fine grain evolutionary and functional modeling.
Because information is scarce at the nucleotide level, our approach involves enriching each nucleotide position with some information on its immediate neighborhood. A variant of this strategy has been successfully exploited, for instance, in the construction of more sophisticated PWMs (17,18). Here, we propose to extend the promoter nucleotide sequences with a 16-letters alphabet, where each nucleotide is replaced with a symbol depending on the considered nucleotide and on its immediate 5′ neighbor. The merits of such an extended alphabet have already been demonstrated for producing more accurate alignments of coding DNA (19) or for searching non-coding RNAs (20). In the context of this work, we show how this approach can be used to derive promoter-specific substitution matrices and how these matrices can be used within the T-Coffee package (21) to yield accurate multiple sequence alignments.
A substantial fraction of the work described here is dedicated to the creation of a benchmark framework suitable for estimating the accuracy of promoter aligners. So far, benchmarks for alignments of functional non-coding sequence have depended on synthetically modeled sequences, thus relying heavily on the model chosen to produce such sequences, see (22–25). Our framework uses two alternative evaluation procedures. The first one is based on known gene homologies and estimates the merits of an alignment strategy by its capacity to discriminate between orthologous and paralogous promoter regions. This system can be used to optimize the parameters of standard aligners. The second benchmark is an experiment-based validation where methods are evaluated for their capacity to align TFBSs identified using ChIP-Seq. The availability of ChIP-Seq data sets gathered across several species is very recent and to our knowledge it is the first time such a data set is used to determine the relative accuracy of multiple promoter alignment procedures.
These benchmarks do not only provide a quantification of the accuracy of any considered given method, but they also help to identify common features in the most informative alignments, thus permitting to define an empirical scoring scheme. For instance, we found that high pairwise sequence identity is not the best indicator of accuracy. In practice, optimal modeling seems to result from locally compact alignments made of well-defined blocks interrupted by long stretches of gaps allowing for the correct assignment of corresponding pieces of sequence. Such alignments are rarely obtained when using the default gap penalties of most DNA multiple aligners.
MATERIALS AND METHODS
Orthologs and paralogs, alignment methods
We used Biomart (ENSEMBL version 54) (26) to extract human, mouse, dog, cow and chicken orthologs resulting in 6822 clusters that are one to one and unique in all pairs of species. Additional download of 13 329 associated human paralogs resulted in a test system of 3258 ortholog clusters for which human paralogs were available. Thus in our homology benchmark on average one ortholog alignment can be compared with four paralog alignments. For the corresponding upstream regions we chose a sequence length of 500 nt for the homology test and 2000 nt for the ChIP-seq benchmark. Since information of multiple transcripts was ignored, Biomart provided the promoter of the longest transcript of a gene. To perform alignments, we used T-Coffee (version 8.9) (21), Clustal W (1.82) (27), ProbCons (1.12) (28), Muscle (3.7) (29), Mafft (6.624 b) (30). We did not perform profile alignments, i.e. we did not align the human ortholog/paralog to a previously obtained ortholog alignment. An artificial 20-letter palindrome was added to the start of all promoter regions to avoid discrepancies resulting from a different handling of terminal gap penalties. Percent identity of an alignment was calculated according to T-Coffee's seq reformat tool, i.e. dividing the number of nucleotide identities by the number of ungapped nucleotide pairs and averaging over all pairs of sequences in the alignment.
Gap training and substitution matrix
We trained T-Coffee, Muscle and Mafft directly on the test system using sequences of length 500 nt upstream of TSS (see Figure 1 for the gap-opening penalties used). We also tried some change of gap-extension penalties. In the case of Muscle the default is 0, and adding a penalty does not improve results. In the case of Mafft, changing the default GEP = −0.123 to 0 leads to a substantial improvement. For Pro-Coffee, GEP = −1 gave better results than no penalty. The BlosumPro substitution matrix (right panel of Figure 2) was constructed from 425 TFBS alignments from TRANSFAC for vertebrate transcription factors. Multiple alignments of TF binding sites were transformed into one long pairwise alignment such that introduction of dummy nucleotides avoided direct neighboring of consecutive sites. The resulting alignment was translated into a dinucleotide alphabet (cf inset in Figure 2), where a sequence ‘ACG’ e.g. would result in ‘ELG’ where E stands for ‘AC’ and L for ‘CG’ (the last letter in the original sequence is retained). Finally, log-odd ratios were built from conditional probabilities of a nucleotide from sequence 1 to be aligned to a nucleotide from sequence 2, given their respective left neighbors, divided by the product of the respective single conditional probabilities:
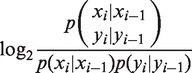 |
Figure 1.

Gap-opening penalty (GOP) training of the homology test for promoter regions of length 500 nt. Penalties for linked-pairwise T-Coffee (‘slow_pair’ mode): −90 to −10 counting points from left to right in steps of 10 (optimal: −50). Pro-Coffee: −100 to −10 in steps of 10 (optimal: −60). Muscle: −1200 to −200 in steps of 100 (optimal: −900). Mafft: 4 to 0.5 in steps of 0.25 (optimal: 2.75). Pro-Coffee uses a gap-extension penalty (GEX) of −1, for the other methods a gap-extension of 0 performed best. Default settings are shown as single points (Mafft: GOP = 1.53 GEX = 0.123, Muscle: GOP = −400, GEX = 0, T-Coffee–method = slow_pair: GOP = −10, GEX = −1).
Figure 2.

(A) Average lateral dependency between nucleotides in 6882 human promoter regions of length 500 nt. The mutual information drops by over 50% going from the immediate neighbor to the next nearest neighbor. (B) BlosumPro dinucleotide substitution matrix. The inset shows the recoding of the nucleotide alphabet, where nucleotides in the rows are left neighbors of nucleotides in the columns.
The resulting values were divided by 0.3 and rounded to the nearest integer value to obtain a blocks substitution matrix in units of 3/10 bits. Before the alignment with this matrix is performed, sequences are translated into the new alphabet of 16 letters (plus 5 additional letters for the last bases in the sequence and an ‘unknown letter’ character). After the alignment is performed, the letters are translated back into mono-nucleotides. To calculate the relative entropy in analogy to what is done in (31), we take the expectation value of the log ratio above w.r.t. the joint distribution of bases aligned in position i and neighboring bases aligned in i-1.
Mapping and peak calling from ChIP-Seq data
Raw data produced by (4) was downloaded from http://www.ebi.ac.uk/arrayexpress/files/E-TABM-722/E-TABM-722.idf.txt. Mapping of the data for human (hg18), mouse (mm9), dog (canFam2) and chicken (galGal3) for both experiment and control sequence files was done using GEM (http://sourceforge.net/apps/mediawiki/gemlibrary/index.php?title=The_GEM_library#Docmentation) allowing up to two mismatches, with default settings as quality filter (Supplementary Tables S1). Peak finding was done with Pyicos (32), extending reads to the value calculated by the strand correlation, and using the operations of normalization, subtraction and filtering with a Poisson test on read clusters. Significance of reads is associated with peak height, and the resulting P-values are subject to a quality cut-off. We selected the cutoff resulting in the most robust ranking for the considered methods (Supplementary Figure S3). The final P-value cut-off we chose is P ≤ 10−6, which led to overall numbers of called peaks that are similar to the so-called ‘lenient setting’ reported in (4), (Supplementary Table S2). The binding regions were obtained by centering regions of 100 nucleotides over the genomic coordinates of significant peaks. Coordinates of these regions were then used to fetch their sequences from the Galaxy genome browser and mapped back onto the alignments. See Supplementary Tables S3 and S4 for numbers of peaks called within the orthologous promoter cliques.
Counting binding site pairs in overlapping factor binding regions
Prediction of TFBSs in the binding regions for the factors CCAAT/enhancer-binding protein alpha (CEBPA) and hepatocyte nuclear factor 4 alpha (HNF4a) was done using MatScan (33) along with Jaspar weight matrices (34). All predicted sites are considered equally valid (also if they overlap) as long as they fall into the 100 nt factor binding regions and have a motif identity no worse than 70%. This cut-off gives a good trade-off between quality of the sites and amount of differential performance of the alignment methods. We show that it has no significant effect on the ranking of performance of the methods, see Supplementary Figure S4. We then count for each species combination and factor the total number of gaplessly aligned TFBS pairs falling in ChIP-seq regions as our final benchmark called ‘aligned site pairs’ (cf the two green pairs in the lower panel of Figure 3 falling in the overlap of the yellow regions). We also estimated an upper bound on the number of alignable site pairs for one pair of species by taking the smaller of the two numbers of TFBSs in each species falling into our promoters. This upper bound is the number of ‘putative site pairs’. The fraction of putative sites eventually aligned is around 15% when considering mammalian genomes, and down to around 1% for chicken (Supplementary Figure S6). This is because many of the TFBS fall in regions that do not get aligned, or regions that do not overlap sufficiently in the alignments, reflecting the greater evolutionary distance of chicken (cf also Supplementary Tables S4 and S5 and Supplementary Figure S5). We also define the number of ‘alignable site pairs’ as the minimum of TFBS over two species falling in the overlapping binding regions, cf Supplementary Figure S7.
Figure 3.

A comparison between alignments of the upstream region of the human gene C18orf19 produced by the gap-trained version of T-Coffee and Pro-Coffee. Highlighted in yellow are ChIP-seq regions for CEBPA, colored sequences are predicted binding sites for this factor that are either in (green) or outside of (red) the factor-binding regions. Unlike T-Coffee, Pro-Coffee manages to correctly align the highlighted regions and their binding sites.
RESULTS
Comparing DNA sequences with a dinucleotide evolutionary model
When considered as independent 4-letters strings, DNA sequences have very low information content, which limits their usage in many sequence-based applications. The effective information content is, however, often higher and can be recovered by taking into account dependencies that define a higher order alphabet. Coding potentials are probably the best example of such a higher order alphabet encoded in DNA sequences. Unfortunately, identifying similar alphabets in non-coding regions has proven an elusive task, probably as a consequence of the high heterogeneity of functions supported by DNA, ranging from regulatory control to nucleosome positioning. The features controlling these functions are encoded within DNA in a non-uniform way that makes them hard to use when comparing sequences. Yet, the nearest neighbor information is a simple feature that can easily be incorporated in the sequences in order to improve the accuracy of sequence comparisons. One can do this by simply recoding each nucleotide so that it reflects both its own nature and the nature of its immediate 5′ neighbor. Since a nucleotide can have four different 5′ neighbors, one can therefore replace each position with a symbol drawn from a 16-letters alphabet (4 × 4). The recoded string will then have exactly the length of the original string, including the last nucleotide, which is kept non-recoded.
This type of recoding only makes sense if a significant dependency exists between adjacent nucleotides, and if this dependency results in evolutionary constraints. Dependencies can easily be measured on unaligned sequences, by estimating whether some dinucleotides have a higher frequency than one would expect by combining their individual frequency. Such analysis was used recently to show the existence of a significant lateral dependency in RNA sequences (20). We did a similar analysis here by considering the promoter region of 6882 genes in human (see ‘Materials and Methods’ section). Results are displayed in the left panel of Figure 2 and indicate that the strongest dependency occurs between each residue and its nearest neighbor. These findings are consistent with those recently reported in (20) and suggest that this pattern of dependency is a low level feature of DNA, possibly resulting from structural constraints (35). In the context of promoters, the existence of such dependencies has long been discussed as limiting in promoter analysis methodology (36). Indeed, classical PWMs assume positions to be independent from each other.
Having established the existence of a lateral bias, we then made an attempt to determine whether this bias has evolutionary consequences, that is to say, a tendency of evolution to maintain certain dinucleotides or to influence mutation patterns along promoter regions. We did so by collecting 425 seed alignments of TFBSs used to compute the TRANSFAC weight matrices (37). In order to make the resulting matrix as informative as possible, we only kept pairwise projections having between 60% and 90% identity. This made a total of 117 172 projections, on which the rate of dinucleotide substitution was measured. The matrix itself was estimated as a standard log-odd matrix (see ‘Materials and Methods’ section). Using the Altschul formula (31), we found this matrix to have a relative entropy of 0.72, a figure comparable to that of a BLOSUM62 (0.7).
One could consider the two nearest neighbors (5′ and 3′). Yet, the tiny extra information from next-nearest neighbor dependency one would obtain this way would not justify the problems caused from an alphabet exceeding the amino acid alphabet (which leads to matrices that cannot be used in standard aligners). In contrast, the matrix we designed can be used by a novel mode of T-Coffee, named Pro-Coffee, designed to align promoter sequences. In order to estimate Pro-Coffee's accuracy, we have designed two benchmarks, one based on evolutionary analysis and a second one based on experimental ChIP-Seq data. The rest of this section describes the principle of each benchmark and their readouts on Pro-Coffee and other popular aligners.
An evolutionary Benchmark for Promoter Alignments
A standard strategy when evaluating multiple sequence alignment (MSA) methods is to use reference alignments as a standard of truth (38). In proteins, these gold standards are usually established on the basis of structural information. In principle, reference alignments can also be established by specialists but, when doing so, there is always a risk of circularity. An alternative assessment method is to estimate the modeling capacities of MSAs, that is to say, their capacity of accurately predicting key properties of the considered sequences. This approach is quite realistic since most MSAs are indeed intermediate models, meant to be fed to other modeling techniques. In the context of this benchmark, we decided to estimate the capacity of promoter alignments to help recognizing true orthologous sequences. Two genes are said to be one-to-one orthologs when they are only separated by a speciation event and no duplication. Orthology is inferred on protein sequences, taking advantage of their evolutionary resilience in order to recognize distant relationships. The most trustworthy way to infer these relations usually involves estimating a phylogenetic tree from a multiple sequence alignment and then comparing its topology with a reference Tree of Life (39). We first assembled a data set of 6882 ENSEMBL (26) genes represented by a fully connected graph of one-to-one-orthologous relationships between human, mouse, dog, cow and chicken (see ‘Materials and Methods’ section). Among these, we identified 3258 families for which the human ortholog has one or more human paralogs. By definition, these paralogs correspond to duplications older than the last unique common ancestor of the considered species. Given such a data set, the principle of our analysis is to incorporate each human paralog within an MSA made of the orthologs from the four other species. When doing so, one is left with one distinct MSA for each human paralog. These alignments are used to predict the true ortholog that we define as the paralog yielding the highest level of average identity with the orthologs from other species
This approach may seem like an over-simplification of standard orthologous assignment procedures, but one must consider that the system is provided with a lot of information, in the form of the set of bona fide orthologs to which the human paralogs are compared in turn. We first validated this approach by assessing its capacity to recognize the correct orthologous protein sequences when fed with the collection of selected genes. As expected, and with the default mode of all the aligners used in this study, the prediction accuracy was higher than 97%. This means that in virtually all cases, the human homolog having the highest level of identity with the orthologs from other species was the one considered by ENSEMBL to be the one-to-one ortholog. Having validated the capacity of our framework to effectively deal with protein sequences, we then applied it to the promoter regions, defined as the 500-nt upstream of the transcription start site (TSS) of the same genes.
Results are shown in the first column of Table 1. As one would expect, the classification accuracies are significantly lower than reported for protein-coding regions and range from 70% for the lowest (T-Coffee default) to 76% for the most accurate method (Mafft). These differences correspond to about 200 data sets and are therefore significant from a statistical point of view. While on the one hand this read out confirms the rather poor performances of T-Coffee on DNA sequence, they also reflect the wide range of accuracies one can achieve with the most commonly used methods. Interestingly, when using the default parameters, only around 50% of the genes are consistently classified correctly by all the methods (For a three-way Venn-diagram analysis of selected methods, see Supplementary Figure S1). It is important to understand that our goal here is not to classify correctly promoters, but rather to ask about the influence of the underlying MSA when doing such a classification. In summary, we consider the fraction of correctly classified promoters an indicator of an aligner's accuracy. Such a readout makes it possible to do some parameter tuning, and we did so on the gap penalty scheme.
Table 1.
Effect of optimization for the recognition of orthologous promoter regions
| Method | Default | Optimized | ||
|---|---|---|---|---|
| T-Coffeea | 69.6 | 2.1 | 75.8 | 3.8 |
| Pro-Coffee | – | – | 80.4 | 3.9 |
| ProbCons | 70.1 | 2.1 | – | – |
| ClustalW | 72.4 | 2.8 | – | – |
| Muscle | 75.1 | 2.9 | 77.6 | 3.8 |
| Mafft | 75.7 | 3.4 | 79.5 | 3.6 |
Percent correctly classified orthologs (first and third columns) and average difference in identity between true ortholog alignment and best paralog alignment (second and fourth columns).
aT-Coffee is run in the ‘slow_pair’ mode instead of the (not tunable) default setting ‘proba_pair’.
The gap penalty scheme is arguably the most complex ingredient in an alignment. Correct values depend on a variety of parameters, mostly unknown, which include the indel propensity and the local functional constraints (40,41). In protein alignments, the use of improved gap penalty schemes has been shown to be a critical feature for the generation of highly accurate alignments. We followed that same approach to ask whether different values of gap extension and gap opening penalties might have an effect on the classification capacities of the resulting alignments. Two packages were not considered here, ProbCons that does not have an explicit gap penalty scheme and ClustalW that uses an automated gap penalty estimator that makes it hard to control the effect of the procedure. The other methods were evaluated by measuring the level of correct classification achieved when using a pair of gap extension and gap opening penalties (GOP, GEP) within a given range (cf ‘Materials and Methods’ section). The results of this optimization process are shown in Figure 1 and in the second column of Table 1. Our data suggest that all methods benefit from the tuning and tend to reach a similar level of accuracy (close to 80%) when appropriately optimized. All the differences reported here are statistically significant. A random method with a 75% success rate would have a (binomial) standard deviation of 25 data sets, compared to the 80 data sets gained by the method showing least improvement. Table 1 also shows that the average differential identity between the true ortholog alignment and the best alignment of a paralog tends to slightly increase after tuning, although this trend is relatively moderate (about 1% point). Another point revealed by Figure 1 is that, against simple expectations, the alignments yielding the highest level of identity are not the most predictive ones. Indeed those achieving this goal, regardless of the methods, have an average level of identity close to 45%—way below the 65% of identity all these methods can achieve on this data set. This simple observation indicates the existence of a subtle trade-off between insertions, deletions and substitutions, a situation that could hamper the design of an objective function effectively reflecting the accuracy of promoter alignments. The last conclusion one can draw from Table 1 and Figure 1 is that all things being equal, the best results on this data set are achieved using Pro-Coffee, the new dinucleotide based method. In an additional test we also considered three subsets of our ortholog cliques that show a varying degree of percent identity. The improvement after training on the entire set occurs alike for low, intermediate, and high sequence identity subsets (Supplementary Figure S2.)
The main limitation of these results is the potential circularity that may exist on the reference data set. Indeed the ENSEMBL orthologs are predicted on the basis of sequence similarity, and though we base our analysis on the promoters regions, we are nonetheless trying to re-establish, on the basis of sequence similarity, a result that originally already depended on sequence similarity. Furthermore, even if we ignore this potential tautology and consider these alignments to accurately reflect the effect of optimization on orthology inference, we still have no indication that these alignments could be more informative from a functional point of view. We therefore decided to ask this precise question by taking advantage of a newly available ChIP-Seq data set providing experimental TFBS information across several species.
Benchmarking promoter MSA methods using ChIP-Seq data
When the position of each TFBS is known beforehand, the best strategy to establish the accuracy of a sequence alignment would be to simply count the number of TFBSs effectively matched across species. Until recently, this was impossible because this information was available only for a few sites which had been experimentally established for a handful of TFs in single species. Fortunately, the situation has recently improved and data are now available for CEBPA and HNF4a across five and three species, respectively [taken from (4)]. This experimental data can be considered the equivalent of structural information when doing protein alignments and it allows an evaluation of our alignments based on a functional comparison rather than sequence comparison.
We constructed this benchmark data set by calling the peaks from ChIP-Seq to map the putative TFBSs on the corresponding genomes (see ‘Materials and Methods’ section). We then considered the 2000-nt upstream of the TSS in each of the 6882 data sets made of one-to-one ENSEMBL orthologous genes. From these, we kept only the ones with ChIP-Seq binding regions in at least two species (Supplementary Table S4). Now we scanned the binding regions for matches to the PWM of its respective transcription factor (see ‘Materials and Methods’ section). Once aligned, each data set was evaluated by counting the number of perfectly aligned binding sites. Results are summarized in Table 2 and Figure 4.
Table 2.
Comparison of performance for the correct alignment of ChIP-Seq regions
| CEBPA |
HNF4a |
|||
|---|---|---|---|---|
| Method | Default | Optimized | Default | Optimized |
| T-Coffeea | 106 | 136 | 137 | 163 |
| Pro-Coffee | – | 153 | – | 178 |
| ClustalW | 120 | – | 128 | – |
| ProbCons | 125 | – | 152 | – |
| Muscle | 142 | 150 | 170 | 173 |
| Mafft | 139 | 147 | 159 | 179 |
aT-Coffee is run in the ‘slow_pair’ mode instead of the (not tunable) default setting ‘proba_pair’.
Numbers of gaplessly aligned proven binding site pairs summed over all species pairs.
Figure 4.

Number of gaplessly aligned ChIP-Seq validated binding-site pairs per species combination for both transcription factors and all the methods tested. Best performances are achieved by methods whose gap penalties were optimized using the homology test. Pro-Coffee and optimized Mafft perform best or equally well as the best method on three data sets, followed by the optimized versions of Muscle (two data sets), and T-Coffee (one data set).
We tested both the methods with default settings and the ones optimized on the ortholog-calling data set. Interestingly, the results obtained on the ChIP-Seq data agree broadly with those estimated on the ortholog prediction framework. Before gap-penalty optimization, Muscle and Mafft clearly dominate, while the methods optimized on the orthologous data sets all outperform the default. These trends are consistent between CEBPA and HNF4a. Overall, the improvement of the optimized methods over the default ranges between 5.3% (Muscle) and 22.1% (T-Coffee) on CEBPA, with differences in a similar range on HNF4a (1.7% on Muscle and 16.0% on T-Coffee). As reported for the ortholog prediction data set, Pro-Coffee is either the best (CEPBA) or the second best (HNF4a) method. These global results are in good agreement with observations made by comparing the TFBS alignments on genome pairs (Figure 4). Pro-Coffee and Mafft win or score equal to the best method on three out of seven data sets, followed by the optimized versions of Muscle (two data sets), and T-Coffee (one data set). Note that Figure 4 has only limited implications regarding general statements about the degree of binding site conservation in promoter regions of the considered species, as we are showing data for a specific (highly conserved) subset of promoters, and differences in the level of genome annotation can also lead to artifacts.
The correspondence between the readouts observed on the ortholog prediction data set and the ChIP-Seq alignment accuracy is quite remarkable. We quantified it and found a correlation of r2 = 0.85 (P = 3.8 × 10⁻⁴) for CEBPA (Figure 5) and r2 = 0.72 (P = 4.0 × 10⁻³) for HNF4a (data not shown). Interestingly, we found no correlation when trying to relate either the orthologous prediction accuracy (Figure 6) or the ChIP-Seq alignment accuracy (data not shown) with the average percent identity delivered by the various methods considered here. This finding confirms our observation that high sequence identity is not necessarily associated with highly informative alignments. The high correlation between the ChIP-Seq readout and orthology prediction is more interesting as it suggests a relationship between functionally and evolutionarily correct alignments. As discussed in (11), binding site conservation should rather be considered in terms of binding site density in corresponding regions than precise nucleotide-to-nucleotide conservation. We will show in the following subsection that our ortholog training helps improving this large-scale property of alignments to match corresponding regions, whereas it has little effect at the nucleotide level. A significant implication is that a simple homology based set-up is as effective as a very complex experiment-based analysis for the training of promoter alignment methods.
Figure 5.

Performance on the ChIP-Seq test using CEBPA versus the homology test for all methods. There is good correlation between the two benchmarks (r2 = 0.85, P = 3.8 × 10⁻⁴). A similar correlation is observed for HFN4a (data not shown).
Figure 6.

Homology test performance versus percent identity of the ortholog alignments for all methods. It can be seen that high average pairwise identity between sequences in an alignment is no indicator of alignment quality. Generally, optimizing methods leads to a loss in percent identity so as to reach an intermediate level that is similar in all methods that perform well. The same trend can be observed for the ChIP-Seq test performance (data not shown).
Good alignments may neither be short nor highly identical
Comparing alignment methods gives some insight into what are properties of alignments that perform well in our tests. First of all, it is clear that the best test results are obtained for an intermediate percent identity of the ortholog alignments (Figures 1 and 6). Neither very high column identities (often resulting in fuzzy alignments with isolated gaps) nor low column identities (yielding a short alignment of essentially one big block) give satisfactory results. Figure 6 shows the lack of correlation between the homology test performance and the average percent identity of alignments. Default parameters can be such that alignments are above (ProbCons, T-Coffee and Muscle) or below (ClustalW) this optimal identity, but it is generally achieved when training gap penalties.
The results suggest that good alignments stem from a trade-off between introducing sufficient gaps and keeping a compact block structure. In order to better understand what makes a method perform better, we characterized alignments produced by the default T-Coffee, the optimized T-Coffee and Pro-Coffee (Figure 7). Pro-Coffee's better performance goes along with a more equilibrated alignment-column distribution. While T-Coffee default and also the optimized T-Coffee show high frequencies for columns not containing gaps, Pro-Coffee alignments have many more columns containing at least one gap, so alignments are generally much longer. When optimizing Mafft, the same trend toward longer alignments can be observed (data not shown).
Figure 7.

Distribution of alignment columns depending on the number of gaps they contain. Pro-Coffee (light gray bars) produces less compact alignments, whereas both the default and the tuned version of T-Coffee (dark gray and black bars, respectively) tend to over-align, resulting in column distributions that strongly peak in ungapped columns. This insertion of less gaps results in significantly shorter alignments (as shown in the inset). Data shown for the alignments that were used for the ChIP-Seq test (regions of length 2000 nt).
In Figure 3, we show an example where the optimized T-Coffee's tendency to yield alignments that are still too short makes it less likely to align truly corresponding pieces of sequence (ChIP-Seq regions highlighted in yellow), which Pro-Coffee does manage to align.
The two observations, that base-to-base identities are not maximized, and that alignments tend to get longer, suggest that we are optimizing on a larger scale, i.e. making truly corresponding regions coincide in the alignments rather than better matching single nucleotides. This can be seen from another angle as well: Supplementary Figure S6 shows the aligned site pairs as percentage of putative sites. We now discuss a kind of ‘decomposition’ of this result into large-scale and fine-grained properties. The number of TFBSs falling in overlapping ChIP regions for a given species pair increases in almost all cases for all the methods after optimization (Supplementary Figure S7). This is a large-scale property in the sense that it requires the correct regions to be aligned, but not the single binding sites to match. When now looking at the percentage of those that do match, we see that there is no general increase in the optimized methods, it often even decreases (Supplementary Figure S8).
DISCUSSION
In this work, we are presenting a novel promoter alignment method, along with two benchmarks that can be used either for estimating the accuracy of any method designed for the same type of sequences or even for exploring the parameter space. By promoter alignment, we mean promoter sequences related closely enough so that an alignment may be carried out without much need to re-arrange the order of TFBSs. For this purpose, we have implemented within the T-Coffee package a novel alignment mode named Pro-Coffee. The default T-Coffee relies on the assembly of a collection of pairwise alignments. The collection is named a library, and the multiple alignment is assembled using the progressive alignment algorithm and the library as a position-specific scoring scheme. This general scheme defines the popular consistency based progressive alignment algorithm, an algorithm that is now forming the basis of the most accurate sequence aligners (42). In Pro-Coffee, the only difference with the original T-Coffee is the computation of the library using a pairwise aligner that relies on a dinucleotide matrix to align pairs of promoter regions. Our choice to use a dinucleotide matrix is based on two observations: the existence of a significant amount of mutual information between adjacent nucleotides in promoter regions, and the possibility to estimate dinucleotide matrices from TFBS collections, with an entropy comparable to standard amino acid substitution matrices.
We then designed a first data set to estimate the relative accuracy of Pro-Coffee when compared with other multiple aligners. In contrast with other MSA reference data sets, we do not evaluate aligners for their capacity to recapitulate a set of reference alignments, but rather for their capacity to produce the most informative MSAs. In this context, the alignments were evaluated for their capacity to discriminate the true ortholog within a set of alternative human paralogs. Using this simple test, we show that there is a wide range of disparity among the most widely used aligners. Furthermore, using the fraction of correctly identified orthologs, we show that one can train the available method by exploring a range of gap opening penalties. All methods benefit from this training, though Pro-Coffee is the one eventually achieving the highest accuracy. The main strength of this benchmark is its non-reliance on some reference alignment that would be very hard to establish unambiguously. This makes even more sense if considering that in general, MSAs are not the purpose of a project but rather an intermediate model used to feed some other modeling technique. On the other hand, the downside of this approach is its heavy reliance on ENSEMBL defined sets of orthologs. Defining ortholog sets is a highly non-trivial procedure and methods able to unambiguously identify orthologous data sets remain an important focus of research in phylogeny (39). In this context, one may therefore argue that our tuning is simply a complicated way to recapitulate the ENSEMBL procedure. Of course, one can argue against this that ENSEMBL orthologs are defined from tree comparisons of protein coding genes, while ours result from the comparison of promoter alignments. But overall, one is left here with the observation that a sequence-based analysis (ENSEMBL) is used to validate another sequence-based analysis (Pro-Coffee multiple alignments).
We addressed this problem by designing a second data set, made of 6882 multiple sequence alignments of promoter regions. These promoter regions are also expected to be orthologs (according to the ENSEMBL definition), but in this case the true nature of the postulated orthology is not critical. The only thing that really matters is the existence of a homology relationship between the considered sequences. On this data set, we projected the results of a ChIP-Seq experiment carried out for HNF4a and CEBPA on, respectively, three and four vertebrates. Thanks to this data we then evaluated the aligners for their capacity to match as many as possible homologous TFBSs. Of course, one may argue that this data set is heavily biased toward functional similarity and that alignments evaluated this way may not reflect the true history of the considered sequences. Fortunately, this does not seem to happen in practice, and we show unambiguously the existence of a strong correlation between the readouts obtained on the ortholog data set and those obtained on the ChIP-Seq data set.
This finding does not only support our claim that Pro-Coffee is currently one of the best methods for aligning promoter regions, it goes much further. First of all, it shows that our benchmark is providing the community with the first ever experiment-based benchmark for the evaluation of genomic DNA alignment accuracy. [ChIP-Seq data in a single species has very recently been used to verify the predictive power of a method that simultaneously aligns and detects regulatory elements (16). Also, there has been an experimental validation of DNA alignments in protein-coding regions see (43)]. As such, the validation may be used to improve any method one wishes to apply on this type of sequences. The correlation between the readouts measured on the two data sets is even more interesting. It indicates that a simple analysis based on sequence comparison can be considered to be as informative as an analysis based on the integration of highly sophisticated and expensive experiments. This observation has important implications for the accurate alignment of genomic DNA. Such accurate alignments will find a multitude of important applications, starting with the improvement of the input required by TFBS discovery programs doing motif-finding [PhyloGibbs (44)] or motif scanning algorithms [e.g. Monkey (45), MotEvo (46)] that take phylogeny into account. For a review of such methods see (47).
AVAILABILITY
The software is part of the T-Coffee package, an open source freeware available from www.tcoffee.org. Benchmark data sets can be downloaded via the Pro-Coffee homepage at www.tcoffee.org/Projects_home_page/procoffee_home_page.html.
SUPPLEMENTARY DATA
Supplementary Data are available at NAR Online. Supplementary Tables 1–5, Supplementary Figures 1–8.
FUNDING
Funding for open access charge: The Centre for Genomic Regulation (CRG) (to C.N.); the Plan Nacional (BFU2008-00419) (to I.E. and E.R.); ‘La Caixa’ international PhD program fellowships (to G.B.). This work was also co-financed by the European Commission, within the 7th Framework Programme (Grant Agreement KBBE-2A-222664) (‘Quantomics’).
Conflict of interest statement. None declared.
Supplementary Material
REFERENCES
- 1.Farnham PJ. Insights from genomic profiling of transcription factors. Nat. Rev. Genet. 2009;10:605–616. doi: 10.1038/nrg2636. [DOI] [PMC free article] [PubMed] [Google Scholar]
- 2.Kellis M, Patterson N, Endrizzi M, Birren B, Lander ES. Sequencing and comparison of yeast species to identify genes and regulatory elements. Nature. 2003;423:241–254. doi: 10.1038/nature01644. [DOI] [PubMed] [Google Scholar]
- 3.Xie X, Lu J, Kulbokas EJ, Golub TR, Mootha V, Lindblad-Toh K, Lander ES, Kellis M. Systematic discovery of regulatory motifs in human promoters and 3′ UTRs by comparison of several mammals. Nature. 2005;434:338–345. doi: 10.1038/nature03441. [DOI] [PMC free article] [PubMed] [Google Scholar]
- 4.Schmidt D, Wilson MD, Ballester B, Schwalie PC, Brown GD, Marshall A, Kutter C, Watt S, Martinez-Jimenez CP, Mackay S, et al. Five-vertebrate ChIP-seq reveals the evolutionary dynamics of transcription factor binding. Science. 2010;328:1036–1040. doi: 10.1126/science.1186176. [DOI] [PMC free article] [PubMed] [Google Scholar]
- 5.Prohaska SJ, Fried C, Flamm C, Wagner GP, Stadler PF. Surveying phylogenetic footprints in large gene clusters: applications to Hox cluster duplications. Mol. Phylogenet. Evol. 2004;31:581–604. doi: 10.1016/j.ympev.2003.08.009. [DOI] [PubMed] [Google Scholar]
- 6.Hertz GZ, Stormo GD. Identifying DNA and protein patterns with statistically significant alignments of multiple sequences. Bioinformatics. 1999;15:563–577. doi: 10.1093/bioinformatics/15.7.563. [DOI] [PubMed] [Google Scholar]
- 7.Blanco E, Guigo R, Messeguer X. Multiple non-collinear TF-map alignments of promoter regions. BMC Bioinformatics. 2007;8:138. doi: 10.1186/1471-2105-8-138. [DOI] [PMC free article] [PubMed] [Google Scholar]
- 8.Berezikov E, Guryev V, Plasterk RH, Cuppen E. CONREAL: conserved regulatory elements anchored alignment algorithm for identification of transcription factor binding sites by phylogenetic footprinting. Genome Res. 2004;14:170–178. doi: 10.1101/gr.1642804. [DOI] [PMC free article] [PubMed] [Google Scholar]
- 9.Loots GG, Ovcharenko I. Mulan: multiple-sequence alignment to predict functional elements in genomic sequences. Methods Mol. Biol. 2007;395:237–254. [PMC free article] [PubMed] [Google Scholar]
- 10.Ovcharenko I, Loots GG, Giardine BM, Hou M, Ma J, Hardison RC, Stubbs L, Miller W. Mulan: multiple-sequence local alignment and visualization for studying function and evolution. Genome Res. 2005;15:184–194. doi: 10.1101/gr.3007205. [DOI] [PMC free article] [PubMed] [Google Scholar]
- 11.Otto W, Stadler PF, Lopez-Giraldez F, Townsend JP, Lynch VJ, Wagner GP. Measuring transcription factor-binding site turnover: a maximum likelihood approach using phylogenies. Genome Biol. Evol. 2009;1:85–98. doi: 10.1093/gbe/evp010. [DOI] [PMC free article] [PubMed] [Google Scholar]
- 12.He Q, Bardet AF, Patton B, Purvis J, Johnston J, Paulson A, Gogol M, Stark A, Zeitlinger J. High conservation of transcription factor binding and evidence for combinatorial regulation across six Drosophila species. Nat. Genet. 2011;43:414–420. doi: 10.1038/ng.808. [DOI] [PubMed] [Google Scholar]
- 13.Sinha S, He X. MORPH: probabilistic alignment combined with hidden Markov models of cis-regulatory modules. PLoS Comput. Biol. 2007;3:e216. doi: 10.1371/journal.pcbi.0030216. [DOI] [PMC free article] [PubMed] [Google Scholar]
- 14.Bais AS, Grossmann S, Vingron M. Incorporating evolution of transcription factor binding sites into annotated alignments. J. Biosci. 2007;32:841–850. doi: 10.1007/s12038-007-0084-2. [DOI] [PubMed] [Google Scholar]
- 15.Hallikas O, Palin K, Sinjushina N, Rautiainen R, Partanen J, Ukkonen E, Taipale J. Genome-wide prediction of mammalian enhancers based on analysis of transcription-factor binding affinity. Cell. 2006;124:47–59. doi: 10.1016/j.cell.2005.10.042. [DOI] [PubMed] [Google Scholar]
- 16.Majoros WH, Ohler U. Modeling the evolution of regulatory elements by simultaneous detection and alignment with phylogenetic pair HMMs. PLoS Comput. Biol. 2010;6:e1001037. doi: 10.1371/journal.pcbi.1001037. [DOI] [PMC free article] [PubMed] [Google Scholar]
- 17.Siddharthan R. Dinucleotide weight matrices for predicting transcription factor binding sites: generalizing the position weight matrix. PLoS One. 2010;5:e9722. doi: 10.1371/journal.pone.0009722. [DOI] [PMC free article] [PubMed] [Google Scholar]
- 18.Zhang MQ, Marr TG. A weight array method for splicing signal analysis. Comput. Appl. Biosci. 1993;9:499–509. doi: 10.1093/bioinformatics/9.5.499. [DOI] [PubMed] [Google Scholar]
- 19.Lu Y, Sze SH. Improving accuracy of multiple sequence alignment algorithms based on alignment of neighboring residues. Nucleic Acids Res. 2009;37:463–472. doi: 10.1093/nar/gkn945. [DOI] [PMC free article] [PubMed] [Google Scholar]
- 20.Bussotti G, Raineri E, Erb I, Zytnicki M, Wilm A, Beaudoing E, Bucher P, Notredame C. BlastR–fast and accurate database searches for non-coding RNAs. Nucleic Acids Res. 2011;39:6886–6895. doi: 10.1093/nar/gkr335. [DOI] [PMC free article] [PubMed] [Google Scholar]
- 21.Notredame C, Higgins DG, Heringa J. T-Coffee: A novel method for fast and accurate multiple sequence alignment. J. Mol. Biol. 2000;302:205–217. doi: 10.1006/jmbi.2000.4042. [DOI] [PubMed] [Google Scholar]
- 22.Kim J, Sinha S. Towards realistic benchmarks for multiple alignments of non-coding sequences. BMC Bioinformatics. 2010;11:54. doi: 10.1186/1471-2105-11-54. [DOI] [PMC free article] [PubMed] [Google Scholar]
- 23.Huang W, Nevins JR, Ohler U. Phylogenetic simulation of promoter evolution: estimation and modeling of binding site turnover events and assessment of their impact on alignment tools. Genome Biol. 2007;8:R225. doi: 10.1186/gb-2007-8-10-r225. [DOI] [PMC free article] [PubMed] [Google Scholar]
- 24.Pollard DA, Bergman CM, Stoye J, Celniker SE, Eisen MB. Benchmarking tools for the alignment of functional noncoding DNA. BMC Bioinformatics. 2004;5:6. doi: 10.1186/1471-2105-5-6. [DOI] [PMC free article] [PubMed] [Google Scholar]
- 25.Keightley PD, Johnson T. MCALIGN: stochastic alignment of noncoding DNA sequences based on an evolutionary model of sequence evolution. Genome Res. 2004;14:442–450. doi: 10.1101/gr.1571904. [DOI] [PMC free article] [PubMed] [Google Scholar]
- 26.Flicek P, Aken BL, Ballester B, Beal K, Bragin E, Brent S, Chen Y, Clapham P, Coates G, Fairley S, et al. Ensembl's 10th year. Nucleic Acids Res. 2009;38:D557–D562. doi: 10.1093/nar/gkp972. [DOI] [PMC free article] [PubMed] [Google Scholar]
- 27.Chenna R, Sugawara H, Koike T, Lopez R, Gibson TJ, Higgins DG, Thompson JD. Multiple sequence alignment with the Clustal series of programs. Nucleic Acids Res. 2003;31:3497–3500. doi: 10.1093/nar/gkg500. [DOI] [PMC free article] [PubMed] [Google Scholar]
- 28.Do CB, Mahabhashyam MS, Brudno M, Batzoglou S. ProbCons: Probabilistic consistency-based multiple sequence alignment. Genome Res. 2005;15:330–340. doi: 10.1101/gr.2821705. [DOI] [PMC free article] [PubMed] [Google Scholar]
- 29.Edgar RC. MUSCLE: multiple sequence alignment with high accuracy and high throughput. Nucleic Acids Res. 2004;32:1792–1797. doi: 10.1093/nar/gkh340. [DOI] [PMC free article] [PubMed] [Google Scholar]
- 30.Katoh K, Toh H. Recent developments in the MAFFT multiple sequence alignment program. Brief. Bioinform. 2008;9:286–298. doi: 10.1093/bib/bbn013. [DOI] [PubMed] [Google Scholar]
- 31.Henikoff S, Henikoff JG. Amino acid substitution matrices from protein blocks. Proc. Natl Acad. Sci. 1992;89:10915–10919. doi: 10.1073/pnas.89.22.10915. [DOI] [PMC free article] [PubMed] [Google Scholar]
- 32.Althammer S, Gonzalez-Vallinas J, Ballare C, Beato M, Eyras E. Pyicos: A versatile toolkit for the analysis of high-throughput sequencing data. Bioinformatics. 2011;27:3333–3340. doi: 10.1093/bioinformatics/btr570. [DOI] [PMC free article] [PubMed] [Google Scholar]
- 33.Blanco E, Messeguer X, Smith TF, Guigo R. Transcription factor map alignment of promoter regions. PLoS Comput. Biol. 2006;2:e49. doi: 10.1371/journal.pcbi.0020049. [DOI] [PMC free article] [PubMed] [Google Scholar]
- 34.Portales-Casamar E, Thongjuea S, Kwon AT, Arenillas D, Zhao X, Valen E, Yusuf D, Lenhard B, Wasserman WW, Sandelin A. JASPAR 2010: the greatly expanded open-access database of transcription factor binding profiles. Nucleic Acids Res. 38:D105–D110. doi: 10.1093/nar/gkp950. [DOI] [PMC free article] [PubMed] [Google Scholar]
- 35.Parker SC, Hansen L, Abaan HO, Tullius TD, Margulies EH. Local DNA topography correlates with functional noncoding regions of the human genome. Science. 2009;324:389–392. doi: 10.1126/science.1169050. [DOI] [PMC free article] [PubMed] [Google Scholar]
- 36.Bulyk ML, Johnson PL, Church GM. Nucleotides of transcription factor binding sites exert interdependent effects on the binding affinities of transcription factors. Nucleic Acids Res. 2002;30:1255–1261. doi: 10.1093/nar/30.5.1255. [DOI] [PMC free article] [PubMed] [Google Scholar]
- 37.Matys V, Kel-Margoulis OV, Fricke E, Liebich I, Land S, Barre-Dirrie A, Reuter I, Chekmenev D, Krull M, Hornischer K, et al. TRANSFAC and its module TRANSCompel: transcriptional gene regulation in eukaryotes. Nucleic Acids Res. 2006;34:D108–D110. doi: 10.1093/nar/gkj143. [DOI] [PMC free article] [PubMed] [Google Scholar]
- 38.Aniba MR, Poch O, Thompson JD. Issues in bioinformatics benchmarking: the case study of multiple sequence alignment. Nucleic Acids Res. 38:7353–7363. doi: 10.1093/nar/gkq625. [DOI] [PMC free article] [PubMed] [Google Scholar]
- 39.Altenhoff AM, Dessimoz C. Phylogenetic and functional assessment of orthologs inference projects and methods. PLoS Comput. Biol. 2009;5:e1000262. doi: 10.1371/journal.pcbi.1000262. [DOI] [PMC free article] [PubMed] [Google Scholar]
- 40.Kumar S, Filipski A. Multiple sequence alignment: in pursuit of homologous DNA positions. Genome Res. 2007;17:127–135. doi: 10.1101/gr.5232407. [DOI] [PubMed] [Google Scholar]
- 41.Kemena C, Notredame C. Upcoming challenges for multiple sequence alignment methods in the high-throughput era. Bioinformatics. 2009;25:2455–2465. doi: 10.1093/bioinformatics/btp452. [DOI] [PMC free article] [PubMed] [Google Scholar]
- 42.Thompson JD, Linard B, Lecompte O, Poch O. A comprehensive benchmark study of multiple sequence alignment methods: current challenges and future perspectives. PLoS One. 2011;6:e18093. doi: 10.1371/journal.pone.0018093. [DOI] [PMC free article] [PubMed] [Google Scholar]
- 43.Carroll H, Beckstead W, O'Connor T, Ebbert M, Clement M, Snell Q, McClellan D. DNA reference alignment benchmarks based on tertiary structure of encoded proteins. Bioinformatics. 2007;23:2648–2649. doi: 10.1093/bioinformatics/btm389. [DOI] [PubMed] [Google Scholar]
- 44.Siddharthan R, Siggia ED, van Nimwegen E. PhyloGibbs: a Gibbs sampling motif finder that incorporates phylogeny. PLoS Comput. Biol. 2005;1:e67. doi: 10.1371/journal.pcbi.0010067. [DOI] [PMC free article] [PubMed] [Google Scholar]
- 45.Moses AM, Chiang DY, Pollard DA, Iyer VN, Eisen MB. MONKEY: identifying conserved transcription-factor binding sites in multiple alignments using a binding site-specific evolutionary model. Genome Biol. 2004;5:R98. doi: 10.1186/gb-2004-5-12-r98. [DOI] [PMC free article] [PubMed] [Google Scholar]
- 46. doi: 10.1093/bioinformatics/btr695. Arnold,P., Erb,I., Pachkov,M., Molina,N. and van Nimwegen,E. MotEvo: Integrated Bayesian probabilistic methods for inferring regulatory sites and motifs on multiple alignments of DNA sequences. Bioinformatics, doi:10.1093/bioinformatics/btr695 [epub ahead of print] [DOI] [PubMed] [Google Scholar]
- 47.Su J, Teichmann SA, Down TA. Assessing computational methods of cis-regulatory module prediction. PLoS Comput. Biol. 6:e1001020. doi: 10.1371/journal.pcbi.1001020. [DOI] [PMC free article] [PubMed] [Google Scholar]
Associated Data
This section collects any data citations, data availability statements, or supplementary materials included in this article.