

Abstract
Brain region-specific deposition of extracellular amyloid plaques principally composed of aggregated amyloid-β (Aβ) peptide is a pathological signature of Alzheimer's disease (AD). Recent human neuroimaging data suggest that resting-state functional connectivity strength is reduced in patients with AD, cognitively normal elderly harboring elevated amyloid burden, and in advanced aging. Interestingly, there exists a striking spatial correlation between functional connectivity strength in cognitively normal adults and the location of Aβ plaque deposition in AD. However, technical limitations have heretofore precluded examination of the relationship between functional connectivity, Aβ deposition, and normal aging in mouse models. Using a novel functional connectivity optical intrinsic signal (fcOIS) imaging technique, we demonstrate that Aβ deposition is associated with significantly reduced bilateral functional connectivity in multiple brain regions of older APP/PS1 transgenic mice. The amount of Aβ deposition in each brain region was associated with the degree of local, age-related bilateral functional connectivity decline. Normal aging was associated with reduced bilateral functional connectivity specifically in retrosplenial cortex. Furthermore, we found that the magnitude of regional bilateral functional correlation in young APP/PS1 mice before Aβ plaque formation was proportional to the amount of region-specific plaque deposition seen later in older APP/PS1 mice. Together, these findings suggest that Aβ deposition and normal aging are associated with region-specific disruption of functional connectivity and that the magnitude of local bilateral functional connectivity predicts regional vulnerability to subsequent Aβ deposition in mouse brain.
Introduction
Alzheimer's disease (AD) is the most common cause of dementia, characterized by progressive structural and functional deterioration of higher-order neural networks. A histopathological hallmark of AD is the presence of extracellular plaques primarily composed of aggregated amyloid-β (Aβ) peptide. Normally, Aβ is produced in neurons and present in the extracellular space of the brain in soluble form (Selkoe, 2001). During AD pathogenesis, soluble Aβ aggregates into oligomers and insoluble extracellular amyloid plaques in a concentration-dependent manner (Yan et al., 2009). In AD, amyloid plaque deposition is most prominent in the default-mode network (DMN), a network of brain areas where metabolism is preferentially elevated during undirected mentation (Buckner et al., 2005; Vlassenko et al., 2010). Interestingly, functional connectivity MRI data suggest that functional connectivity is disrupted in patients with AD (Greicius et al., 2004; Jones et al., 2011), cognitively normal elderly with elevated amyloid burden (Hedden et al., 2009; Sheline et al., 2010; Drzezga et al., 2011; Mormino et al., 2011), and in advanced aging (Andrews-Hanna et al., 2007). Moreover, recent data suggest that the relationship between functional connectivity and Aβ deposition is bidirectional; the DMN exhibits high intrinsic functional connectivity in healthy brain and is preferentially susceptible to Aβ deposition in AD (Buckner et al., 2009).
In mouse models of β-amyloidosis, Aβ plaque deposition is associated with myriad neurotoxic effects, including neuritic dystrophy, impaired synaptic integration, and calcium dyshomeostasis (Stern et al., 2004; Kuchibhotla et al., 2008; Meyer-Luehmann et al., 2008). However, because technical limitations have precluded examination of systems-level functional connectivity in model systems, the relationship between intrinsic functional connectivity and Aβ deposition in mouse brain remains unclear. We designed a novel functional connectivity optical intrinsic signal (fcOIS) imaging approach (White et al., 2011) wherein changes in reflected light intensity from the surface of the brain are converted to changes in local hemoglobin concentration and used to measure intrinsic functional connectivity. Herein, we use fcOIS to determine whether Aβ deposition or normal aging is associated with functional connectivity disruption in APPswe/PS1ΔE9 (APP/PS1) transgenic and wild-type mice, respectively. Additionally, we examine whether the magnitude of regional bilateral functional connectivity before Aβ deposition is indicative of subsequent region-specific Aβ deposition.
Materials and Methods
Animals.
Male APP/PS1 mice on a B6C3 background (Jankowsky et al., 2004) and B6C3 wild-type mice (The Jackson Laboratory) were aged to 3.0 ± 0.5 or 11.5 ± 0.5 months for experimentation. Mice were given ab libitum access to food and water. All experimental protocols were approved by the Animal Studies Committee at Washington University.
Animal preparation.
Following a previously published fcOIS protocol (White et al., 2011), mice were anesthetized with ketamine-xylazine and allowed 15 min for anesthetic transition. For an equivalent depth of anesthesia across groups (assessed by responsiveness to hindpaw pinch, anesthesia duration, respiratory rate, and heart rate), mice were administered the following doses of 86.9 mg/kg ketamine, 13.4 mg/kg xylazine: 3-month-old APP/PS1, 1×; 11.5-month-old APP/PS1, 1.25×; all wild-type, 1.5×. The mouse was placed on a rectally monitored heating pad maintained at 37°C (mTCII, Cell Microcontrols) with head secured in a stereotactic frame. A midline incision was made, the scalp reflected, and the intact skull was kept moist with mineral oil. Forty-five minutes of data were collected for 36 of 37 imaging sessions; sessions consisted of consecutive 5 min datasets. Anesthesia duration was ∼70 min for all groups. Respiratory rate during all imaging sessions was monitored to be 3–4 Hz. Pulse (measured by Fourier analysis of OIS time courses collected from each mouse brain during imaging) was similar across all groups (young APP/PS1, 3.3 ± 0.4 Hz; older APP/PS1, 4.2 ± 0.3 Hz; young wild-type, 3.9 ± 0.2 Hz; older wild-type, 4.4 ± 0.3 Hz).
Imaging system.
Sequential illumination was provided at four wavelengths by a ring of light-emitting diodes (LEDs) placed ∼10 cm above the head (see White et al., 2011, for details). Diffuse reflected light was detected by a cooled, frame-transfer electron-multiplying CCD camera (iXon 897, Andor Technologies). The LED ring and camera were computer-controlled and operated at a full-frame rate of 30 Hz. The field-of-view covered the majority of the convexity of the cerebral cortex (∼1 cm2).
Image processing.
Data from all mice were subject to an initial quality check before spectroscopic analysis. Data runs (5 min) in which temporal variation in reflected light level intensity exceeded 1% for any wavelength were excluded from further analysis. This preliminary analysis resulted in 15–45 min of data per mouse. For each pixel, the differential light intensity at each wavelength was converted to differential absorption. The multi-wavelength absorption coefficient data were then converted to hemoglobin concentration changes for each pixel and time point. The subsequent fc analysis used the spatio-temporal ΔHbO2 data (White et al., 2009).
Data were filtered to the functional connectivity band (0.009–0.08 Hz) following previous human fMRI algorithms (Fox et al., 2005), resampled from 30 Hz to 1 Hz, and a brain mask was created containing all pixels labeled as brain. Time traces of all brain pixels were averaged to create a global brain signal. This global signal was regressed from each pixel's time trace to remove global sources of variance, as is common in human fMRI algorithms.
Atlas registration.
All image sequences and brain masks were affine-transformed to a common atlas space (Franklin and Paxinos, 1996) determined by the coordinates of olfactory bulb and cerebrum, bregma, and lambda. The anterior–posterior stretch was set equal to the medial-lateral stretch. To ensure all comparisons were performed only on the brain area visualized in all mice, the intersection of each brain mask was calculated and made symmetric.
Seed-based functional connectivity measures.
Seed placement was determined a priori using an anatomical atlas (Franklin and Paxinos, 1996). Twelve seed locations were positioned at coordinates corresponding to left and right frontal, motor, somatosensory, cingulate, retrosplenial, and visual cortices. Seed time traces were calculated by averaging time traces within 0.25 mm (30 pixels) of a seed locus and functional connectivity maps were created by correlating each seed time trace against those in every brain pixel. Individual functional connectivity maps were averaged within each cohort to generate consensus maps for each cohort. Regional bilateral correlations were determined by correlating the seed-based time trace in each functional area with that of its contralateral homolog, thus producing six bilateral correlation values for each mouse. Pearson r values were converted to Fisher Z measures using: Z(r) = arctanh(r) for all group comparisons. To further examine bilateral connectivity across the brain, every pixel in the brain was used as a seed center and its time trace was correlated with its contralateral homolog. Individual bilateral maps were averaged within each cohort to generate consensus bilateral connectivity maps.
Aβ plaque deposition.
Animals were transcardially perfused with chilled PBS, pH 7.4, with 0.3% heparin immediately following the final fcOIS session. Brains were removed and postfixed in 4% paraformaldehyde at 4°C overnight. Following fixation, brains were cryoprotected in 30% sucrose in PBS at 4°C for 72 h. Using a freezing sliding microtome (Microm), serial coronal sections (50 μm thickness) were collected from frontal cortex to caudal hippocampus. Sections (separated by 300 μm) were stained with biotinylated HJ3.4 (anti-Aβ1–13, mouse monoclonal antibody generated in-house) to visualize Aβ immunopositive plaques. Immunostained sections were scanned using a Nanozoomer slide scanner (Hamamatsu Photonics). Quantitative analysis of immunopositive staining was performed as described previously (Bero et al., 2011). Briefly, images of immunostained sections were exported with NDP viewer (Hamamatsu Photonics), converted to 8-bit grayscale using ACDSee Pro 2 software (ACD Systems), thresholded to highlight Aβ-specific staining and analyzed using ImageJ (NIH). A mouse brain atlas (Franklin and Paxinos, 1996) was used to identify frontal, motor, somatosensory, cingulate, retrosplenial, and visual cortices for quantitative analysis of Aβ immunopositive staining.
Statistical analysis.
Statistical significance was determined by two-tailed t test if two groups were compared. When variance differed significantly between groups, Welch's t test was used. One-way ANOVA followed by Tukey's post hoc test for multiple comparisons were used when more than two groups were compared. All statistical analyses were performed using Prism version 5.00 for Windows (GraphPad) or Matlab. Values were accepted as significant if p < 0.05.
Results
Aβ plaque deposition and normal aging are associated with functional connectivity disruption
To investigate the relationship between Aβ deposition and functional connectivity in a mouse model of cerebral β-amyloidosis, we used fcOIS imaging to examine bilateral functional connectivity magnitude in APP/PS1 mice before and following Aβ plaque deposition. This mouse model develops cerebral Aβ plaque deposition beginning at 4–5 months of age (Jankowsky et al., 2004). Relative to young APP/PS1 mice, older APP/PS1 mice exhibited significant reductions in bilateral functional correlation strength in frontal (Z(r), 3 month, 0.74 ± 0.06; 11.5 month, 0.49 ± 0.08; p = 0.03), motor (3 month, 1.05 ± 0.13; 11.5 month, 0.48 ± 0.15; p = 0.022), cingulate (3 month, 0.96 ± 0.9; 11.5 month, 0.58 ± 0.13; p = 0.031), and retrosplenial (3 month, 1.4 ± 0.16; 11.5 month, 0.46 ± 0.06; p = 0.0009) cortices. Significant differences were not observed in somatosensory (3 month, 0.49 ± 0.06; 11.5 month, 0.32 ± 0.12; p = 0.23) or visual (3 month, 0.6 ± 0.15; 11.5 month, 0.21 ± 0.1; p = 0.057) cortices (Fig. 1A–G; functional connectivity maps are population averages following affine transformation, n = 7/group).
Figure 1.

Aβ plaque deposition is associated with decreased functional connectivity in multiple brain systems of older APP/PS1 mice. A–F, Composite, group-averaged, functional correlation maps of frontal (FC, A), motor (MC, B), somatosensory (SC, C), cingulate (CC, D), retrosplenial (RC, E) and visual (VC, F) cortices in young and older APP/PS1 mice. Black circles denote seed position. G, Regional bilateral functional correlation in young (black bars) and older (white bars) APP/PS1 mice (n = 7/group). *p < 0.05, ***p < 0.001. Values represent mean ± SEM. H, Locations of cortical functional regions, anatomical landmarks (white circles), and seed placement and size (black circles) were manually constructed (White et al., 2011) using the Franklin and Paxinos (1996) histological atlas.
We next sought to determine whether normal aging was associated with reduced bilateral functional connectivity in B6C3 wild-type mice. Compared with young wild-type mice, older wild-type mice exhibited a significant reduction in bilateral connectivity in retrosplenial cortex (Z(r), 3 month, 1.1 ± 0.06; 11.5 month, 0.69 ± 0.07; p = 0.0002). In contrast, comparisons of bilateral functional connectivity between young and older wild-type mice were not significant in frontal (3 month, 0.81 ± 0.1; 11.5 month, 0.71 ± 0.09; p = 0.46), motor (3 month, 0.68 ± 0.07; 11.5 month, 0.83 ± 0.14; p = 0.30), somatosensory (3 month, 0.45 ± 0.11; 11.5 month, 0.67 ± 0.08; p = 0.14), cingulate (3 month, 0.99 ± 0.09; 11.5 month, 1.0 ± 0.09; p = 0.94) or visual (3 month, 0.42 ± 0.08; 11.5 month, 0.52 ± 0.1; p = 0.44) cortices [Fig. 2A–G; functional connectivity maps are population averages following affine transformation, n = 10 (young) and 13 (older)]. These data suggest that bilateral functional connectivity magnitude is decreased during normal aging and is exacerbated by Aβ deposition.
Figure 2.
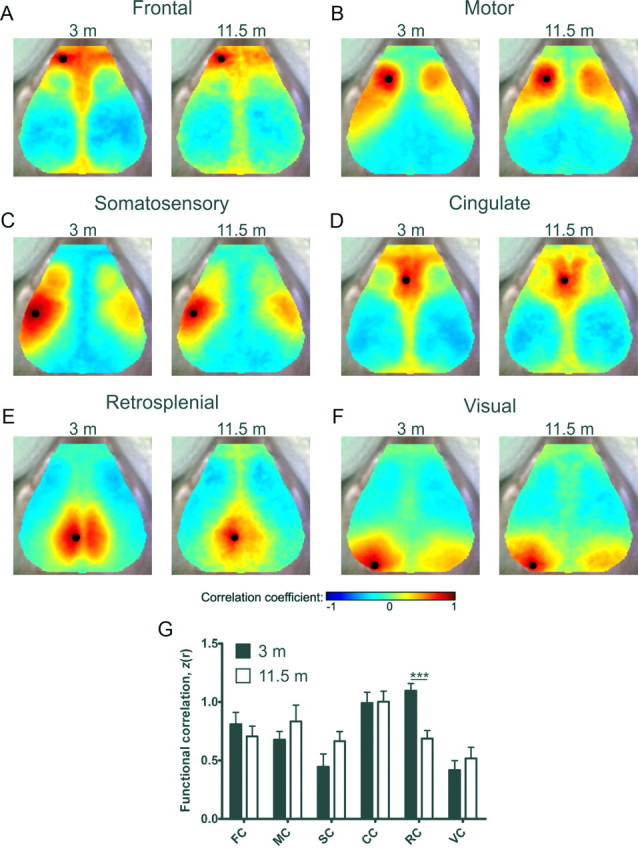
Normal aging is associated with decreased functional connectivity in retrosplenial cortex. A–F, Composite, group-averaged, functional correlation maps of frontal (FC, A), motor (MC, B), somatosensory (SC, C), cingulate (CC, D), retrosplenial (RC, E) and visual (VC, F) cortices in young and older wild-type mice. Black circles denote seed position. G, Regional bilateral functional correlation in young (black bars) and older (white bars) wild-type mice (young, n = 10; older, n = 13); ***p < 0.001. Values represent mean ± SEM.
Bilateral functional connectivity magnitude predicts region-specific Aβ plaque deposition
To determine whether regional bilateral functional connectivity magnitude in young APP/PS1 mice before Aβ deposition was predictive of the regional vulnerability to Aβ deposition in older APP/PS1 mice, we characterized the distribution of Aβ immunopositive plaque deposition in older APP/PS1 mice. Brain sections were immunostained with biotinylated HJ3.4 antibody, to Aβ amino acids 1–13 (anti-Aβ1–13), to determine the percentage area occupied by Aβ plaques in each region of interest (Fig. 3A–D). We found that Aβ plaque deposition was greatest in retrosplenial cortex (18.01 ± 3.86%), intermediate in cingulate (9.04 ± 2.97%), frontal (6.63 ± 1.63%), motor (7.26 ± 1.38%) cortices, and low in somatosensory (3.74 ± 0.75%) and visual (5.16 ± 0.69%) cortices (Fig. 3E; n = 4). Remarkably, we found that bilateral functional connectivity magnitude in young APP/PS1 mice before plaque deposition was proportional to the amount of Aβ plaque deposition in older APP/PS1 mice in a region-specific manner (Fig. 3F).
Figure 3.
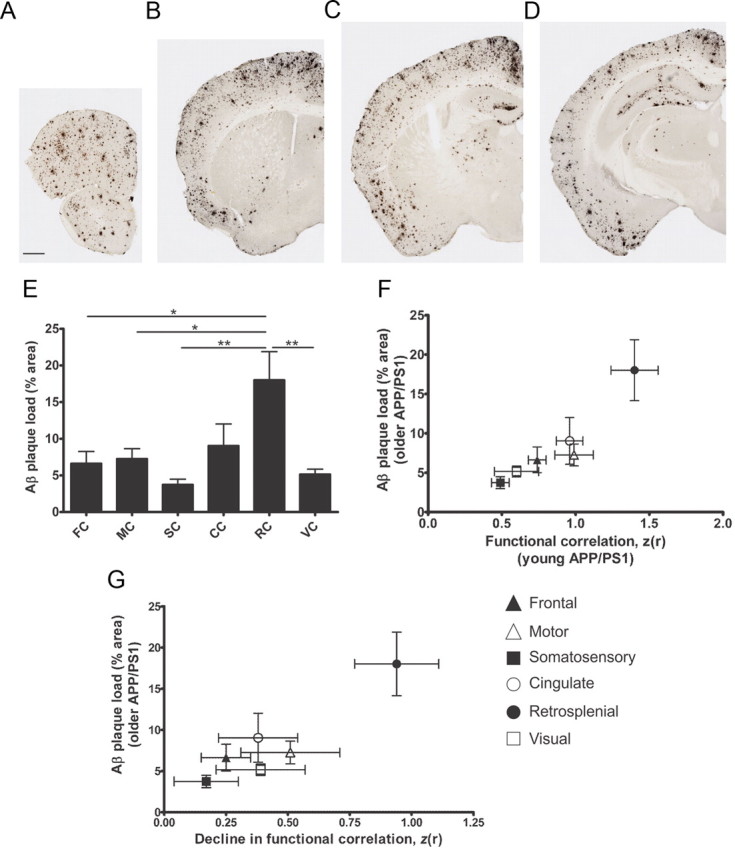
Regional bilateral functional connectivity in APP/PS1 mice is predictive of and affected by regional plaque deposition. A–D, Representative brain sections from older APP/PS1 mice stained with biotinylated HJ3.4 antibody (anti-Aβ1–13) to visualize Aβ immunopositive plaques (n = 4/group). Scale bar: (in A) A–D, 500 μm. E, Percentage area occupied by Aβ deposition in frontal (FC), motor (MC), somatosensory (SC), cingulate (CC), retrosplenial (RC), and visual (VC) cortices; *p < 0.05, **p < 0.01. F, Regional bilateral correlation in young APP/PS1 mice plotted against Aβ plaque deposition in each brain region of older APP/PS1 mice. G, Decline in bilateral correlation of older APP/PS1 mice plotted against Aβ plaque deposition. Values represent mean ± SEM.
Local Aβ plaque deposition is associated with degree of local functional connectivity decline
Quantitative analysis of regional Aβ deposition shows a strong association with regional functional connectivity decline (Fig. 3G). To more closely examine the spatial relationship between Aβ deposition and age-related decline in bilateral functional connectivity, fcOIS datasets from each mouse were affine-transformed to a common atlas space and individual bilateral maps were averaged within each cohort to generate a single, full-field, consensus bilateral connectivity map for each cohort (Fig. 4A,B,E,F). To examine pixel-wise, age-related changes in bilateral functional connectivity, consensus values generated from older mice were subtracted from consensus values generated from young mice of the same genotype (Fig. 4C,G) and compared (Fig. 4D,H). The resultant difference maps reveal local differences in the level of age-related functional decline in APP/PS1 and wild-type mice, and notably, reproduce the regional differences in bilateral functional connectivity reported above. These data further suggest that functional connectivity in mouse brain is reduced in normal aging and is exacerbated by Aβ deposition in a region-specific manner.
Figure 4.

Aβ deposition is associated with degree of decline in local bilateral functional connectivity. A, B, Consensus bilateral functional connectivity maps generated for young (A) and older (B) APP/PS1 mice and young (E) and older (F) wild-type mice. C, G, Bilateral functional connectivity difference map between young and older APP/PS1 (C) and wild-type (G) mice. D, H, p values of C, G, plotted on a −log10 scale. Note that in C, G, positive values represent age-related decline, whereas negative values represent age-related increase in bilateral functional connectivity. White circles denote anatomical landmarks for image coregistration.
Discussion
Intrinsic resting-state functional connectivity represents highly organized synaptic activity within the brain (Pizoli et al., 2011). A close relationship between changes in hemoglobin oxygenation (i.e., resting fMRI and OIS imaging) and slow (<0.1 Hz) fluctuations in local field potentials has been established in human (He et al., 2008) and rodent brain (Hahn et al., 2006; Lu et al., 2007). Disruption of functional connectivity is an important biomarker of neurological disease (Zhang and Raichle, 2010) and one that will likely yield new insights into pathophysiology and potentially reveal novel therapeutic avenues. However, the relationship between functional connectivity, Aβ deposition, and normal aging in mouse brain remains unknown. Here, we used a novel fcOIS imaging approach (White et al., 2011) to characterize the relationship between functional connectivity, Aβ deposition, and normal aging in mouse brain. As expected, both positive (red) and negative (blue) correlations are present in the functional connectivity maps of Figure 1A–F and Figure 2A–F, a finding consistent with our previous work in humans (Fox et al., 2005) and mice (White et al., 2011). Interpretation of anticorrelations warrants some caution, however, as global signal regression enforces the presence of anticorrelated pixels. As the present data suggest that fcOIS anticorrelations in mice are not robustly affected by aging or Aβ deposition, we focused our analysis on alterations in the positive correlation. In accord with human data (Greicius et al., 2004; Hedden et al., 2009; Sheline et al., 2010; Drzezga et al., 2011; Jones et al., 2011; Mormino et al., 2011), we found that region-specific Aβ accumulation is associated with significant reductions in bilateral functional connectivity magnitude in multiple brain systems of older APP/PS1 mice. Moreover, brain regions in which amyloid deposition was most prominent exhibited greater age-related declines in functional connectivity relative to areas of lesser plaque deposition. As Aβ plaque deposition is associated with local neuritic dystrophy and impaired synaptic integration in APP transgenic mice (Stern et al., 2004; Meyer-Luehmann et al., 2008) future application of fcOIS will permit examination of the molecular mechanisms that underlie the relationship between Aβ deposition and impaired systems-level functional connectivity.
In humans, normal age-related memory deficits are associated with decreased DMN functional correlation (Andrews-Hanna et al., 2007). Here, we found that retrosplenial cortex exhibits decreased bilateral functional connectivity in wild-type mice at 11.5 months of age. As age-related memory deficits are not present in wild-type mice at this age, and given that retrosplenial cortex is important for learning and memory (Corcoran et al., 2011), impaired bilateral functional connectivity in retrosplenial cortex may represent an early event in age-related neural dysfunction. In this context, fcOIS may serve as a useful tool to investigate the molecular mechanisms that contribute to decreased functional connectivity and memory dysfunction associated with normal aging.
Intriguingly, we found that the magnitude of region-specific bilateral functional correlation in young APP/PS1 mice before the onset of Aβ plaque formation was proportional to the density of regional plaque deposition in older APP/PS1 mice. This finding is consistent with human data suggesting that areas that comprise the DMN exhibit disproportionately high intrinsic structural and functional connectivity in cognitively normal young adults and are among the brain regions most vulnerable to Aβ deposition in AD (Hagmann et al., 2008; Buckner et al., 2009). Our laboratory has recently demonstrated that regional differences in endogenous neuronal activity are closely associated with interstitial fluid Aβ levels and are a key determinant of region-specific Aβ plaque deposition in APP transgenic mice (Bero et al., 2011). As the present data suggest that regional bilateral functional connectivity magnitude in young mice before plaque deposition is also associated with the level of subsequent Aβ plaque deposition, it is likely that similar associations between neural activity/metabolism, functional connectivity, and susceptibility to amyloid deposition exist in mouse brain. However, such convergence has not yet been directly examined to determine how these mechanisms may independently or coordinately regulate Aβ metabolism.
The results of the current study describing age and pathology-related decreases in functional connectivity are consistent with changes previously observed in human brain. In human brain however, normal aging and AD are also associated with region-specific increases in functional connectivity (Jones et al., 2011; Mormino et al., 2011). Although we did observe local increases in functional connectivity near the somato-motor seeds of wild-type mice, human data suggest that prefrontal cortex harbors the most significant increase in anterior DMN functional connectivity in AD (Jones et al., 2011). As brain areas that comprise mouse prefrontal cortex reside outside the field-of-view of the current OIS system, it remains possible that age or pathology-related increases in functional connectivity are present in more ventrally located regions. In future studies, these deeper brain regions might be imaged using diffuse optical tomography (White et al., 2009).
A major challenge facing the neuroscience community is the paucity of clinically translatable assays that examine neural network function and integrity. Given that resting-state functional connectivity measures have provided valuable insight into the functional organization of the human brain and have yielded examples of how such organization is disrupted in disease, use of fcOIS in the setting of genetic and pharmacological manipulations provides an opportunity to elucidate the role of specific genes/proteins in systems-level functional connectivity in healthy brain and its disruption in mouse models of neurological and neurodegenerative disorders. The clinically translatable nature of fcOIS also positions this technique as a useful tool with which to examine the efficacy of pharmacological or behavioral interventions aimed at restoring neural network integrity.
Footnotes
This work was supported by NIH Grants AG033452 (to A.W.B.), T90-DA022871 (to B.R.W.), R01-EB008085 and R01-EB009233 (to J.P.C.), the Medical-Scientist Training Program (B.R.W.), Ellison Medical Foundation (D.M.H.), and Cure Alzheimer's Fund (D.M.H.).
The authors declare no competing financial interests.
References
- Andrews-Hanna JR, Snyder AZ, Vincent JL, Lustig C, Head D, Raichle ME, Buckner RL. Disruption of large-scale brain systems in advanced aging. Neuron. 2007;56:924–935. doi: 10.1016/j.neuron.2007.10.038. [DOI] [PMC free article] [PubMed] [Google Scholar]
- Bero AW, Yan P, Roh JH, Cirrito JR, Stewart FR, Raichle ME, Lee JM, Holtzman DM. Neuronal activity regulates the regional vulnerability to amyloid-beta deposition. Nat Neurosci. 2011;14:750–756. doi: 10.1038/nn.2801. [DOI] [PMC free article] [PubMed] [Google Scholar]
- Buckner RL, Snyder AZ, Shannon BJ, LaRossa G, Sachs R, Fotenos AF, Sheline YI, Klunk WE, Mathis CA, Morris JC, Mintun MA. Molecular, structural, and functional characterization of Alzheimer's disease: evidence for a relationship between default activity, amyloid, and memory. J Neurosci. 2005;25:7709–7717. doi: 10.1523/JNEUROSCI.2177-05.2005. [DOI] [PMC free article] [PubMed] [Google Scholar]
- Buckner RL, Sepulcre J, Talukdar T, Krienen FM, Liu H, Hedden T, Andrews-Hanna JR, Sperling RA, Johnson KA. Cortical hubs revealed by intrinsic functional connectivity: mapping, assessment of stability, and relation to Alzheimer's disease. J Neurosci. 2009;29:1860–1873. doi: 10.1523/JNEUROSCI.5062-08.2009. [DOI] [PMC free article] [PubMed] [Google Scholar]
- Corcoran KA, Donnan MD, Tronson NC, Guzmán YF, Gao C, Jovasevic V, Guedea AL, Radulovic J. NMDA receptors in retrosplenial cortex are necessary for retrieval of recent and remote context fear memory. J Neurosci. 2011;31:11655–11659. doi: 10.1523/JNEUROSCI.2107-11.2011. [DOI] [PMC free article] [PubMed] [Google Scholar]
- Drzezga A, Becker JA, Van Dijk KR, Sreenivasan A, Talukdar T, Sullivan C, Schultz AP, Sepulcre J, Putcha D, Greve D, Johnson KA, Sperling RA. Neuronal dysfunction and disconnection of cortical hubs in non-demented subjects with elevated amyloid burden. Brain. 2011;134:1635–1646. doi: 10.1093/brain/awr066. [DOI] [PMC free article] [PubMed] [Google Scholar]
- Fox MD, Snyder AZ, Vincent JL, Corbetta M, Van Essen DC, Raichle ME. The human brain is intrinsically organized into dynamic, anticorrelated functional networks. Proc Natl Acad Sci U S A. 2005;102:9673–9678. doi: 10.1073/pnas.0504136102. [DOI] [PMC free article] [PubMed] [Google Scholar]
- Franklin KB, Paxinos G. The mouse brain in stereotaxic coordinates. Ed 1. San Diego: Academic; 1996. [Google Scholar]
- Greicius MD, Srivastava G, Reiss AL, Menon V. Default-mode network activity distinguishes Alzheimer's disease from healthy aging: evidence from functional MRI. Proc Natl Acad Sci U S A. 2004;101:4637–4642. doi: 10.1073/pnas.0308627101. [DOI] [PMC free article] [PubMed] [Google Scholar]
- Hagmann P, Cammoun L, Gigandet X, Meuli R, Honey CJ, Wedeen VJ, Sporns O. Mapping the structural core of human cerebral cortex. PLoS Biol. 2008;6:e159. doi: 10.1371/journal.pbio.0060159. [DOI] [PMC free article] [PubMed] [Google Scholar]
- Hahn TT, Sakmann B, Mehta MR. Phase-locking of hippocampal interneurons' membrane potential to neocortical up-down states. Nat Neurosci. 2006;9:1359–1361. doi: 10.1038/nn1788. [DOI] [PubMed] [Google Scholar]
- He BJ, Snyder AZ, Zempel JM, Smyth MD, Raichle ME. Electrophysiological correlates of the brain's intrinsic large-scale functional architecture. Proc Natl Acad Sci U S A. 2008;105:16039–16044. doi: 10.1073/pnas.0807010105. [DOI] [PMC free article] [PubMed] [Google Scholar]
- Hedden T, Van Dijk KR, Becker JA, Mehta A, Sperling RA, Johnson KA, Buckner RL. Disruption of functional connectivity in clinically normal older adults harboring amyloid burden. J Neurosci. 2009;29:12686–12694. doi: 10.1523/JNEUROSCI.3189-09.2009. [DOI] [PMC free article] [PubMed] [Google Scholar]
- Jankowsky JL, Fadale DJ, Anderson J, Xu GM, Gonzales V, Jenkins NA, Copeland NG, Lee MK, Younkin LH, Wagner SL, Younkin SG, Borchelt DR. Mutant presenilins specifically elevate the levels of the 42 residue beta-amyloid peptide in vivo: evidence for augmentation of a 42-specific gamma secretase. Hum Mol Genet. 2004;13:159–170. doi: 10.1093/hmg/ddh019. [DOI] [PubMed] [Google Scholar]
- Jones DT, Machulda MM, Vemuri P, McDade EM, Zeng G, Senjem ML, Gunter JL, Przybelski SA, Avula RT, Knopman DS, Boeve BF, Petersen RC, Jack CR., Jr Age-related changes in the default mode network are more advanced in Alzheimer disease. Neurology. 2011;77:1524–1531. doi: 10.1212/WNL.0b013e318233b33d. [DOI] [PMC free article] [PubMed] [Google Scholar]
- Kuchibhotla KV, Goldman ST, Lattarulo CR, Wu HY, Hyman BT, Bacskai BJ. Abeta plaques lead to aberrant regulation of calcium homeostasis in vivo resulting in structural and functional disruption of neuronal networks. Neuron. 2008;59:214–225. doi: 10.1016/j.neuron.2008.06.008. [DOI] [PMC free article] [PubMed] [Google Scholar]
- Lu H, Zuo Y, Gu H, Waltz JA, Zhan W, Scholl CA, Rea W, Yang Y, Stein EA. Synchronized delta oscillations correlate with the resting-state function MRI signal. Proc Natl Acad Sci U S A. 2007;104:18265–18269. doi: 10.1073/pnas.0705791104. [DOI] [PMC free article] [PubMed] [Google Scholar]
- Meyer-Luehmann M, Spires-Jones TL, Prada C, Garcia-Alloza M, de Calignon A, Rozkalne A, Koenigsknecht-Talboo J, Holtzman DM, Bacskai BJ, Hyman BT. Rapid appearance and local toxicity of amyloid-beta plaques in a mouse model of Alzheimer's disease. Nature. 2008;451:720–724. doi: 10.1038/nature06616. [DOI] [PMC free article] [PubMed] [Google Scholar]
- Mormino EC, Smiljic A, Hayenga AO, Onami SH, Greicius MD, Rabinovici GD, Janabi M, Baker SL, Yen IV, Madison CM, Miller BL, Jagust WJ. Relationships between beta-amyloid and functional connectivity in different components of the default mode network in aging. Cereb Cortex. 2011;21:2399–2407. doi: 10.1093/cercor/bhr025. [DOI] [PMC free article] [PubMed] [Google Scholar]
- Pizoli CE, Shah MN, Snyder AZ, Shimony JS, Limbrick DD, Raichle ME, Schlaggar BL, Smyth MD. Resting-state activity in development and maintenance of normal brain function. Proc Natl Acad Sci U S A. 2011;108:11638–11643. doi: 10.1073/pnas.1109144108. [DOI] [PMC free article] [PubMed] [Google Scholar]
- Selkoe DJ. Alzheimer's disease: genes, proteins, and therapy. Physiol Rev. 2001;81:741–766. doi: 10.1152/physrev.2001.81.2.741. [DOI] [PubMed] [Google Scholar]
- Sheline YI, Raichle ME, Snyder AZ, Morris JC, Head D, Wang S, Mintun MA. Amyloid plaques disrupt resting state default mode network connectivity in cognitively normal elderly. Biol Psychiatry. 2010;67:584–587. doi: 10.1016/j.biopsych.2009.08.024. [DOI] [PMC free article] [PubMed] [Google Scholar]
- Stern EA, Bacskai BJ, Hickey GA, Attenello FJ, Lombardo JA, Hyman BT. Cortical synaptic integration in vivo is disrupted by amyloid-beta plaques. J Neurosci. 2004;24:4535–4540. doi: 10.1523/JNEUROSCI.0462-04.2004. [DOI] [PMC free article] [PubMed] [Google Scholar]
- Vlassenko AG, Vaishnavi SN, Couture L, Sacco D, Shannon BJ, Mach RH, Morris JC, Raichle ME, Mintun MA. Spatial correlation between brain aerobic glycolysis and amyloid-beta (Abeta) deposition. Proc Natl Acad Sci U S A. 2010;107:17763–17767. doi: 10.1073/pnas.1010461107. [DOI] [PMC free article] [PubMed] [Google Scholar]
- White BR, Snyder AZ, Cohen AL, Petersen SE, Raichle ME, Schlaggar BL, Culver JP. Resting-state functional connectivity in the human brain revealed with diffuse optical tomography. Neuroimage. 2009;47:148–156. doi: 10.1016/j.neuroimage.2009.03.058. [DOI] [PMC free article] [PubMed] [Google Scholar]
- White BR, Bauer AQ, Snyder AZ, Schlaggar BL, Lee JM, Culver JP. Imaging of functional connectivity in the mouse brain. PLoS One. 2011;6:e16322. doi: 10.1371/journal.pone.0016322. [DOI] [PMC free article] [PubMed] [Google Scholar]
- Yan P, Bero AW, Cirrito JR, Xiao Q, Hu X, Wang Y, Gonzales E, Holtzman DM, Lee JM. Characterizing the appearance and growth of amyloid plaques in APP/PS1 mice. J Neurosci. 2009;29:10706–10714. doi: 10.1523/JNEUROSCI.2637-09.2009. [DOI] [PMC free article] [PubMed] [Google Scholar]
- Zhang D, Raichle ME. Disease and the brain's dark energy. Nat Rev Neurol. 2010;6:15–28. doi: 10.1038/nrneurol.2009.198. [DOI] [PubMed] [Google Scholar]