Abstract
Recent advances in brain-machine interfaces (BMIs) have allowed for high density recordings using microelectrode arrays. However, these large datasets present a challenge in how to practically identify features of interest and discard non- task-related neurons. Thus, we apply a previously reported unsupervised clustering analysis to neural data acquired from a non-human primate as it performed a center-out reach-and-grasp task. Although neurons were recorded from multiple arrays across motor and premotor areas, neurons were found to cluster into only two groups which differ by their mean firing rate. No spatial distribution of neurons was evident in different groups, either across arrays or at different depths. Using a Kalman filter to decode arm, hand, and finger kinematics, we find that using neurons from only one of the groups resulted in higher decoding accuracy (r=0.73) than using randomly selected neurons (r=0.68). This suggests that the proposed method can be used to prune the input space and identify an optimal population of neurons for BMI tasks.
I. Introduction
Brain-machine interfaces (BMIs) have been developed to successfully decode upper arm movements of monkeys in both open-loop [1] and with real-time feedback [2]. Traditionally, BMI researchers have recorded from single cortical sites and been limited to decoding from individual neurons that are found to be tuned to the movement or otherwise task-related [3]. However, recent advances in neural recording now allow for single session datasets with multiple signals obtained at high sampling rates using microelectrode arrays. This increased data has led to the decoding of more complex, multiple-DoF movements [4].
Even in cases where multiple neurons are decoded, only individual contributions to the decoding accuracy are considered and not how neurons function as a group. Neuronal interactions are generally assumed to be stationary, and their groupings constant. In order to extend the capabilities of BMIs, the behavior of neurons as dynamically evolving communities must be considered. For example, although a particular group of neurons may show the highest decoding accuracy during one component of a task, there is no reason to expect the same group will decode a different component similarly well. Furthermore, not all single units from multichannel recordings are task-related and thus potentially contribute only noise to the decoding filter. Presumably, neurons that are not relevant to the task would exhibit different firing rate profiles and could thus be identified and pruned from the input space ahead of time.
Finding community structure in neuronal data is complicated by several factors. First, the true number of neuronal groups is not known – and thus methods that specify the number of groups a priori artificially bias the observed structure. Second, most grouping techniques are semi-supervised and thus require the specification of additional initial parameters [5]. In order to overcome these issues, we employ a novel clustering technique described by Humphries [6], which identifies neuronal communities based on similarities between spike trains. This technique is also robust in that it self-determines the number of groups and clusters neurons accordingly.
We apply this clustering technique to spiking data collected from primates as they perform a center-out reach-and-grasp task. This paper has three goals: (1) we will group across all trials for each neuron to determine whether neurons have a stereotypical response for identical motor movements, (2) we will then group across all neurons and investigate how neurons are grouped spatially across arrays, and whether this grouping is different for each movement type, and (3) we will see if the resultant grouping can be used for feature selection in decoding arm, hand, and finger kinematics. Thus, this work aims to provide a better understanding of neuronal behavior across multiple cortical regions during a BMI motor task.
II. Methods
A. Experimental Setup
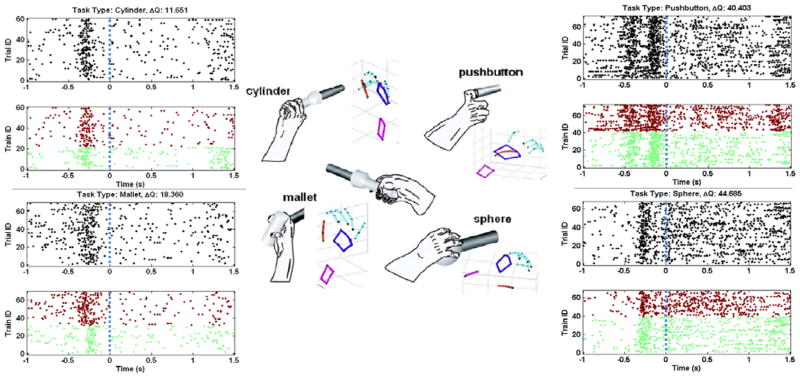
A male rhesus monkey (M. mulatta) was visually cued to reach towards and grasp four different objects at different spatial locations (Fig. 1, middle). After grasping, the monkey was required to rotate the sphere 45°, pull the perpendicularly mounted cylinder (mallet), depress the pushbutton, or pull the coaxial cylinder. Single-unit activity was recorded using a Plexon (Dallas, TX) data acquisition system from five floating microelectrode arrays (FMA) in the primary motor cortex (M1), one each in dorsal (PMd) and ventral (PMv) premotor cortex, and one in the primary somatosensory cortex (S1). Each FMA consisted of 16 electrodes and up to four single-units could be discriminated per electrode. Upper-limb kinematics were simultaneously tracked using a Vicon (Oxford, UK) motion capture system with 30 markers on the forearm, palm, and individual fingers. Joint angles of the hand, wrist, and fingers were calculated using methods described in [7].
Figure 1.
Simultaneous neural and kinematic activity was recorded from a non-human primate as it reached towards and grasped four different objects in space (middle). Activity of a single neuron (sig 099a, M1) was grouped across all trials for each of the four object types (clockwise from top left: cylinder, pushbutton, mallet, sphere). The spike trains are ordered by trial number and by group assignment from the clustering analysis (green = group 1; red = group 2). The vertical dashed line at t=0 indicates time of object grasp.
B. Clustering Algorithm
Neurons were grouped using the clustering algorithm described in detail by Humphries [6] and implemented in Matlab 7.4 (MathWorks, Inc., Natick, MA). A summary of the key steps is presented here.
As a pre-processing step, individual spike trains were first binned at different time scales. The similarity between any two spike trains was assessed by computing the Hamming distance, which is defined as the proportion of identical bins in each spike train. In this fashion, a similarity matrix C was constructed for all pair-wise comparisons of spike trains,
| (1) |
where hij is the Hamming distance between the ith and jth spike trains. The diagonal of C was set to zero, so that self-similarity would not influence grouping.
The clustering technique uses network theory to describe the similarity matrix as an undirected network, where each spike train represents a node. The goal is to thus maximize the modularity Q over all possible divisions of the network,
| (2) |
where C is the similarity matrix from before; P is the null-network model that captures the expected number of links within each community, and S is a matrix denoting which group that a node belongs to. In other words, P represents the pair-wise probability of spike trains forming connections with each other and is defined as,
| (3) |
where di is the total strength of connections from node i, and m is the total strength of all of connections in the network. S represents the grouping matrix and is defined as,
| (4) |
Rather than fixing the number of groups a priori, both the number of groups and group memberships of all nodes are determined iteratively. To determine an upper bound on the number of possible groups, we performed singular value decomposition on the modularity matrix B = C − P, and retained all N eigenvectors with positive eigenvalues. We then performed K-mean clustering for K=2…N+1 possible groupings and calculated QK for each case.
In order to account for spurious groupings due to patterned firing of individual neurons, the same grouping analysis was performed after randomly shuffling the inter-spike intervals (ISIs) of each spike train to form new spike trains [6]. While the mean and variance of the firing rates are unaltered, cross-correlations between spike trains are eliminated. The shuffling was repeated 20 times and the maximum modularity score QC was used as an upper-bound for the control case. The grouping matrix S that results in the maximum difference ΔQmax between the modularity score for the experimental data and the control data is retained.
| (5) |
In order to determine the optimal number of groups and time scale for the clustering analysis, a golden-section search with parabolic interpolation [8, 9] was used to repeat the clustering with varying bin sizes until it converged to a maximal ΔQmax, i.e. the maximally effective grouping.
C. Decoding Hand and Finger Kinematics
For continuous prediction of arm, hand, and finger kinematics, a single Kalman filter was used to model the relationship between neural activity and the 18 joint angles. In the Kalman framework described in detail in [11], each joint angle is modeled as the system state, Y, and the mean spike firing rate during the previous 100 ms is modeled as the observation, X. At each discrete 20 ms time step tk, the observed neural activity is modeled as,
| (7) |
and the state estimate model is defined as,
| (8) |
where H and A are coefficient matrices, and q(t) ~ N(0,Q) and w(t) ~ N(0,W). Neurons with a mean firing rate of less than 1 Hz were removed from the population. Mutually exclusive feature sets were used for training and testing, and results were averaged using fivefold cross-validation.
III. Results
A. Single Neuron Analysis
Fig. 1 shows the activity of a single neuron recorded from an array in M1, grouped across all trials for each of the four object types (cylinder, pushbutton, mallet, sphere). Individual trials were aligned to the time at which the monkey grasped the instructed object. To facilitate comparison across movement types, a fixed bin size of 100 ms was used for clustering. As can be seen, the neuron exhibited two different firing rate responses (green, red) for each of the movements. This suggests that some extrinsic factor unrelated to differences in the task conditions may affect the modulation of that neuron.
This particular neuron shows a stereotypical increase in firing rate during the period immediately preceding object grasp (t=0), as did others from M1. Visual inspection of the neural response for each group suggests that trials are separated primarily based on differences in the firing patterns prior to grasping. Specifically, trials in the green group appear to have a lower firing rate during the reach period than trials in the red group.
B. Multiple Neurons, Combined Movements
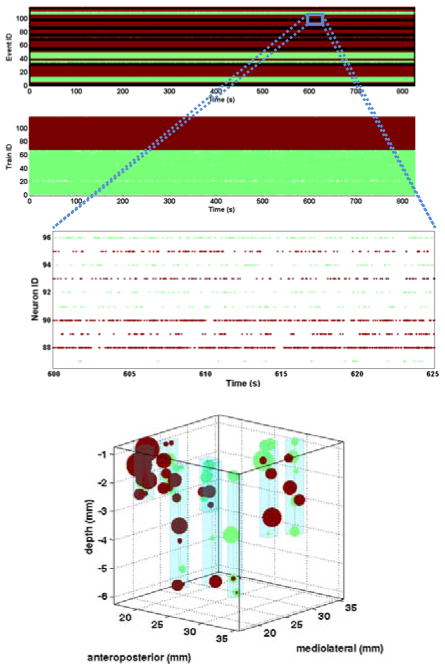
Fig. 2A shows the grouping across all neurons recorded from the eight FMAs. For each neuron, all trials for the four object types were concatenated to form a single continuous spike train. As can be seen in Fig. 2B, neurons were grouped into one of two groups: neurons that fire sporadically (green, mean firing rate = 4.2 Hz) and neurons with patterned activity or high firing rate (red, mean firing rate = 16.7 Hz). Grouping across all movement types yielded an optimal bin size of 93 ms and a corresponding ΔQ of 218.4.
Figure 2.
A) Grouping of neurons from all seven arrays into one of two groups (green, red), ordered by neuron number in each array (top) and group number (bottom). B) Zooming in on a 25 sec window for sample M1 neurons reveals differences in neuronal response for members of each group, primarily based on firing rate C) Spatial distribution of neurons across all eight arrays. The size of each sphere represents how strongly the neuron belongs to its group, and color indicates group membership. Light blue cubes indicate the volume occupied by each FMA.
To investigate spatial patterns in the neuron groupings, Fig. 2C shows the location of each neuron, colored according to its group membership. Neuron locations were determined from the positions of each array and the known length of each electrode. The sphere size for each neuron represents how strongly the neuron belongs to its group, and is inversely proportional to the square of the Euclidian distance between the neuron’s location in the eigen space and the K-means centroid of the group. No clear spatial organization is evident as neurons from both groups are distributed across all arrays and at different cortical depths.
C. Comparing Group Membership
To compare how the same population of neurons was assigned to groups for each of the different task conditions separately, we calculated the normalized mutual information (MI) which provides a measure of how similar a group assignment from one set of data is to another set of data through the following equation [10]:
| (9) |
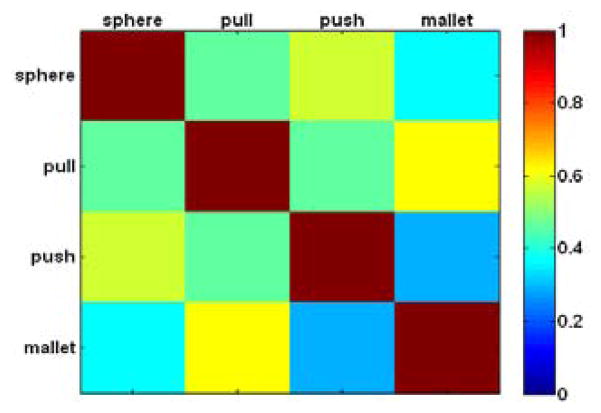
where N is a confusion matrix whose rows are group assignments for the first task condition and columns are group assignments for the second task condition. Nij is the number of nodes (i.e. neurons) in the first task condition’s ith group that appears in the second task condition’s jth group. As seen in Fig. 3, neurons were assigned to relatively similar groups across all four task conditions, with the smallest MI between the pushbutton and mallet object types.
Figure 3.
Normalized mutual information (MI) between group assignments (i.e. distribution of neurons assigned to group 1 or group 2) for grasping of each of the four different objects.
D. Decoding Results
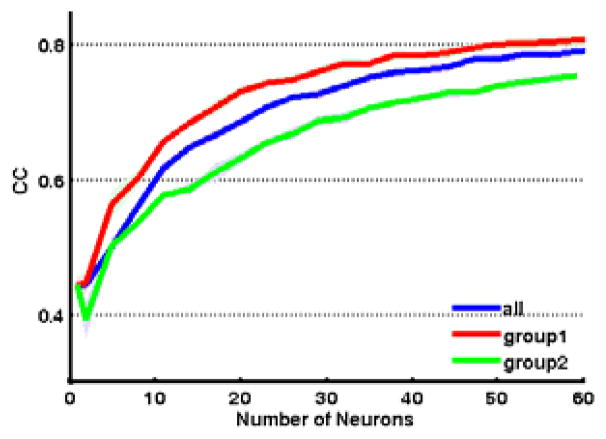
Fig. 4 shows the Pearson correlation coefficients (r) for continuous prediction of arm, hand, and finger kinematics as a function of high firing group 1 neurons (red), low firing group 2 neurons (green), or randomly selected neurons (blue). The correlation values shown are averaged across all 18 joint angles. As can be seen, the average decoding accuracy using group 1 neurons was statistically significantly higher than that using group 2 neurons or randomly selected neurons (p<0.05). This difference was more evident with fewer neurons (for n=20: group 1, avg r=0.73; group 2, avg r=0.63; random, avg r=0.68) Therefore, this clustering method could help prune the input space to use neurons that are optimal for decoding.
Figure 4.
Correlation coefficients (r) for prediction of arm, hand, and finger kinematics, as a function of group 1 neurons (red), group 2 neurons (green), or randomly selected neurons (blue).
IV. Discussion and Conclusion
It is somewhat surprising to discover that an individual neuron’s firing rate response varied over time for a given movement, even though the monkey performed fairly stereotypical movements for each object type. From the grouping analysis, we find that neurons are separated based on how they respond to certain phases of the task, which facilitates comparison of firing properties during a single response type. It is also informative that the optimal grouping resulted in two groups, which suggests that the elicited response may actually be influenced by some extrinsic binary factor independent of the object being grasped, e.g., whether the monkey was gazing at the target object during grasp or elsewhere. Without this grouping analysis, these trial-to-trial variations in neuronal response would be hidden by the more global response archetypes that are distributed over repeated trials.
Grouping across neurons from all arrays, however, no longer distinguishes groups based on event-locked responses, but instead selects for differences in firing rate profiles over a longer timescale. In addition, this grouping analysis reveals that there is no obvious spatial distribution of neurons from different groups, either across arrays or at different depths. This provides more evidence for a complex and heterogeneous organization of the motor cortex, which has been found to lack strict somatotopy at a fine scale [11].
Lastly, it is important to note that the current clustering technique does not take into account delays between different cortical areas. To account for this, we can compute adjacency matrices for different sets of lags across arrays, and select for the optimal lag that gives the largest ΔQ. This could reveal additional information about network structure and also what delays exist between discrete cortical regions.
Acknowledgments
This work was sponsored in part by the Johns Hopkins Applied Physics Lab under the DARPA Revolutionizing Prosthetics program, contract N66001-06-C-8005; the DARPA REPAIR program, contract 19GM-1088724; NSF ECCS 0835632 and ECCS 0835554; and by the National Science and Engineering Research Council of Canada (NSERC).
Footnotes
33rd Annual International Conference of the IEEE EMBS
Boston, Massachusetts USA, August 30 - September 3, 2011
Contributor Information
Geoffrey I. Newman, Department of Biomedical Engineering at The Johns Hopkins University, Baltimore, MD.
Vikram Aggarwal, Department of Biomedical Engineering at The Johns Hopkins University, Baltimore, MD.
Marc H. Schieber, Department of Neurology, Neurobiology, and Anatomy at the University of Rochester Medical Center, Rochester, NY
Nitish V. Thakor, Department of Biomedical Engineering at The Johns Hopkins University, Baltimore, MD
References
- 1.Taylor DM, et al. Direct cortical control of 3D neuroprosthetic devices. Science. 2002 Jun 7;296:1829–32. doi: 10.1126/science.1070291. [DOI] [PubMed] [Google Scholar]
- 2.Velliste M, et al. Cortical control of a prosthetic arm for self-feeding. Nature. 2008 Jun 19;453:1098–101. doi: 10.1038/nature06996. [DOI] [PubMed] [Google Scholar]
- 3.Schwartz AB, et al. Extraction algorithms for cortical control of arm prosthetics. Curr Opin Neurobiol. 2001 Dec;11:701–7. doi: 10.1016/s0959-4388(01)00272-0. [DOI] [PubMed] [Google Scholar]
- 4.Vargas-Irwin CE, et al. Decoding complete reach and grasp actions from local primary motor cortex populations. J Neurosci. 2010 Jul 21;30:9659–69. doi: 10.1523/JNEUROSCI.5443-09.2010. [DOI] [PMC free article] [PubMed] [Google Scholar]
- 5.Slonim N, et al. Information-based clustering. Proc Natl Acad Sci U S A. 2005 Dec 20;102:18297–302. doi: 10.1073/pnas.0507432102. [DOI] [PMC free article] [PubMed] [Google Scholar]
- 6.Humphries MD. Spike-train communities: finding groups of similar spike trains. J Neurosci. 2011 Feb 9;31:2321–36. doi: 10.1523/JNEUROSCI.2853-10.2011. [DOI] [PMC free article] [PubMed] [Google Scholar]
- 7.Aggarwal V, et al. Cortical Control of Reach and Grasp Kinematics in a Virtual Environment using Musculoskeletal Modeling Software. Conf Proc IEEE Eng Med Biol Soc Neural Eng. 2011 vol. in press. [Google Scholar]
- 8.Forsythe GE, et al. Prentice Hall Professional Technical Reference. 1977. Computer Methods for Mathematical Computations. [Google Scholar]
- 9.Brent RP. Algorithms for Minimization Without Derivatives. Englewood Cliffs, New Jersey: Prentice-Hall; 1973. [Google Scholar]
- 10.Danon DJAAD-GAL. COSIN Book. 2005. Comparing community structure identification. [Google Scholar]
- 11.Schieber MH, Hibbard LS. How somatotopic is the motor cortex hand area? Science. 1993 July 23;261:489–492. doi: 10.1126/science.8332915. [DOI] [PubMed] [Google Scholar]


