Abstract
The bioresorbable vascular stent (BVS) is totally translucent and radiolucent, leading to challenges when using conventional invasive imaging modalities. Agreement between quantitative coronary angiography (QCA), intravascular ultrasound (IVUS) and optical coherence tomography (OCT) in the BVS is unknown. Forty five patients enrolled in the ABSORB cohort B1 study underwent coronary angiography, IVUS and OCT immediately post BVS implantation, and at 6 months. OCT estimated stent length accurately compared to nominal length (95% CI of the difference: −0.19; 0.37 and −0.15; 0.47 mm2 for baseline and 6 months, respectively), whereas QCA incurred consistent underestimation of the same magnitude at both time points (Pearson correlation = 0.806). IVUS yielded low accuracy (95% CI of the difference: 0.77; 3.74 and −1.15; 3.27 mm2 for baseline and 6 months, respectively), with several outliers and random variability test–retest. Minimal lumen area (MLA) decreased substantially between baseline and 6 months on QCA and OCT and only minimally on IVUS (95% CI: 0.11; 0.42). Agreement between the different imaging modalities is poor: worst agreement Videodensitometry-IVUS post-implantation (ICCa 0.289); best agreement IVUS-OCT at baseline (ICCa 0.767). All pairs deviated significantly from linearity (P < 0.01). Passing-Bablok non-parametric orthogonal regression showed constant and proportional bias between IVUS and OCT. OCT is the most accurate technique for measuring stent length, whilst QCA incurs systematic underestimation (foreshortening) and solid state IVUS incurs random error. Volumetric calculations using solid state IVUS are therefore not reliable. There is poor agreement for MLA estimation between all the imaging modalities studied, including IVUS-OCT, hence their values are not interchangeable.
Electronic supplementary material
The online version of this article (doi:10.1007/s10554-011-9829-y) contains supplementary material, which is available to authorized users.
Keywords: Coronary angiography, Poly(lactide), Quantitative coronary angiography, Intravascular ultrasound, Tomography, Optical coherence
Introduction
The Bioresorbable Vascular Stent (BVS) (Abbott Vascular, Santa Clara, CA, USA) consists of a semi-crystalline poly-L-lactide (PLLA) backbone, coated by a thin amorphous layer of poly-D,L-lactide (PDLLA) containing the antiproliferative agent everolimus. The device has enough radial strength to counteract vascular recoil after angioplasty, while the sustained elution of everolimus inhibits neointimal hyperplasia. BVS struts are progressively degraded by hydrolysis and fully resorbed 2 years after implantation [1]. Two small platinum markers at the proximal and distal edges ease fluoroscopic visualization during deployment and angiographic follow-up.
In contrast to metallic stents, the BVS is translucent to optical radiation and totally radiolucent to gamma radiation, with the only exception the radiopaque platinum markers at the edges. Therefore, imaging the BVS with optical coherence tomography (OCT) or quantitative coronary angiography (QCA) requires a specific approach. In the case of QCA, videodensitometry (VD) is particularly interesting because the radiodensity of metallic stents leads to overestimation of minimal lumen area (MLA) [2], which the BVS can theoretically circumvent.
The BVS has been clinically tested in multi-national studies involving highly specialized centres [1, 3, 4] with multiple imaging techniques, including intravascular ultrasound (IVUS) [1, 3–5], three-dimensional QCA [5], multi-slice computed tomography (MSCT) [5] and OCT [1, 3, 4]. Nevertheless, in anticipation of the forthcoming widespread availability of the BVS, comprehensive comparative studies are needed for the correct interpretation of these results. Recent studies have compared QCA with MSCT immediately after stent deployment [5], however they included neither IVUS or OCT, or the comparison between VD and edge detection (ED). Furthermore they also failed to provide any data on the eventual influence of shrinkage or resorption on the imaging parameters.
The present study compares different imaging modalities in the BVS immediately after implantation and at 6 months. This time point represents the transition between the restoration phase (loss of structural integrity, restoration of vascular reactivity) and the resorption phase (loss of mass) of the device [6]. Stent length and MLA were the parameters chosen for the head-to-head comparison: the former for being stable with time and known a priori, the latter for being the most clinically relevant [7–9].
Methods
Study sample
The design of the ABSORB Cohort B study (NCT00856856) has been previously described [4]. It enrolled patients with stable/unstable angina pectoris or silent ischemia, due to de novo coronary lesions amenable for percutaneous treatment with the BVS: diameter stenosis ≥50% and reference vessel diameter 2.5–3.5 mm. Major exclusion criteria were: acute myocardial infarction, unstable arrhythmias, left ventricular ejection fraction ≤30%, restenotic lesions, lesions located in the left main or in bifurcations involving a side branch >2 mm, a second clinically or hemodynamically significant lesion in the target vessel, intracoronary thrombus, or initial TIMI flow 0. The cohort was subdivided in two groups: cohort B1 underwent multimodality invasive imaging (QCA, IVUS, virtual histology, palpography and OCT) at 6 and 24 months; whereas cohort B2 underwent an identical imaging follow-up protocol scheduled at 12 and 24 months. The availability of the different imaging modalities varied depending on the sites. All the study lesions were treated with the BVS revision 1.1 (3.0 × 18 mm). The registry was approved by the ethics committee at each participating institution and each patient gave written informed consent before inclusion.
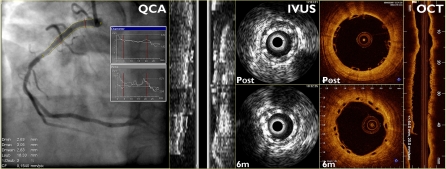
The present study compares the multi-imaging results of cohort B1 (Fig. 1), post-implantation and at 6 months, analyzed in a core-lab setting (Cardialysis BV, Rotterdam, The Netherlands).
Fig. 1.
Case example illustrating the three imaging modalities compared in this study: quantitative coronary angiography (QCA), phased array solid state intravascular ultrasound (IVUS) and optical coherence tomography (OCT)
Angiography and QCA analysis
Coronary arteriography was performed according to standard procedures [10], using consecutive single-plane orthogonal projections of the target lesion. QCA was performed with the CAAS II system [11] (Pie Medical BV, Maastricht, The Netherlands). The small radiopaque markers at the ends of the stent helped with the localisation of the radiolucent device for definition of the in-stent segment. In-stent MLA by VD was automatically calculated by the software through densitometric analysis. In-stent MLA by ED was calculated from the in-stent minimal lumen diameter (MLD), which was provided by the software, using the formula: MLA = 3.14 × (MLD/2) [2].
IVUS study
The stented segments were examined with phased array solid state IVUS catheters (EagleEye; Volcano Corporation, Rancho Cordova, CA, USA) with an automated pullback at 0.5 mm/s. A region of interest beginning 5 mm distal and extending 5 mm proximal to the stented segment was defined for off-line analysis. Areas were measured with a validated computer-based contour detection programme (CURAD BV, Wijk bij Duurstede, The Netherlands) that allows for semi-automatic detection of lumen, stent and vessel boundaries in longitudinally reconstructed views of the region of interest [12, 13].
OCT study
OCT pullbacks were obtained with M2, M3 or C7 systems (Lightlab Imaging, Westford, Massachusetts, USA), depending on the site, using the occlusive [14] or non-occlusive technique [15], as appropriate. Supplement table 1 provides detailed technical specifications for each system. OCT cross-sections were analysed offline at 1 mm longitudinal intervals within the stented segment and 5 mm proximal and distal to the stent edges, using proprietary software (Lightlab Imaging, Westford, Massachusetts, USA). Lumen contour was automatically detected and manually edited if needed. OCT in-stent MLA was defined as the minimal lumen area in the segment between the distal and proximal tips of the stent.
Statistical analysis
Descriptive statistics and Saphiro–Wilks test for normality of the distribution were reported for each variable. Means were compared with t test for paired samples.
For MLA, agreement between methods was tested by intraclass correlation coefficients (for absolute agreement and consistency). Passing-Bablok non-parametric orthogonal regression analysis was performed in order to detect constant or proportional biases between imaging modalities, using OCT values in the y axis, since it has been validated in vitro and in vivo for measurement of lumen area [16, 17] and showed the best reproducibility of all the methods hitherto [18–20]. Systematic constant or proportional biases were defined as a constant or a slope significantly different than 0 or 1 in the orthogonal regression equation, respectively. CUSUM test for deviation from linearity respect to the orthogonal regression equation was performed, and absolute agreement tested with Lin’s coefficient.
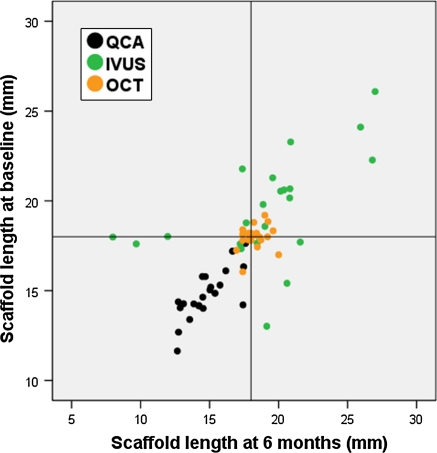
For stent length no proper analysis of agreement between methods could be performed because all the cases in the sample had the same objective measurement (18 mm). Test–retest variability was assessed graphically with a “target chart”, correlating MLA measurements post-implantation with those at 6 months follow-up, and drawing the corresponding reference lines at 18 mm. The intersection of both reference lines defines the centre of a target corresponding to the methods measuring exactly 18 mm of length at both time points.
All the analyses and graphics were performed with the PASW 17.0.2 statistical package (SPSS Inc., Chicago, IL, USA).
Results
Immediately post-stenting, QCA analysis was available in 45 patients, IVUS in 40, OCT in 29 and all the imaging techniques together in 26 patients. At 6 months follow-up, QCA was available in 42, IVUS in 40, OCT in 28 and the three techniques in 27 patients.
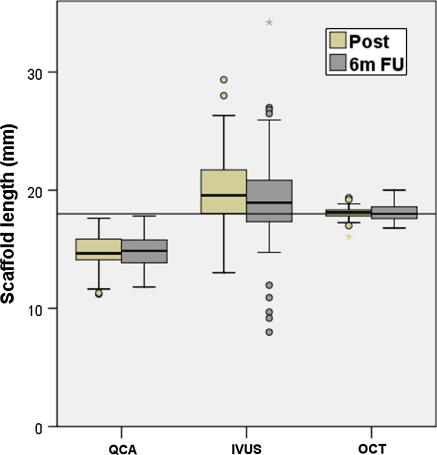
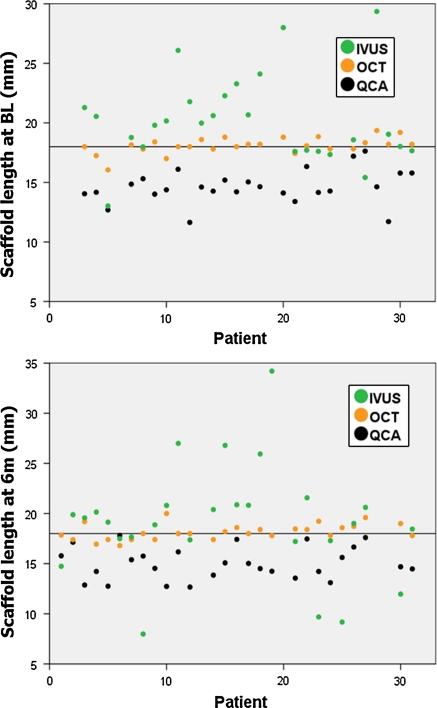
Table 1 shows the descriptive statistics of the stent length measured by the different imaging modalities. Figures 1 and 2 show the box-plot distribution and the individual measurements, with a reference line at 18 mm (nominal length of the stent). QCA underestimates length, whilst OCT remains very close to the nominal value, with very low variability. Solid state IVUS shows the lowest accuracy for length measurements, with wide dispersion and several outliers.
Table 1.
Stent length measured by the different imaging modalities immediately post-stenting and at 6 months follow-up
| Stent length (mm) | n | Mean | Median | SD | P25 | P75 | Min | Max | Saphiro–Wilk | |
|---|---|---|---|---|---|---|---|---|---|---|
| QCA | Post | 26 | 14.62 | 14.49 | 1.40 | 14.09 | 15.43 | 11.64 | 17.63 | 0.285 |
| 6m FU | 27 | 15.01 | 14.69 | 1.60 | 13.86 | 16.18 | 12.67 | 17.81 | 0.153 | |
| IVUS | Post | 26 | 20.26 | 19.89 | 3.67 | 17.69 | 21.90 | 13.02 | 29.35 | 0.127 |
| 6m FU | 27 | 19.06 | 19.14 | 5.59 | 17.29 | 20.82 | 7.99 | 34.20 | 0.060 | |
| OCT | Post | 26 | 18.10 | 18.15 | 0.65 | 17.82 | 18.37 | 16.05 | 19.36 | 0.107 |
| 6m FU | 27 | 18.16 | 18.00 | 0.79 | 17.40 | 18.60 | 16.80 | 20.00 | 0.551 | |
IVUS intravascular ultrasound, OCT optical coherence tomography, QCA quantitative coronary angiography, 6m FU 6 months follow-up
Fig. 2.
Box plot showing the length of the stent measured by the different imaging modalities immediately post-implantation and at 6 months follow-up. The reference line represents the nominal length of the device (18 mm). IVUS intravascular ultrasound, OCT optical coherence tomography, QCA quantitative coronary angiography, 6m FU 6 months follow-up
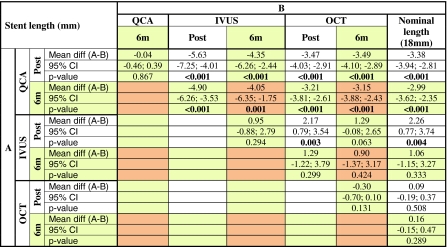
Table 2 shows the paired comparison of the means for length measurement, as a chess table. QCA significantly underestimates length compared to IVUS, OCT and to the nominal length, post implant (white squares) and at 6 months (orange squares). On the contrary, IVUS overestimates length with respect to OCT and the nominal value, only significantly at baseline (Fig. 3).
Table 2.
Stent length measured by the different imaging modalities immediately post-stenting and at 6 months follow-up
“Chess table” showing the paired comparison of the means: white cells for post-post; yellow cells for post-6m; orange cells for 6m–6m comparisons
CI confidence interval, IVUS intravascular ultrasound, OCT optical coherence tomography, QCA quantitative coronary angiography, 6m 6 months follow-up
Fig. 3.
Individual measurements of the stent length by the different imaging modalities immediately post-implantation and at 6 months follow-up. The reference line represents the nominal length of the device (18 mm). BL baseline (immediately post-implantation), IVUS intravascular ultrasound, OCT optical coherence tomography, QCA quantitative coronary angiography
Figure 4 shows the “target chart”, depicting the test–retest variability between post-implant and 6 months follow-up for stent length measurements. QCA shows a typical systematic bias: variable underestimation of length in the different cases, but consistent underestimation of the same magnitude at both time points (Pearson correlation = 0.806; ICCa = 0.808; ICCc = 0.803), eventually due to the effect of foreshortening on length measurements. OCT proves reproducible accuracy, being close to the nominal length at both time points, whilst IVUS shows random variability, with an unpredictable pattern.
Fig. 4.
“Target graphic” depicting the variability test–retest of the different imaging modalities for the measurement of stent length. Reference lines represent the nominal length of the device (18 mm). IVUS intravascular ultrasound, OCT optical coherence tomography, QCA quantitative coronary angiography
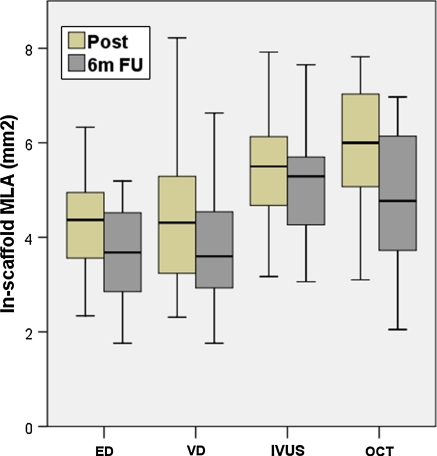
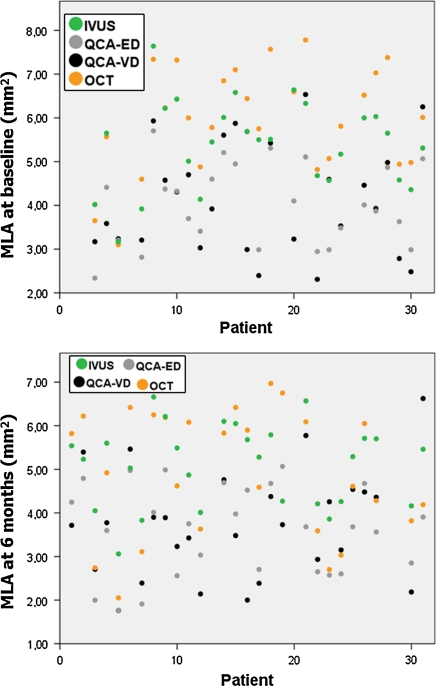
Table 3 shows the descriptive statistics of the in-stent MLA measured by the different imaging modalities. Figure 5 shows the MLA box-plots. Both QCA methods (ED and VD) have similar distribution, and OCT provides the largest MLA at baseline. At 6 months MLA decreases on ED, VD and OCT. In contrast, IVUS MLA decreases to a lesser extent and by 6-months becomes larger than OCT MLA. Individual measurements of in-stent MLA (Fig. 6) show very wide variability between different imaging modalities within the same patient, with no clear ranking as for the magnitude.
Table 3.
In-stent minimal lumen area measured by the different imaging modalities immediately post-stenting and at 6 months follow-up
| MLA (mm2) | n | Mean | Median | SD | P25 | P75 | Min | Max | Saphiro–Wilk | |
|---|---|---|---|---|---|---|---|---|---|---|
| QCA-ED | Post | 26 | 4.08 | 4.06 | 0.97 | 3.15 | 4.98 | 2.34 | 5.70 | 0.370 |
| 6m FU | 27 | 3.61 | 3.68 | 1.02 | 2.65 | 4.68 | 1.76 | 5.07 | 0.107 | |
| QCA-VD | Post | 26 | 4.12 | 3.93 | 1.26 | 3.14 | 5.09 | 2.31 | 6.54 | 0.179 |
| 6m FU | 27 | 3.73 | 3.73 | 1.23 | 2.71 | 4.48 | 1.76 | 6.63 | 0.669 | |
| IVUS | Post | 26 | 5.39 | 5.51 | 1.01 | 4.58 | 6.08 | 3.17 | 7.64 | 0.965 |
| 6m FU | 27 | 5.11 | 5.29 | 0.94 | 4.21 | 5.71 | 3.06 | 6.66 | 0.236 | |
| OCT | Post | 26 | 5.97 | 6.01 | 1.21 | 4.97 | 7.05 | 3.10 | 7.78 | 0.366 |
| 6m FU | 27 | 4.92 | 4.92 | 1.45 | 3.63 | 6.19 | 2.05 | 6.97 | 0.040 | |
IVUS intravascular ultrasound, ED edge detection, MLA minimal lumen area, OCT optical coherence tomography, QCA quantitative coronary angiography, VD videodensitometry, 6m FU 6 months follow-up
Fig. 5.
Box plot showing the minimal lumen area (MLA) of the stent measured by the different imaging modalities immediately post-implantation and at 6 months follow-up. ED edge detection, IVUS intravascular ultrasound, MLA minimal lumen area, OCT optical coherence tomography, QCA quantitative coronary angiography, VD videodensitometry, 6m FU 6 months follow-up
Fig. 6.
Individual measurements of the minimal lumen area (MLA) by the different imaging modalities immediately post-implantation and at 6 months follow-up. ED edge detection, IVUS intravascular ultrasound, MLA minimal lumen area, OCT optical coherence tomography, QCA quantitative coronary angiography, VD videodensitometry
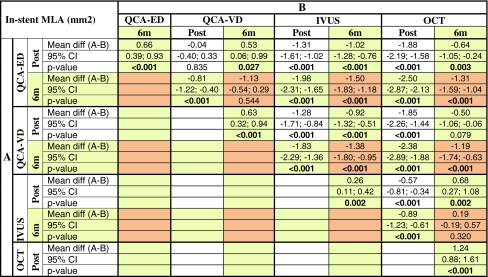
Table 4 shows the paired comparison of the means for MLA, as a chess table. Both QCA methods (ED and VD) significantly underestimate MLA compared to IVUS and OCT at baseline (white cells) and at 6 months (orange cells). IVUS significantly underestimates MLA compared to OCT at baseline, but not at 6 months. The reason for this is that the reduction in MLA between baseline and 6 months (yellow squares) detected by IVUS (mean 0.26 mm2) is much less than in any other imaging modality: 1/2 of that detected by QCA (mean 0.66 mm2 for ED, 0.63 for VD) or 1/5 of that detected by OCT (mean 1.24 mm2), (Fig. 6).
Table 4.
In-stent minimal lumen area measured by the different imaging modalities immediately post-stenting and at 6 months follow-up
“Chess table” showing the paired comparison of the means: white cells for post–post; yellow cells for post-6m; orange cells for 6m–6m comparisons
CI confidence interval, ED edge detection, IVUS intravascular ultrasound, MLA minimal lumen area, OCT optical coherence tomography, QCA quantitative coronary angiography, VD videodensitometry, 6m FU 6 months follow-up
Table 5 shows the agreement between the different imaging modalities for MLA. ED and VD have moderate agreement at baseline (ICCa = 0.687) and follow-up (ICCa = 0.568). Both QCA methods have very poor agreement with either IVUS or OCT. IVUS has good agreement with OCT at baseline (ICCa = 0.767) but only moderate at 6 months (ICCa = 0.684).
Table 5.
Concordance between different imaging modalities for in-stent minimal lumen area
| MLA (mm2) | VD | IVUS | OCT | ||
|---|---|---|---|---|---|
| Post-implant (n = 26) | ED | ICCa | 0.687 (0.411, 0.847) | 0.391 (−0.097, 0.748) | 0.310 (−0.064, 0.694) |
| ICCc | 0.679 (0.402, 0.842) | 0.731 (0.485, 0.870) | 0.765 (0.542, 0.887) | ||
| VD | ICCa | 0.343 (−0.097; 0.672) | 0.315 (−0.096, 0.681) | ||
| ICCc | 0.551 (0.215, 0.770) | 0.665 (0.380, 0.834) | |||
| IVUS | ICCa | 0.767 (0.184, 0.919) | |||
| ICCc | 0.864 (0.719, 0.936) | ||||
| 6 months (n = 27) | ED | ICCa | 0.568 (0.245, 0.777) | 0.300 (−0.095, 0.664) | 0.549 (−0.088, 0.850) |
| ICCc | 0.562 (0.238, 0.773) | 0.648 (0.361, 0.822) | 0.848 (0.694, 0.928) | ||
| VD | ICCa | 0.289 (−0.103, 0.623) | 0.329 (−0.050, 0.629) | ||
| ICCc | 0.512 (0.171, 0.744) | 0.450 (0.091, 0.705) | |||
| IVUS | ICCa | 0.684 (0.421, 0.842) | |||
| ICCc | 0.684 (0.417, 0.843) | ||||
All values are significant at a level of P < 0.01
CI confidence interval, ED edge detection, ICCa intraclass correlation coefficient for absolute agreement, ICCc intraclass correlation coefficient for consistency, IVUS intravascular ultrasound, MLA minimal lumen area, OCT optical coherence tomography, QCA quantitative coronary angiography, VD videodensitometry
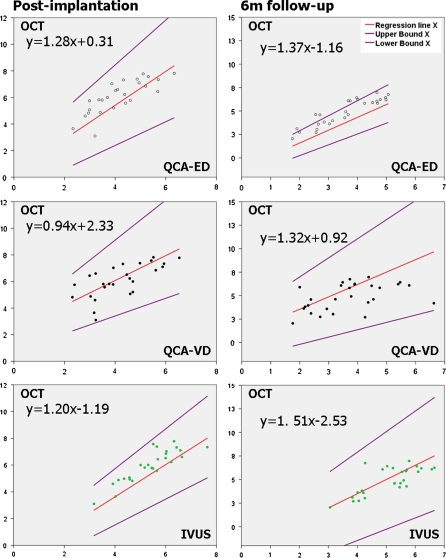
The low level of agreement between QCA and OCT for in-stent MLA measurement prevents the reliable detection of any type of bias in Passing-Bablok non-parametric orthogonal regression (Table 6, Fig. 7). Significant constant and proportional bias is detected between ED and OCT at 6 months, due to a somewhat better agreement between both methods (Lin’s coefficient = 0.550). IVUS incurs a significant constant and proportional bias respect to OCT (at baseline only the constant is significant, but the slope is close to reaching statistical significance: 95% CI 0.97; 1.49).
Table 6.
Concordance between different imaging modalities for in-stent minimal lumen area immediately post-implantation and at 6 months follow-up: results of Passing-Bablok non-parametric orthogonal regression
| MLA (mm2) | Y = OCT | |||||||||
|---|---|---|---|---|---|---|---|---|---|---|
| Constant | 95% CI | Slope | 95% CI | Discordance | Lin’s coefficient (absolute agreement) | |||||
| Lower | Upper | Lower | Upper | |||||||
| Post | X= | QCA-ED | 0.31 | −1.19 | 1.70 | 1.28 | 0.89 | 1.69 | NS | 0.325 |
| QCA VD | 2.33 | 0.74 | 3.08 | 0.94 | 0.67 | 1.51 | Constant | 0.306 | ||
| IVUS | −1.19 | −2.34 | −0.23 | 1.20 | 0.97 | 1.49 | Constant | 0.764 | ||
| 6m | X= | QCA-ED | −1.16 | −2.07 | −0.32 | 1.37 | 1.15 | 1.60 | Const & prop | 0.550 |
| QCA VD | 0.92 | −1.75 | 2.92 | 1.32 | 0.78 | 2.04 | NS | 0.330 | ||
| IVUS | −2.53 | −6.26 | −0.82 | 1.51 | 1.20 | 2.18 | Const & prop | 0.676 | ||
CUSUM test for deviation of normality <0.01 in all cases
CI confidence interval, ED edge detection, IVUS intravascular ultrasound, MLA minimal lumen area, OCT optical coherence tomography, QCA quantitative coronary angiography, VD videodensitometry, 6m 6 months follow-up, NS non-significant, Const & prop constant and proportional
Fig. 7.
Passing-Bablok non-parametric orthogonal regression of minimal lumen area (MLA) measured by the different imaging modalities (x axis) and that measured by optical coherence tomography (y axis). Data immediately post-implantation and at 6 months follow-up. ED edge detection, IVUS intravascular ultrasound, MLA minimal lumen area, OCT optical coherence tomography, QCA quantitative coronary angiography, VD videodensitometry
Discussion
Coronary stenting is one of those exceptional scenarios in biological sciences, in which a structure of fixed and known size can be repeatedly measured with different diagnostic tools and along different time points. Stent length is known a priori and does not change with time. This applies also to the BVS device, with an additional peculiarity: all the analyzed stents have exactly the same nominal length (18 mm). This rare situation precludes the application of conventional statistical tests for the analysis of agreement, which are initially conceived to test a linear relationship between two different methods along a range of different values. Nevertheless, it is an opportunity to extract unique information through a different approach. Thus, the so called “target chart” (Fig. 3) depicts the effect of foreshortening on QCA length measurements, in a clear and illustrative way, hereby described for the first time.
Likewise, we can understand graphically the unpredictable random error of IVUS for length measurement, although most of the time, stent length is overestimated. Taking into account that a solid state IVUS was employed in this study, the overestimation is most likely due to an irregular pullback speed. The inaccuracy of solid state IVUS for length measurements is a relevant finding, since it questions the validity of any volumetric analysis performed by this technique, as performed in several trials [21–23], and is an additional argument to favour other estimative parameters of neointimal hyperplasia [24, 25].
OCT appears as a more accurate and reliable tool for length measurements. Several reasons might explain this extra accuracy compared to IVUS. First, OCT is a rotational mechanical scanning system, with the optical catheter pulled back within a sheath; therefore there is less irregularity in the pullback speed. Secondly, OCT systems have fast pullbacks (up to 20 mm/s in the Fourier-domain systems) that minimize the potential error due to cardiac structure motion around the catheter. Finally, the metallic markers at the stent edges, with a typical appearance in the optical image, act as clear landmarks, improving the reproducibility of longitudinal measurements.
The findings regarding in-stent MLA are more problematic to interpret. The first conclusion would be that MLAs measured by the different methods are neither equivalent, nor can they be reliably estimated by any of the others. Even between QCA modalities (ED vs. VD) or between intraluminal imaging techniques (IVUS vs. OCT), no linear relation could be defined. Although this conclusion might sound disheartening, it is the expected result when methods of very different accuracy are compared head-to-head. Therefore, we can conclude that the different imaging modalities in this study have substantial differences in their accuracy to estimate in-stent MLA in the BVS, and thus their values are not interchangeable. The chart in Fig. 6 illustrates at first glance these discrepancies, with no need of any statistical testing. The question which arises, is therefore which technique is the most accurate? Although OCT has been validated in vitro and in vivo for lumen measurements [16, 17], with proven high reproducibility [18–20]. IVUS has also undergone a similar extensive validation process [26–28]. Unfortunately the current study design does not help in answering this question.
In this study in-stent MLA immediately post-stenting was larger when measured by OCT compared with IVUS. This is at variance with other comparative publications in non-stented vessels where IVUS areas were systematically larger than those measured by OCT, using occlusive or non-occlusive techniques [16, 17, 20]. At 6 months follow-up, however, IVUS MLA, was slightly but non-significantly larger than OCT MLA, which is more consistent with the published literature. This might be specific to the BVS, due to its particular design and optical properties that enable OCT to accurately measure the lumen area in the inter-struts spaces, enlarging substantially the OCT lumen areas after implant. Conversely, IVUS signals are very sensitive to artefact induced by the stent, and hence the lumen contour usually follows the adluminal side of the struts, neglecting the inter-struts spaces, and thus underestimating lumen areas with respect to OCT at baseline. At 6 months follow-up the inter-strut spaces have been integrated in the neointimal layer and both OCT and IVUS draw the lumen contour inside the adluminal side of the stent struts. This might explain why the reduction in MLA is maximal in OCT whilst minimal in IVUS.
ED and VD yield similar MLA values in scenarios where the circular shape of the vessel is preserved or restored, like immediately after stenting [29], and more dissimilar values in scenarios where the lumen symmetry is altered, like after atherectomy [30] or after plain balloon angioplasty [29, 31]. In this study, no significant difference between ED and VD MLA was detected either at baseline or at 6 months, suggesting that the circular shape of the vessel is preserved at both time points, in contrast to the findings on BVS revision 1.0 [1]. The device tested in this study is the BVS revision 1.1., which has improved mechanical properties which have been achieved by altering the crystallization process of the polymer, and through some changes to the device design that reduce the maximal circular unsupported stent area [32]. Improved mechanical radial support could result in less shrinkage, with better preservation of luminal symmetry, and thus explain the lack of significant differences between ED and VD MLA. In prior studies VD correlated better and yielded closer values to IVUS than ED [33, 34]. This is not observed in the present study, suggesting that additional factors other than the preservation of regular luminal geometry might also be playing a role.
Limitations
The reduced sample size is a limiting factor in this study. A larger sample size might have permitted a more accurate description of some of the bias detected between techniques.
All the implanted devices in this cohort had the same nominal length (18 mm) and diameter (3 mm). Additional comparative studies including different stent lengths will be required to better understand the accuracy of the imaging modalities for length measurement, since the present analysis is limited in this respect.
Likewise, the linear relations between different diagnostic tests regarding MLA can become unstable when all the measurements are in a narrow range, as it is the case. Further studies including different stent diameters might eventually result in better agreement between the same imaging modalities with respect to MLA.
The poor results found with IVUS might be partially explained by the use of a solid state system. The agreement between IVUS and OCT for length measurement is likely to improve using a mechanical sheath-based scanning system with a more regular pullback speed.
31% of the OCT studies at baseline and 18% at 6 months were acquired using the occlusive technique. This is a limitation of the study, since the occlusive technique provides lower areas and volumes than the non-occlusive one [17]. Nevertheless, in the charts comparing individual measurements this fact did not seem to significantly influence the MLA results.
Conclusions
OCT is the most accurate method to measure BVS length immediately post-implantation and at 6 months follow-up, whilst QCA incurs systematic underestimation and solid state IVUS incurs random error. There is very poor agreement between QCA, IVUS and OCT for the estimation of in-stent MLA, and no linear relation between any of the methods could be demonstrated.
Electronic supplementary material
Below is the link to the electronic supplementary material.
Acknowledgments
Conflict of interest
This study analyzes data from a registry sponsored by ABBOTT Vascular, Santa Clara, CA, USA. The core-lab and CRO responsible for the analysis (Cardialysis BV, Rotterdam) and the participating centres have received grants from the sponsor to run the trial, but the content of this manuscript is an investigator-driven post-hoc analysis. Serruys PW has received speakers’ fees from the sponsor.
Open Access
This article is distributed under the terms of the Creative Commons Attribution Noncommercial License which permits any noncommercial use, distribution, and reproduction in any medium, provided the original author(s) and source are credited.
Footnotes
Clinical trial registration: NCT00856856; URL: http://clinicaltrials.gov/ct2/results?term=NCT00856856.
References
- 1.Serruys PW, Ormiston JA, Onuma Y, Regar E, Gonzalo N, Garcia-Garcia HM, Nieman K, Bruining N, Dorange C, Miquel-Hebert K, Veldhof S, Webster M, Thuesen L, Dudek D. A bioabsorbable everolimus-eluting coronary stent system (ABSORB): 2-year outcomes and results from multiple imaging methods. Lancet. 2009;373:897–910. doi: 10.1016/S0140-6736(09)60325-1. [DOI] [PubMed] [Google Scholar]
- 2.Strauss BH, Rensing BJ, den BA, van der Giessen WJ, Reiber JH, Serruys PW. Do stents interfere with the densitometric assessment of a coronary artery lesion? Cathet Cardiovasc Diagn. 1991;24:259–264. doi: 10.1002/ccd.1810240408. [DOI] [PubMed] [Google Scholar]
- 3.Ormiston JA, Serruys PW, Regar E, Dudek D, Thuesen L, Webster MW, Onuma Y, Garcia-Garcia HM, McGreevy R, Veldhof S. A bioabsorbable everolimus-eluting coronary stent system for patients with single de novo coronary artery lesions (ABSORB): a prospective open-label trial. Lancet. 2008;371:899–907. doi: 10.1016/S0140-6736(08)60415-8. [DOI] [PubMed] [Google Scholar]
- 4.Serruys PW, Onuma Y, Ormiston JA, De Bruyne B, Regar E, Dudek D, Thuesen L, Smits PC, Chevalier B, McClean D, Koolen J, Windecker S, Whitbourn R, Meredith I, Dorange C, Veldhof S, Hebert KM, Rapoza RJ, Garcia-Garcia HM. Evaluation of the second generation of a bioresorbable everolimus drug-eluting vascular scaffold for treatment of de novo coronary artery stenosis: 6-month clinical and imaging outcomes. Circulation. 2010;122:2301–2312. doi: 10.1161/CIRCULATIONAHA.110.970772. [DOI] [PubMed] [Google Scholar]
- 5.Bruining N, Tanimoto S, Otsuka M, Weustink A, Ligthart J, de WS, van MC, Nieman K, de Feyter PJ, van Domburg RT, Serruys PW. Quantitative multi-modality imaging analysis of a bioabsorbable poly-L-lactic acid stent design in the acute phase: a comparison between 2- and 3D-QCA, QCU and QMSCT-CA. EuroIntervention. 2008;4:285–291. doi: 10.4244/EIJV4I2A49. [DOI] [PubMed] [Google Scholar]
- 6.Oberhauser JP, Hossainy S, Rapoza RJ. Design principles and performance of bioresorbable polymeric vascular scaffolds. EuroInterv Suppl. 2009;5:F15–F22. doi: 10.4244/EIJV5IFA3. [DOI] [PubMed] [Google Scholar]
- 7.Zijlstra F, van Ommeren J, Reiber JH, Serruys PW. Does the quantitative assessment of coronary artery dimensions predict the physiologic significance of a coronary stenosis? Circulation. 1987;75:1154–1161. doi: 10.1161/01.CIR.75.6.1154. [DOI] [PubMed] [Google Scholar]
- 8.Harrison DG, White CW, Hiratzka LF, Doty DB, Barnes DH, Eastham CL, Marcus ML. The value of lesion cross-sectional area determined by quantitative coronary angiography in assessing the physiologic significance of proximal left anterior descending coronary arterial stenoses. Circulation. 1984;69:1111–1119. doi: 10.1161/01.CIR.69.6.1111. [DOI] [PubMed] [Google Scholar]
- 9.Nishioka T, Amanullah AM, Luo H, Berglund H, Kim CJ, Nagai T, Hakamata N, Katsushika S, Uehata A, Takase B, Isojima K, Berman DS, Siegel RJ. Clinical validation of intravascular ultrasound imaging for assessment of coronary stenosis severity: comparison with stress myocardial perfusion imaging. J Am Coll Cardiol. 1999;33:1870–1878. doi: 10.1016/S0735-1097(99)00100-X. [DOI] [PubMed] [Google Scholar]
- 10.Judkins MP. Selective coronary arteriography. I. A percutaneous transfemoral technic. Radiology. 1967;89:815–824. doi: 10.1148/89.5.815. [DOI] [PubMed] [Google Scholar]
- 11.Gronenschild E, Janssen J, Tijdens F. CAAS. II: A second generation system for off-line and on-line quantitative coronary angiography. Cathet Cardiovasc Diagn. 1994;33:61–75. doi: 10.1002/ccd.1810330116. [DOI] [PubMed] [Google Scholar]
- 12.Bruining N, von BC, de Feyter PJ, Ligthart J, Li W, Serruys PW, Roelandt JR. ECG-gated versus nongated three-dimensional intracoronary ultrasound analysis: implications for volumetric measurements. Cathet Cardiovasc Diagn. 1998;43:254–260. doi: 10.1002/(SICI)1097-0304(199803)43:3<254::AID-CCD3>3.0.CO;2-8. [DOI] [PubMed] [Google Scholar]
- 13.von Birgelen C, de Vrey EA, Mintz GS, Nicosia A, Bruining N, Li W, Slager CJ, Roelandt JR, Serruys PW, de Feyter PJ. ECG-gated three-dimensional intravascular ultrasound: feasibility and reproducibility of the automated analysis of coronary lumen and atherosclerotic plaque dimensions in humans. Circulation. 1997;96:2944–2952. doi: 10.1161/01.cir.96.9.2944. [DOI] [PubMed] [Google Scholar]
- 14.Guagliumi G, Sirbu V. Optical coherence tomography: high resolution intravascular imaging to evaluate vascular healing after coronary stenting. Catheter Cardiovasc Interv. 2008;72:237–247. doi: 10.1002/ccd.21606. [DOI] [PubMed] [Google Scholar]
- 15.Prati F, Cera M, Ramazzotti V, Imola F, Giudice R, Giudice M, Propris SD, Albertucci M. From bench to bedside: a novel technique of acquiring OCT images. Circ J. 2008;72:839–843. doi: 10.1253/circj.72.839. [DOI] [PubMed] [Google Scholar]
- 16.Kawase Y, Hoshino K, Yoneyama R, McGregor J, Hajjar RJ, Jang IK, Hayase M. In vivo volumetric analysis of coronary stent using optical coherence tomography with a novel balloon occlusion-flushing catheter: a comparison with intravascular ultrasound. Ultrasound Med Biol. 2005;31:1343–1349. doi: 10.1016/j.ultrasmedbio.2005.05.010. [DOI] [PubMed] [Google Scholar]
- 17.Gonzalo N, Serruys PW, Garcia-Garcia HM, van Soest G, Okamura T, Ligthart J, Knaapen M, Verheye S, Bruining N, Regar E. Quantitative ex vivo and in vivo comparison of lumen dimensions measured by optical coherence tomography and intravascular ultrasound in human coronary arteries. Rev Esp Cardiol. 2009;62:615–624. doi: 10.1016/S0300-8932(09)71328-4. [DOI] [PubMed] [Google Scholar]
- 18.Gonzalo N, Garcia-Garcia HM, Serruys PW, Commissaris KH, Bezerra H, Gobbens P, Costa M, Regar E. Reproducibility of quantitative optical coherence tomography for stent analysis. EuroIntervention. 2009;5:224–232. doi: 10.4244/EIJV5I2A35. [DOI] [PubMed] [Google Scholar]
- 19.Gonzalo N, Tearney GJ, Serruys PW, van Soest G, Okamura T, Garcia-Garcia HM, van Geuns RJ, van der Ent M, Ligthart JM, Bouma BE, Regar E. Second-generation optical coherence tomography in clinical practice. High-speed data acquisition is highly reproducible in patients undergoing percutaneous coronary intervention. Rev Esp Cardiol. 2010;63:893–903. doi: 10.1016/S0300-8932(10)70201-3. [DOI] [PubMed] [Google Scholar]
- 20.Okamura T, Gonzalo N, Gutierrez-Chico JL, Serruys PW, Bruining N, de WS, Dijkstra J, Commossaris KH, van Geuns RJ, van SG, Ligthart J, Regar E. Reproducibility of coronary Fourier domain optical coherence tomography: quantitative analysis of in vivo stented coronary arteries using three different software packages. EuroIntervention. 2010;6:371–379. doi: 10.4244/EIJV6I1A62. [DOI] [PubMed] [Google Scholar]
- 21.Tsuchida K, Colombo A, Lefevre T, Oldroyd KG, Guetta V, Guagliumi G, von SW, Ruzyllo W, Hamm CW, Bressers M, Stoll HP, Wittebols K, Donohoe DJ, Serruys PW. The clinical outcome of percutaneous treatment of bifurcation lesions in multivessel coronary artery disease with the sirolimus-eluting stent: insights from the Arterial Revascularization Therapies Study part II (ARTS II) Eur Heart J. 2007;28:433–442. doi: 10.1093/eurheartj/ehl539. [DOI] [PubMed] [Google Scholar]
- 22.Tsuchida K, Garcia-Garcia HM, Ong AT, Valgimigli M, Aoki J, Rademaker TA, Morel MA, Van Es GA, Bruining N, Serruys PW. Revisiting late loss and neointimal volumetric measurements in a drug-eluting stent trial: analysis from the SPIRIT FIRST trial. Catheter Cardiovasc Interv. 2006;67:188–197. doi: 10.1002/ccd.20581. [DOI] [PubMed] [Google Scholar]
- 23.Aoki J, Abizaid AC, Serruys PW, Ong ATL, Boersma E, Sousa JE, Bruining N. Evaluation of four-year coronary artery response after sirolimus-eluting stent implantation using serial quantitative intravascular ultrasound and computer-assisted grayscale value analysis for plaque composition in event-free patients. J Am Coll Cardiol. 2005;46:1670–1676. doi: 10.1016/j.jacc.2005.06.076. [DOI] [PubMed] [Google Scholar]
- 24.Tanabe K, Serruys PW, Degertekin M, Guagliumi G, Grube E, Chan C, Munzel T, Belardi J, Ruzyllo W, Bilodeau L, Kelbaek H, Ormiston J, Dawkins K, Roy L, Strauss BH, Disco C, Koglin J, Russell ME, Colombo A. Chronic arterial responses to polymer-controlled paclitaxel-eluting stents: comparison with bare metal stents by serial intravascular ultrasound analyses: data from the randomized TAXUS-II trial. Circulation. 2004;109:196–200. doi: 10.1161/01.CIR.0000109137.51122.49. [DOI] [PubMed] [Google Scholar]
- 25.Aoki J, Colombo A, Dudek D, Banning AP, Drzewiecki J, Zmudka K, Schiele F, Russell ME, Koglin J, Serruys PW. Peristent remodeling and neointimal suppression 2 years after polymer-based, paclitaxel-eluting stent implantation: insights from serial intravascular ultrasound analysis in the TAXUS II study. Circulation. 2005;112:3876–3883. doi: 10.1161/CIRCULATIONAHA.105.558601. [DOI] [PubMed] [Google Scholar]
- 26.Nishimura RA, Edwards WD, Warnes CA, Reeder GS, Holmes J, Tajik AJ, Yock PG. Intravascular ultrasound imaging: in vitro validation and pathologic correlation. J Am Coll Cardiol. 1990;16:145–154. doi: 10.1016/0735-1097(90)90472-2. [DOI] [PubMed] [Google Scholar]
- 27.Nissen SE, Grines CL, Gurley JC, Sublett K, Haynie D, Diaz C, Booth DC, DeMaria AN. Application of a new phased-array ultrasound imaging catheter in the assessment of vascular dimensions. In vivo comparison to cineangiography. Circulation. 1990;81:660–666. doi: 10.1161/01.CIR.81.2.660. [DOI] [PubMed] [Google Scholar]
- 28.Nissen SE, Gurley JC, Grines CL, Booth DC, McClure R, Berk M, Fischer C, DeMaria AN. Intravascular ultrasound assessment of lumen size and wall morphology in normal subjects and patients with coronary artery disease. Circulation. 1991;84:1087–1099. doi: 10.1161/01.cir.84.3.1087. [DOI] [PubMed] [Google Scholar]
- 29.Strauss BH, Juilliere Y, Rensing BJ, Reiber JHC, Serruys PW. Edge detection versus densitometry for assessing coronary stenting quantitatively. Am J Cardiol. 1991;67:484–490. doi: 10.1016/0002-9149(91)90008-9. [DOI] [PubMed] [Google Scholar]
- 30.Umans VA, Strauss BH, de Feyter PJ, Serruys PW. Edge detection versus videodensitometry for quantitative angiographic assessment of directional coronary atherectomy. Am J Cardiol. 1991;68:534–539. doi: 10.1016/0002-9149(91)90793-K. [DOI] [PubMed] [Google Scholar]
- 31.Serruys PW, Reiber JH, Wijns W, van den BM, Kooijman CJ, ten Katen HJ, Hugenholtz PG. Assessment of percutaneous transluminal coronary angioplasty by quantitative coronary angiography: diameter versus densitometric area measurements. Am J Cardiol. 1984;54:482–488. doi: 10.1016/0002-9149(84)90235-2. [DOI] [PubMed] [Google Scholar]
- 32.Okamura T, Garg S, Gutierrez-Chico JL, Shin ES, Onuma Y, Garcia-Garcia HM, Rapoza RJ, Sudhir K, Regar E, Serruys PW. In vivo evaluation of stent strut distribution patterns in the bioabsorbable everolimus-eluting device: an OCT ad hoc analysis of the revision 1.0 and revision 1.1 stent design in the ABSORB clinical trial. EuroIntervention. 2010;5:932–938. doi: 10.4244/EIJV5I8A157. [DOI] [PubMed] [Google Scholar]
- 33.Ozaki Y, Violaris AG, Kobayashi T, Keane D, Camenzind E, di Mario C, de Feyter P, Roelandt JRTC, Serruys PW. Comparison of coronary luminal quantification obtained from intracoronary ultrasound and both geometric and videodensitometric quantitative angiography before and after balloon angioplasty and directional atherectomy. Circulation. 1997;96:491–499. doi: 10.1161/01.cir.96.2.491. [DOI] [PubMed] [Google Scholar]
- 34.Tanimoto S, Serruys PW, Thuesen L, Dudek D, de BB, Chevalier B, Ormiston JA. Comparison of in vivo acute stent recoil between the bioabsorbable everolimus-eluting coronary stent and the everolimus-eluting cobalt chromium coronary stent: insights from the ABSORB and SPIRIT trials. Catheter Cardiovasc Interv. 2007;70:515–523. doi: 10.1002/ccd.21136. [DOI] [PubMed] [Google Scholar]
Associated Data
This section collects any data citations, data availability statements, or supplementary materials included in this article.


