Abstract
A rapid echo planar imaging sequence for dynamic imaging of [1-13C] lactate and [1-13C] pyruvate simultaneously was developed. Frequency-based separation of these metabolites was achieved by spatial shifting in the phase-encoded direction with the appropriate choice of echo spacing. Suppression of the pyruvate-hydrate and alanine resonances is achieved through an optimized spectral-spatial RF waveform. Signal sampling efficiency as a function of pyruvate and lactate excitation angle was simulated using two site exchange models. Dynamic imaging is demonstrated in a transgenic mouse model, and phantom validations of the RF pulse frequency selectivity were performed.
Keywords: EPI, Hyperpolarized, pyruvate, spectral spatial RF, C13, kinetics
1. Introduction
Recent studies have shown the great potential of hyperpolarized 13C pyruvate for the in vivo monitoring of cellular metabolism and the characterization of disease [1–11]. Dynamic nuclear polarization (DNP) of 13C labeled pyruvate followed by rapid dissolution generates an injectable contrast agent with a four order-of-magnitude signal enhancement [12] enabling the measurement of the spatial distribution of pyruvate and its conversion to lactate, alanine, and bicarbonate. The conversion of pyruvate to lactate catalyzed by the enzyme lactate dehydrogenase is of particular interest, as the kinetics of this process have been shown to be sensitive to the presence and severity of disease in preclinical models [1–8, 13–15].
Acquiring hyperpolarized 13C images presents numerous challenges. Typically, multiple frequency components must be imaged in a time period short compared with the spin-lattice relaxation time T1 of the label. Spatially and temporally resolved dynamic imaging of substrate conversion requires even faster acquisition speeds. The low gyromagnetic ratio of carbon-13 (≈1070 Hz/G) requires imaging gradient lobes to have roughly four times the area to achieve the same field of view and resolution compared to proton. This limits the maximum achievable velocity through k space given the peak gradient amplitude and slew rate constraints on clinical imaging systems.
Several novel techniques have been developed to rapidly acquire 13C images. A small-angle band-selective excitation radio frequency (RF) pulse [16, 17] followed by a train of rapid imaging gradient pulses such as echo planar imaging (EPI) [18] or spiral readouts [19] allows for rapid imaging of single frequencies. The transmitter frequency is offset periodically for each temporal phase, and dynamic images of multiple frequency components can be acquired in an interleaved manner. Gradient echo images acquired at multiple echo times can also be used to resolve multiple frequency components via least squares inversion of the image phase [20–22]. Although the long scan time from three dimensional phase encoding typically precludes three dimensional spatially-resolved dynamic spectroscopic imaging, echo planar spectroscopic imaging (EPSI) readouts [23] and compressive sensing acquisitions [24, 25] can sufficiently increase acquisition speed to enable dynamic imaging.
In this study, we developed an echo planar imaging sequence for dynamic imaging of [1-13C] lactate and [1-13C] pyruvate. Frequency separation was achieved by spatial misregistration in the phase-encoded direction by the appropriate choice of echo spacing. Suppression of the pyruvate-hydrate and alanine resonances is achieved through an optimized spectral-spatial RF waveform. The signal dynamics were simulated using two site exchange models for the pyruvate-to-lactate conversion. These models highlight the benefit of applying differential flip angles to pyruvate and lactate, and optimal combination of these angles was studied along with the signal tradeoffs. Dynamic imaging was demonstrated in a transgenic mouse model, and phantom validations of the RF pulse and imaging gradient frequency selectivity were performed. Given that this method separates frequencies using the low effective bandwidth in the phase-encoded EPI direction, imaging of resonances with small frequency separations would be challenging. This is due to the fact that echoes must be spaced far apart to generate an adequate spatial shift. However, this technique is more readily applicable to imaging two compounds with large chemical shift dispersions since the phase-encoded dimension can be aliased multiple times while still generating a small image-domain shift. The only limitation is that the frequency-encoded field of view must large enough to encode the shifts in the frequency-encoded dimension.
2. Theory
2.1. Frequency Separation
Two noninteracting spins that are encoded by an echo-planar readout will be spatially shifted based on their difference in chemical shift. The spins have Larmor frequencies ω1 and ω2 with a chemical shift dispersion Δω = ω2 − ω1. The signal is spatially encoded after RF excitation using an flyback EPI gradient waveform with Nint interleaves and Netl equally spaced echoes (with spacing tesp). For Nint > 1, the echo train is shifted in subsequent repetitions by tesp/Nint to mitigate ghosting errors [26]. With the transmitter and receiver set at the mean of the two frequencies and phase encoding along the y dimension, the two-dimensional k space image is
| (1) |
where F1(kx, ky) and F2(kx, ky) are the images of ω1 and ω2, and
| (2) |
Here, Δky = 1/FOVy is the spacing of ky lines. TE1 is the distance from the midpoint of the RF excitation to the midpoint of the first gradient readout lobe. The phase factors exp(±iΔωTE1/2) are independent of ky and can be excluded from further analysis. The Fourier transformed image is
| (3) |
where
| (4) |
We define the quantity Φ = ys/FOVy, the fraction of the field of view the image is shifted. Since y is a phase-encoded dimension, this shift is periodic (Φ + Nalias = Φ, with Nalias an integer). Substituting into (4), this relation gives a compact form for the echo spacing in terms of the other imaging factors:
| (5) |
If the transmitter is at the true mean frequency, then the shift of each image will be equal and in opposite directions as shown by (3). If the resonance frequency if shifted, the images will be shifted asymmetrically about the center, but their relative shift with respect to each other will be the same.
With the appropriate choice of echo spacing, we can resolve two frequencies spatially in the phase-encoded direction. With Φ = 1/4 and FOVy set to at least twice the object’s extent in y, equations (4) and (5) imply that images of ω1 and ω2 are generated side by side in y. Nalias can be treated as a design parameter: for large Δω, we can let Nalias > 0 to maintain a reasonably short tesp while still generating side by side images. For pyruvate and lactate at 3T, Δω ≈ 2π × 392 Hz, so allowing for aliasing is not necessary.
Although the acquisition bandwidth of the frequency-encoded direction is much greater than that of the phase-encoded dimension, these shifts can be corrected for since the images of the two frequencies are not spatially overlapping. For larger echo spacings, the readout bandwidth is lowered to increase the sampling duty cycle and SNR [27], so characterization of the shift in the frequency direction is important. With the transmitter set at the mean of the two frequencies and the frequency encoding along x, the shift is
| (6) |
where FOVx and BWread are the field of view and the readout bandwidth in the x dimension respectively. Since a filter is applied in this dimension to eliminate aliasing, the field of view must be large enough to account for the shifts. If Lx is the spatial extent of the object in x, then
| (7) |
Provided this condition is met, the frequency-encoded shift can be accounted for by shifting the images by ±Δx from (6) similar to the technique used in [28].
This simultaneous encoding method differs from scanning individual frequencies one at a time in several important respects. Since FOVy must be twice the object’s spatial extent, the minimum number of EPI phase encodes per scan is doubled from acquiring a single frequency. The total scan time, however, is roughly constant since the minimum number of scans is halved. The number of RF excitations applied at each frequency is doubled with simultaneous acquisition suggesting an analysis of the effects of depolarization from RF saturation and cumulative signal encoded as a function of excitation angle imparted to each frequency.
2.2. Simulation of Excitation Angle Effects on Exchanging Hyperpolarized Spins
The sequence implemented uses a spectral spatial RF pulse [29] to suppress the alanine and pyruvate-hydrate signal while allowing for different excitation angles imparted to pyruvate and lactate. Qualitatively, a small flip angle on pyruvate is expected to yield a larger cumulative signal on lactate since depolarization is reduced; this effect is shown empirically in [17]. To quantify the tradeoffs in applying differential flip angles to lactate and pyruvate, a simulation was developed to study the depolarization effects from RF saturation as well as the net signal encoded as a function of flip angle. The simulation was based on a two-site exchange model for pyruvate and lactate after infusion into the animal [9, 11, 13, 14]. This model is determined by kPL which characterizes the conversion rate from pyruvate to lactate, kLP which determines the rate in the reverse direction, and ρP = 1/T1,P and ρL = 1/T1,L, the spin lattice relaxation rates for pyruvate and lactate respectively. θP and θL are the flip angles for pyruvate and lactate, and their effect on the longitudinal polarization is accounted for by a quasi-continuous approximation to the actual discrete effect. Unlike the methods presented in [30–32] where an optimal flip angle schedule is derived to maximize the integrated signal intensity of hyperpolarized spins, we only analyze the time-independent flip angle scenario. This is due to the fact that a time-dependent signal weighting could preclude quantitative analysis of kinetic data.
Let Mz,P (t) and Mz,L(t) be the longitudinal magnetization components of lactate and pyruvate respectively. The state vector Mz(t) is defined as
| (8) |
Combining with a continuous model for RF saturation and T1 decay with the chemical dynamics, the state space model can be represented as
| (9) |
with
| (10) |
where TR is the repetition time. The solution to (9) is a matrix exponential that can be calculated using inverse Laplace transforms:
| (11) |
Here, s is the complex frequency variable, I is the 2 × 2 identity matrix, and
| (12) |
The cumulative signal for pyruvate and lactate can be modeled as
| (13) |
| (14) |
The initial conditions represented by equation (12) imply that the pulse sequence begins immediately after substrate infusion, and the function describing the time dependence of the substrate delivery is ignored. This could be accounted for as in [14] but was not performed here since we are only concerned with getting an estimate of signal intensity as a function of flip angle.
3. Methods
3.1. Simulations
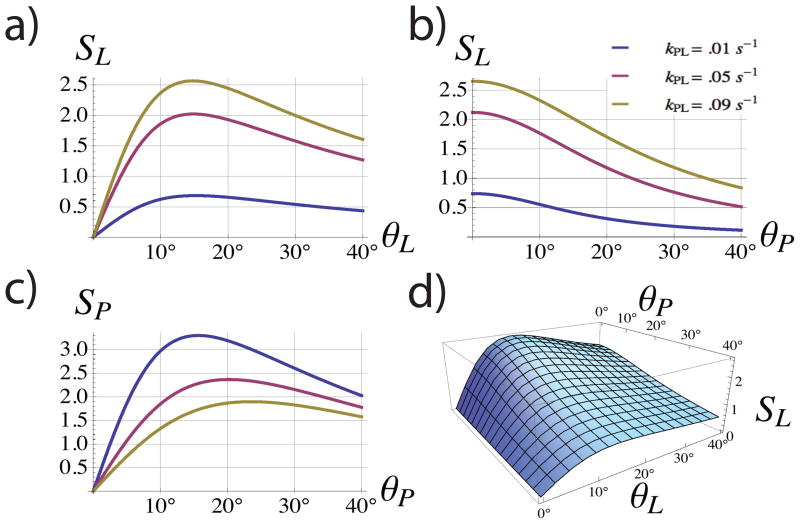
The signal of the hyperpolarized pyruvate and lactate as acquired with this sequence were simulated in Mathematica (Wolfram Research, Champaign, Il, USA). The solution (11) to equation (9) and the signal intensities (14) and (13) were computed as functions of both θP and θL at kPL = .01 s−1, .05 s−1, and .09 s−1. These values of the forward rate constant represent the range of previously measured kinetic parameters for transgenic mice [14]. Backward conversion from lactate to pyruvate was assumed to be negligible (kLP = 0). Relaxation times of T1,P = T1,L= 25 s were used for the simulations in Figure 2. These values were chosen as rough estimates and are similar to the previously quoted values of T1,L =21 s and T1,P =32 s measured from slices encompassing the tumors of TRAMP mice [14] and T1,L = T1,P =33 s measured from spatially-resolved saturation transfer data in a mouse [9].
Figure 2.
Total encoded signal of pyruvate (SP ) and lactate (SL) given by equations (13) and (14) respectively. Simulations were computed assuming T1,L = T1,P = 25s. SL and SP both show maxima as functions of θL and θP, respectively (a,c). However, the lactate signal SL decreases monotonically with increasing the pyruvate flip angle θP (b,d) suggesting the use of a small θP value as to not diminish SL. For the given repetition times and assumed relaxation rates, the optimal θL was approximately 15° and was largely independent on the conversion times (a).
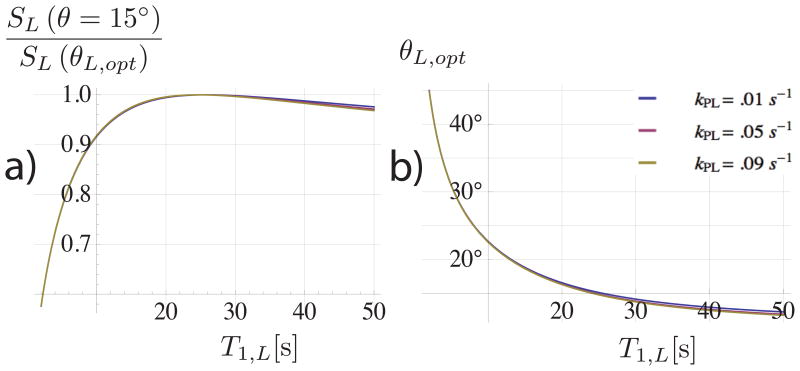
Since the T1,L and T1,P values are widely variable and cannot be measured beforehand, the non-optimality of the integrated signal as a function of flip angle and relaxation time was also simulated. The ratio of the integrated signal SL acquired using a θL = 15° flip angle to that acquired using the T1–optimal flip angle was simulated in Figure 3a. The optimal flip angle is shown in Figure 3b.
Figure 3.
a) the ratio of SL calculated for a lactate flip angle of θL = 15° to the SL value computed with the optimal angle for the given lactate relaxation time T1,L. The optimal flip angle is shown in b). Both plots assume T1,P = 25 s. The acquired SL using a 15° flip is within 10% of the optimum value for T1,L values down to 9 seconds.
The mean repetition time was used in simulations:
| (15) |
where TRact is the actual repetition time used in the scan and tdelay is the delay period between dynamic acquisitions. Nacqs was set to Nint × Nphases = 4 × 20, where Nphases is the number of dynamic acquisitions.
3.2. Radio Frequency Excitation
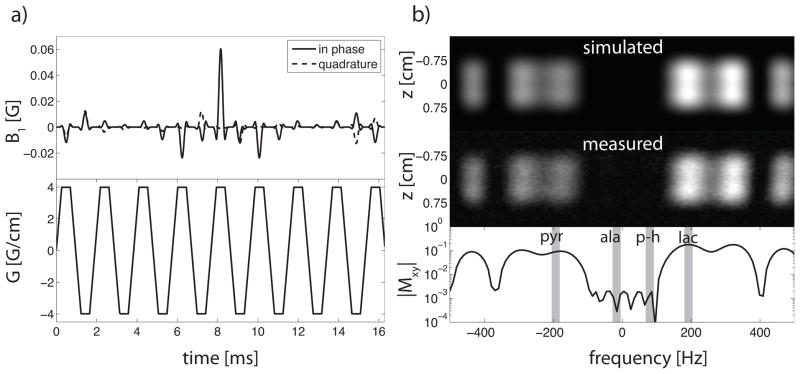
A spectral-spatial pulse giving a nominal excitation flip angle of 7.5° to pyruvate, 15° to lactate, and 0° to both alanine and pyruvate hydrate was designed for this sequence (Figure 4). This choice of flip angles was based on the simulation results of the cumulative lactate signal as a function of both θP and θL given the repetition time for the sequence (see Figure 2). The spectral filter was designed using a spectral factorization/convex optimization for reduced peak B1 and minimum sampling rate [17, 33]. Spatially-selective sublobe samples were played using a 0.5 VERSE fraction [34], and the irregular t − kz sampling was corrected for using the least-squares algorithm presented in [18]. The selectivity of the RF pulse was verified in a proton phantom using body coil for excitation (Figure 4).
Figure 4.
(a) RF waveform (top) and slice select gradient (bottom). The total waveform duration is 16.9 ms. (b) spectral/spatial excitation profile from Bloch simulation (top), measured excitation profile from a proton phantom (center), and simulated spectral profile at z = 0 shown on a semilog scale (bottom). The spectral locations of pyruvate, alanine, pyruvate-hydrate, and lactate are denoted. The minimum full width half max of the spatial profile is 1.5 cm.
3.3. Acquisition Parameters
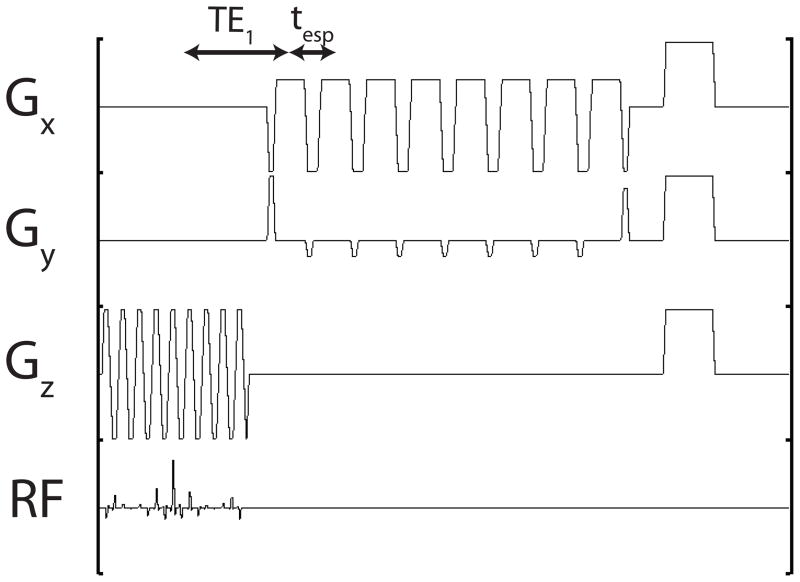
This sequence was demonstrated in a single slice in the coronal plane. The phase encoding was set along the left/right dimension, and frequency was set along superior/inferior. The phase field-of-view FOVy was set to at least twice the extent of the object. For mouse imaging, this was always possible using FOVy = FOVx = 10 cm. The transmitter resonance was set at the mean of the in vivo resonant frequencies of [1-13C] pyruvate and [1-13C] lactate, corresponding to ω/2π = 32.1315 MHz on the 3T scanner. The echo spacing was set for a ±FOVy/4 shift (Φ = 1/4) so that the sequence would generate pyruvate and lactate images side by side in y. The pyruvate/lactate frequency separation at 3T is Δω/2π = 384 Hz. A 32 × 32 grid was acquired in plane using Netl = 8, Nint = 4, so from equation (5), tesp = 5.19 ms. The readout bandwidth was then reduced to ±5 kHz increase the sampling duty cycle and SNR. With the given resolution and readout bandwidth, a shift of 0.6 times the pixel size is expected in the readout (S/I) direction. This effect was neglected, but could be compensated for with an image domain shift in S/I. The total repetition time TR = 80 ms giving a single slice scan time of NintTR = 240 ms. See Figure 1 for a diagram explaining the timing parameters.
Figure 1.
RF and gradient waveforms in a single repetition. tesp = 5.2ms, TE1 = 13.5 ms, TR = 80 ms. To increase the sampling duty cycle, the readout bandwidth was lowered to ±5 kHz corresponding to a readout gradient strength of 1 G/cm.
3.4. Animal Experiments
Experiments were performed on a GE 3T Signa MRI system (GE Health-care, Waukesha, WI, USA). A custom dual-tuned 1H/13C, transmit/receive mouse coil was used for carbon and proton imaging. Prior to infusion of the hyperpolarized contrast, the transmitter attenuation was calibrated by obtaining images at multiple attenuation settings from a syringe containing 0.7 mL of 8 M 13C-urea placed next to the animal. 24 uL of 99 % [1-13C] pyruvate was mixed with the OX063 radical (GE Healthcare, Oslo, Norway) and polarized in an Oxford Instruments Hyperpsense polarizer (Oxford Instruments Biotools, Oxford, UK) operating at 3.35 T and 1.2 K. After approximately one hour of 94.114 GHz microwave irradiation, the sample was rapidly dissolved in 4.25 mL of a heated TRIS/NaOH solution giving a final concentration of 80 mM. A transgenic prostate tumor bearing mouse [35] was injected with 350 μL of the hyperpolarized solution over 8 seconds. Imaging was started 20 seconds after the beginning of injection. A 3 second delay period is inserted between slices giving a temporal resolution of tdelay + NintTR = 3.2 seconds.
3.5. Reconstruction
The pulse sequence produces the pyruvate and lactate images side by side in the left/right dimension. The image was shifted by +FOVy/4 and multiplied by an ideal filter with width FOVy/2 to generate a pyruvate image with proper spatial localization. The same process was repeated for lactate images, but the shift was in the opposite direction.
4. Results and Discussion
Figure 2 shows plots summarizing the simulation results. The integrated lactate signal intensity from Figure 2a has a maximum at approximately θL ≈ 15° and is approximately independent of kPL for the range of values simulated. As a function of θP, SL is a monotonically decreasing function (Figures 2b, 2d) as expected since we assumed one-way conversion. Since the pyruvate signal is generally much stronger than lactate, θP was set to 7.5°. According to the model, this would sacrifice roughly 30% of SP (2.5/3.5) versus encoding with the θP optimizing SP (≈ 15° as shown in Figure 2c). However, SL is expected to increase 30% (1.8/1.4) from encoding using θP = 7.5° instead of 15° (Figure 2b). Figure 3 shows the simulated signal acquired if θL was set based on a T1,L differing from the actual value. The relative SL is within 10% of the maximum for T1,L values down to 9 seconds and is even more stable for T1,L > 25 s. Variations in T1,P had less then a 5% influence on the relative signal for the range of T1,P (5 s–50 s) simulated. Variations in kPL did not strongly influence the non-optimality of the integrated signal nor the optimal θL for different relaxation values.
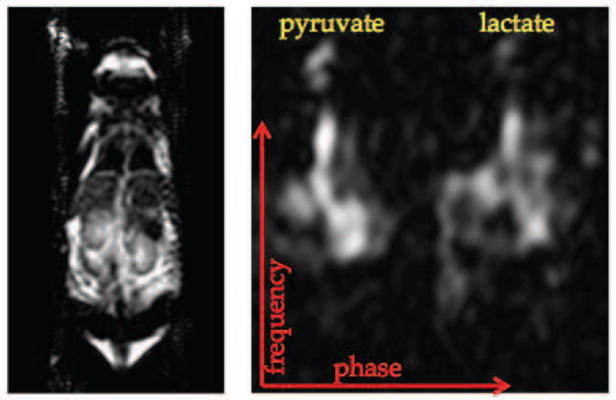
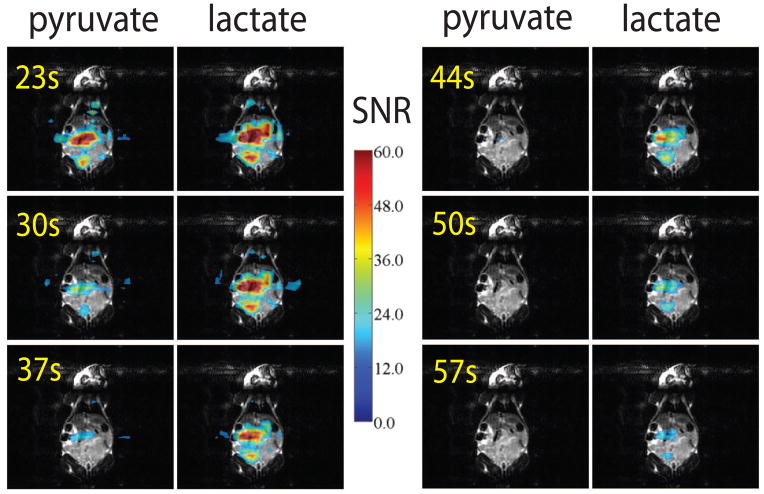
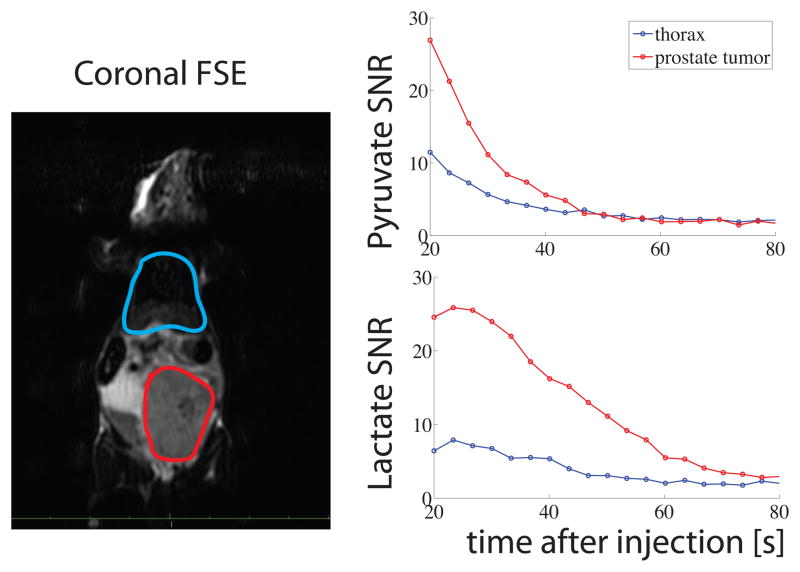
Figures 5, 6, and 7 show preliminary data acquired from infusion of hyperpolarized pyruvate into a TRAMP mouse. Figure 5 shows the coronal spin echo localizer (left) and a representative pyruvate/lactate image (right). Figure 6 shows anoverlay of the color-mapped SNR values of the hyperpolarized images. For ease of viewing, only every other dynamic repetition is displayed. Figure 7 shows the average SNR of all the pixels within two ROIs drawn around the prostate tumor and the thorax of the mouse. This figure highlights how multiband excitation with the EPI sequence generates comparable SNR for lactate and pyruvate (≈ 25 in the prostate tumor and ≈ 9 in the thorax).
Figure 5.
Coronal FSE localizer (left) and a representative image produced by the pulse sequence (right).
Figure 6.
Every other dynamic repetition overlaid on a coronal FSE localizer. Pyruvate and lactate SNR values represented as overlays. Concordant with prior studies in the TRAMP model, the tumor shows persistent lactate signal at the later time points.
Figure 7.
Coronal FSE localizer on the left shows the locations of the two ROIs. The mean SNR of all the pixels within each ROI is plotted at each repetition on the right. The comparable SNR values between pyruvate and lactate in the early time points highlight the benefit of the multiband excitation pulses.
Some limitations of the pulse sequence presented are discussed. Ghosting artifacts stemming from interleaving strongly degrades the images in this simultaneous encoding strategy since these artifacts appear along the same dimension in which the different frequencies are resolved. Although this effect was largely mitigated by the echo shifting strategy, some persistent ghosts were visible in early time points. This was likely due to the fact that in the early time points, the contrast is largely concentrated in the vasculature, and the echo shifting cannot fully correct the phase errors from flowing spins. Setting tesp to a value larger than the minimum does make the sequence more susceptible to geometric distortion from B0 homogeneity. However, the value used (5.2 ms) is on the order of the minimum achievable spacing by the clinical scanner using whole-body gradients (≈ 3 ms) for the same field-of-view and resolution. Combined with the low gyromagnetic ratio of carbon, we do not expect geometric distortions to be detrimental, and they could be compensated for using a B0 field map and the methods presented in [36]. The transverse dynamics of this sequence including effects were not investigated, and some signal loss by the long TE1 due to the spectral-spatial RF pulse is to be expected. While using spectral-spatial excitation is necessary for encoding lactate and pyruvate, this pulse sequence should show the greatest advantage for encoding only two frequencies. In this case, a short pulse with a broad excitation band could be used for excitation, and TE1 could be made extremely short, allowing for a longer echo train and signal enhancement with reduced loss.
5. Conclusion
Simultaneous encoding of pyruvate and lactate using a flyback echo planar sequence is demonstrated. This method spatially resolves the two frequencies by deliberate chemical shift misregistration based on proper selection of the echo spacing. Robust performance of the pulse sequence was observed in phantom and in vivo hyperpolarized experiments. Simulations of the combined exchange, excitation, saturation, and relaxation effects of hyperpolarized compounds were implemented. These simulations show promise in determining optimum flip angle for the metabolic product as well as elucidating the tradeoff in product signal encoded versus substrate flip angle. Possible drawbacks of the pulse sequence presented as well as some interesting extensions are discussed.
Highlights.
EPI sequence for simultaneous imaging of two hyperpolarized compounds was developed
Two site exchange models were used to optimize flip angles.
In vivo validation was performed with 13C pyruvate in a transgenic mouse.
Acknowledgments
The authors would like to thank Simon Hu, Christine Leon, Michael Ohliger, Kayvan Keshari, Subramaniam Sukumar, Douglas Kelley, Mark van Criekinge, and Bertram Koelsch for numerous helpful discussions, Hikari Yoshihara for substrate preparation, Kristen Scott for preparation of the animals used in this study, and Jim Tropp for the construction of the animal transmit/receive coil. The authors gratefully acknowledge funding from R01 EB007588, P41 EB013598, and UC Discovery Grant ITL-BIO04-10148 in conjunction with GE Healthcare. G. R. acknowledges funding from the ARCS foundation and offers particular thanks to Bruce and Betty Alberts, whose family serves as the role model for all of his scientific endeavors.
Footnotes
Publisher's Disclaimer: This is a PDF file of an unedited manuscript that has been accepted for publication. As a service to our customers we are providing this early version of the manuscript. The manuscript will undergo copyediting, typesetting, and review of the resulting proof before it is published in its final citable form. Please note that during the production process errors may be discovered which could affect the content, and all legal disclaimers that apply to the journal pertain.
References
- 1.Kurhanewicz J, Vigneron DB, Brindle K, Chekmenev EY, Comment A, Cunningham CH, Deberardinis RJ, Green GG, Leach MO, Rajan SS, Rizi RR, Ross BD, Warren WS, Malloy CR. Analysis of cancer metabolism by imaging hyperpolarized nuclei: prospects for translation to clinical research. Neoplasia. 2011;13:81–97. doi: 10.1593/neo.101102. [DOI] [PMC free article] [PubMed] [Google Scholar]
- 2.Golman K, Ardenkjaer-Larsen JH, Petersson JS, Mansson S, Leunbach I. Molecular imaging with endogenous substances. Proc Natl Acad Sci U S A. 2003;100:10435–10439. doi: 10.1073/pnas.1733836100. [DOI] [PMC free article] [PubMed] [Google Scholar]
- 3.Golman K, Zandt R, Thaning M. Real-time metabolic imaging. Proc Natl Acad Sci U S A. 2006;103:11270–11275. doi: 10.1073/pnas.0601319103. [DOI] [PMC free article] [PubMed] [Google Scholar]
- 4.Golman K, Zandt R, Lerche M, Pehrson R, Ardenkjaer-Larsen JH. Metabolic Imaging by Hyperpolarized 13C Magnetic Resonance Imaging for In vivo Tumor Diagnosis. Cancer Res. 2006;66:10855–10860. doi: 10.1158/0008-5472.CAN-06-2564. [DOI] [PubMed] [Google Scholar]
- 5.Park I, Larson PEZ, Zierhut ML, Hu S, Bok R, Ozawa T, Kurhanewicz J, Vigneron DB, Vandenberg SR, James CD, Nelson SJ. Hyperpolarized 13C magnetic resonance metabolic imaging: application to brain tumors. Neuro-Oncology. 2010;12:133–44. doi: 10.1093/neuonc/nop043. [DOI] [PMC free article] [PubMed] [Google Scholar]
- 6.Chen AP, Albers MJ, Cunningham CH, Kohler SJ, Yen Y-F, Hurd RE, Tropp J, Bok R, Pauly JM, Nelson SJ, Kurhanewicz J, Vigneron DB. Hyperpolarized C-13 spectroscopic imaging of the TRAMP mouse at 3T–initial experience. Magn Reson Med. 2007;58:1099–1106. doi: 10.1002/mrm.21256. [DOI] [PubMed] [Google Scholar]
- 7.Albers MJ, Bok R, Chen AP, Cunningham CH, Zierhut ML, Zhang VY, Kohler SJ, Tropp J, Hurd RE, Yen Y-F, Nelson SJ, Vigneron DB, Kurhanewicz J. Hyperpolarized 13C lactate, pyruvate, and alanine: noninvasive biomarkers for prostate cancer detection and grading. Cancer Res. 2008;68:8607–15. doi: 10.1158/0008-5472.CAN-08-0749. [DOI] [PMC free article] [PubMed] [Google Scholar]
- 8.Merritt ME, Harrison C, Storey C, Jeffrey FM, Sherry AD, Malloy CR. Hyperpolarized 13C allows a direct measure of flux through a single enzyme-catalyzed step by NMR. Proc Natl Acad Sci U S A. 2007;104:19773–7. doi: 10.1073/pnas.0706235104. [DOI] [PMC free article] [PubMed] [Google Scholar]
- 9.Kettunen MI, Hu D-E, Witney TH, McLaughlin R, Gallagher FA, Bohndiek SE, Day SE, Brindle KM. Magnetization transfer measurements of exchange between hyperpolarized [1-13C]pyruvate and [1-13C]lactate in a murine lymphoma. Magn Reson Med. 2010;63:872–80. doi: 10.1002/mrm.22276. [DOI] [PubMed] [Google Scholar]
- 10.Schroeder MA, Cochlin LE, Heather LC, Clarke K, Radda GK, Tyler DJ. In vivo assessment of pyruvate dehydrogenase flux in the heart using hyperpolarized carbon-13 magnetic resonance. Proc Natl Acad Sci U S A. 2008;105:12051–6. doi: 10.1073/pnas.0805953105. [DOI] [PMC free article] [PubMed] [Google Scholar]
- 11.Brindle KM, Bohndiek SE, Gallagher FA, Kettunen MI. Tumor imaging using hyperpolarized 13C magnetic resonance spectroscopy. Magn Reson Med. 2011;66:505–519. doi: 10.1002/mrm.22999. [DOI] [PubMed] [Google Scholar]
- 12.Ardenkjaer-Larsen JH, Fridlund B, Gram A, Hansson G, Hansson L, Lerche MH, Servin R, Thaning M, Golman K. Increase in signal-to-noise ratio of > 10,000 times in liquid-state NMR. Proc Natl Acad Sci U S A. 2003;100:10158–63. doi: 10.1073/pnas.1733835100. [DOI] [PMC free article] [PubMed] [Google Scholar]
- 13.Lupo JM, Chen AP, Zierhut ML, Bok RA, Cunningham CH, Kurhanewicz J, Vigneron DB, Nelson SJ. Analysis of hyperpolarized dynamic 13C lactate imaging in a transgenic mouse model of prostate cancer. Magn Reson Imaging. 2010;28:153–62. doi: 10.1016/j.mri.2009.07.007. [DOI] [PMC free article] [PubMed] [Google Scholar]
- 14.Zierhut ML, Yen Y-F, Chen AP, Bok R, Albers MJ, Zhang V, Tropp J, Park I, Vigneron DB, Kurhanewicz J, Hurd RE, Nelson SJ. Kinetic modeling of hyperpolarized 13C1-pyruvate metabolism in normal rats and TRAMP mice. J Magn Reson. 2010;202:85–92. doi: 10.1016/j.jmr.2009.10.003. [DOI] [PMC free article] [PubMed] [Google Scholar]
- 15.Witney TH, Kettunen MI, Brindle KM. Kinetic modeling of hyperpolarized 13C label exchange between pyruvate and lactate in tumor cells. J Biol Chem. 2011;286:24572–24580. doi: 10.1074/jbc.M111.237727. [DOI] [PMC free article] [PubMed] [Google Scholar]
- 16.Lau AZ, Chen AP, Hurd RE, Cunningham CH. Spectral-spatial excitation for rapid imaging of DNP compounds. NMR Biomed. 2011;24:988–996. doi: 10.1002/nbm.1743. [DOI] [PubMed] [Google Scholar]
- 17.Larson PEZ, Kerr AB, Chen AP, Lustig MS, Zierhut ML, Hu S, Cunningham CH, Pauly JM, Kurhanewicz J, Vigneron DB. Multiband excitation pulses for hyperpolarized 13C dynamic chemical-shift imaging. J Magn Reson. 2008;194:121–7. doi: 10.1016/j.jmr.2008.06.010. [DOI] [PMC free article] [PubMed] [Google Scholar]
- 18.Cunningham CH, Chen AP, Lustig M, Hargreaves BA, Lupo J, Xu D, Kurhanewicz J, Hurd RE, Pauly JM, Nelson SJ, Vigneron DB. Pulse sequence for dynamic volumetric imaging of hyperpolarized metabolic products. J Magn Reson. 2008;193:139–46. doi: 10.1016/j.jmr.2008.03.012. [DOI] [PMC free article] [PubMed] [Google Scholar]
- 19.Lau AZ, Chen AP, Ghugre NR, Ramanan V, Lam WW, Connelly KA, Wright GA, Cunningham CH. Rapid multislice imaging of hyperpolarized 13C pyruvate and bicarbonate in the heart. Magn Reson Med. 2010;64:1323–31. doi: 10.1002/mrm.22525. [DOI] [PubMed] [Google Scholar]
- 20.Reeder SB, Brittain JH, Grist TM, Yen Y-F. Least-squares chemical shift separation for 13C metabolic imaging. J Magn Reson Imaging. 2007;26:1145–1152. doi: 10.1002/jmri.21089. [DOI] [PubMed] [Google Scholar]
- 21.Levin Y, Mayer D, Yen Y-F, Hurd R, Spielman D. Optimization of fast spiral chemical shift imaging using least squares reconstruction: Application for hyperpolarized 13C metabolic imaging. Magn Reson Med. 2007;58:245–252. doi: 10.1002/mrm.21327. [DOI] [PubMed] [Google Scholar]
- 22.Leupold J, Månsson S, Petersson JS, Hennig J, Wieben O. Fast multiecho balanced SSFP metabolite mapping of 1H and hyperpolarized 13C compounds. MAGMA. 2009;22:251–6. doi: 10.1007/s10334-009-0169-z. [DOI] [PubMed] [Google Scholar]
- 23.Larson PEZ, Bok R, Kerr AB, Lustig M, Hu S, Chen AP, Nelson SJ, Pauly JM, Kurhanewicz J, Vigneron DB. Investigation of tumor hyperpolarized [1-13C]-pyruvate dynamics using time-resolved multiband RF excitation echo-planar MRSI. Magn Reson Med. 2010;63:582–91. doi: 10.1002/mrm.22264. [DOI] [PMC free article] [PubMed] [Google Scholar]
- 24.Hu S, Lustig M, Chen AP, Crane J, Kerr A, Kelley DAC, Hurd RE, Kurhanewicz J, Nelson SJ, Pauly JM, Vigneron DB. Compressed sensing for resolution enhancement of hyperpolarized 13C flyback 3D-MRSI. J Magn Reson. 2008;192:258–264. doi: 10.1016/j.jmr.2008.03.003. [DOI] [PMC free article] [PubMed] [Google Scholar]
- 25.Larson PEZ, Hu S, Lustig M, Kerr AB, Nelson SJ, Kurhanewicz J, Pauly JM, Vigneron DB. Fast dynamic 3D MR spectroscopic imaging with compressed sensing and multiband excitation pulses for hyperpolarized 13C studies. Magn Reson Med. 2011;65:610–9. doi: 10.1002/mrm.22650. [DOI] [PMC free article] [PubMed] [Google Scholar]
- 26.Feinberg DA, Oshio K. Phase errors in multi-shot echo planar imaging. Magn Reson Med. 1994;32:535–9. doi: 10.1002/mrm.1910320418. [DOI] [PubMed] [Google Scholar]
- 27.Yen Y-F, Kohler S, Chen A, Tropp J, Bok R, Wolber J, Albers M, Gram K, Zierhut M, Park I, Zhang V, Hu S, Nelson S, Vigneron D, Kurhanewicz J, Dirven H, Hurd R. Imaging considerations for in vivo 13C metabolic mapping using hyperpolarized 13C-pyruvate. Magn Reson Med. 2009;62:1–10. doi: 10.1002/mrm.21987. [DOI] [PMC free article] [PubMed] [Google Scholar]
- 28.von Morze C, Reed G, Shin P, Larson PEZ, Hu S, Bok R, Vigneron DB. Multi-band frequency encoding method for metabolic imaging with hyperpolarized [1-13C]pyruvate. J Magn Reson. 2011;211:109–13. doi: 10.1016/j.jmr.2011.04.007. [DOI] [PMC free article] [PubMed] [Google Scholar]
- 29.Meyer CJ, Pauly JM, Macovski A, Nishimura DG. Simultaneous spatial and spectral selective excitation. Magn Reson Med. 1990;15:287–304. doi: 10.1002/mrm.1910150211. [DOI] [PubMed] [Google Scholar]
- 30.Nagashima K. Optimum pulse flip angles for multi-scan acquisition of hyperpolarized NMR and MRI. J Magn Reson. 2008;190:183–188. doi: 10.1016/j.jmr.2007.10.011. [DOI] [PubMed] [Google Scholar]
- 31.Zhao L, Mulkern R, Tseng C, Williamson D, Patz S, Kraft R, Walsworth R, Jolesz F, Albert M. Gradient-echo imaging considerations for hyperpolarized 129Xe MR. J Magn Reson B. 1996;113:179–183. [PubMed] [Google Scholar]
- 32.Peterson ET, Smith MR, Grudzinski JJ, Gordon JW, Fain SB. Determination of optimal model sampling parameters for hyperpolarized contrast agents. Proceedings of the 19th Annual Meeting of ISMRM; Montreal. p. 1518. [Google Scholar]
- 33.Kerr AB, Larson PE, Lustig M, Cunningham CH, Chen AP, Vigneron DB, Pauly JM. Multiband spectral-spatial design for high-field and hyperpolarized C-13 applications. Proceedings of the 16th Annual Meeting of ISMRM; Toronto. p. 226. [Google Scholar]
- 34.Conolly SM, Nishimura DG, Macovski A, Glover GH. Variable-rate selective excitation. J Magn Reson. 1988;78:440–458. [Google Scholar]
- 35.Greenberg N, DeMayo F, Finegold M, Medina D, Tilley W, Aspinall J, Cunha G, Donjacour A, Matusik R, Rosen J. Prostate cancer in a transgenic mouse. Proc Natl Acad Sci U S A. 1995;92:3439–3443. doi: 10.1073/pnas.92.8.3439. [DOI] [PMC free article] [PubMed] [Google Scholar]
- 36.Jezzard P, Balaban RS. Correction for geometric distortion in echo planar images from B0 field variations. Magn Reson Med. 1995;34:65–73. doi: 10.1002/mrm.1910340111. [DOI] [PubMed] [Google Scholar]


