

Abstract
Recent advances in mass spectrometry approaches to the analysis of lipids include the ability to incorporate both lipid class identification with lipid structural information for increased characterization capabilities. The detailed examination of lipids and their biosynthetic and biochemical pathways made possible by novel instrumental and bioinformatics approaches is advancing research in fundamental cellular and medical studies. Recently, high-throughput structural analysis has been demonstrated through the use of rapid gas-phase separation on the basis of the ion mobility (IM) analytical technique combined with mass spectrometry (IM-MS). While IM-MS has been extensively utilized in biochemical research for peptide, protein and small molecule analysis, the role of IM-MS in lipid research is still an active area of development. In this review of lipid-based IM-MS research, we begin with an overview of three contemporary IM techniques which show great promise in being applied towards the analysis of lipids. Fundamental concepts regarding the integration of IM-MS are reviewed with emphasis on the applications of IM-MS towards simplifying and enhancing complex biological sample analysis. Finally, several recent IM-MS lipid studies are highlighted and the future prospects of IM-MS for integrated omics studies and enhanced spatial profiling through imaging IM-MS are briefly described.
Section 1 – Introduction to Contemporary MS-Based Lipidomics
In the last decade, mass spectrometry (MS) has enabled the comprehensive characterization of the myriad lipid structures and their structure specific functions [1; 2; 3], building upon prior fundamental lipid research [4; 5; 6; 7]. Lipidomics is still a relatively young discipline yet is quickly progressing through enhancements in the data acquisition [8], bioinformatics [9] and systems biology approaches [10] which have paralleled the development of the other omics initiatives.
The discovery of the enormous diversity of lipid structures [11] created an ongoing analytical challenge that requires the adoption of selective separation strategies for the deconvolution of complex lipid MS data. The chief technological advances to date include: (i) tailored condensed phase separations coupled to MS [12], (ii) tandem mass spectrometry strategies [13; 14], (iii) standardized lipid nomenclature [15], (iv) comprehensive lipid database construction [16], (v) synthesis of lipid standards [17] and, (vi) integration of bioinformatics towards automation of data analysis [18; 19]. Collectively, these initiatives are advancing lipidomics towards absolute quantitation and systems biology integration [20; 21]. These advances target the key analytical challenges in lipid analysis. Firstly, the great majority of naturally occurring lipids signals occur over relatively narrow mass ranges and can often suffer from isobaric interferences (i.e., different lipids possessing the same nominal mass). Secondly, lipids present in high concentration partially or fully suppress the detection of numerous important low abundance lipids [22; 23]. Lastly, the identification of lipid signals from complex biological samples is often hindered by the detection of endogenous and exogenous chemical noise [24].
An emerging technology which has only recently been applied in lipid analysis is ion mobility-mass spectrometry (IM-MS) [25; 26]. In this review, we introduce the basic concepts of ion mobility analysis and present the relevant capabilities and limitations of IM-MS as applied to lipid research. We focus our discussion on the current scope of IM-MS for the analysis of the major constituents of cellular membranes, phospholipids, and end with some highlights of future directions of IM-MS-based lipid research.
Section 2 – Ion Mobility and Ion Mobility-Mass Spectrometry
2.1 A General Overview of Ion Mobility
The term ion mobility when used in an analytical context, refers to the motion of free (gas-phase) ions in the presence of gas collisions. Ion mobility (IM) spectrometry shares parallels with mass spectrometry (MS) in that an ionization source, a chamber and ion detector are required for both techniques. The fundamental difference is that while in mass spectrometry the measurement proceeds in the absence of gas collisions (i.e., in vacuum), the measurement of ion mobility occurs within a pressurized chamber typically held between 1 to 760 Torr [27]. Fundamentally, the mobility of an ion through a neutral gas is governed principally by the collision frequency between the ion and the gas. Thus, under ideal experimental conditions (e.g., constant gas number density at low energy), the mobility of an ion is related to the ion's physical size, i.e., the ion collision-cross section [28]. This means that simultaneous measurements of ion mass and ion mobility provide complementary information regarding the analyte. One primary advantage of ion mobility analysis lies in its ability to differentiate analytes which are isobaric in mass but differ in structure. Ion mobility has been successfully used to resolve many different structural isomers widely ranging in size such as leucine and isoleucine [29], helical and extended peptides [30], cis-trans proline isomerization [31], branching patterns in carbohydrates [32], and the geometry of protein complexes up into the MDa range [33; 34].
2.2 Contemporary Ion Mobility Analytical Techniques
Just as there are several MS techniques which have been developed to determine an ion's mass, the field of ion mobility analysis is comprised of several different analytical techniques. Four commonly used IM techniques are described in the following section, namely: (i) drift time, (ii) traveling wave, (iii) asymmetric field, and (iv) differential IM. Conceptual schemes of the basic operational principles of each of these techniques are provided in Figure 1.
Figure 1.
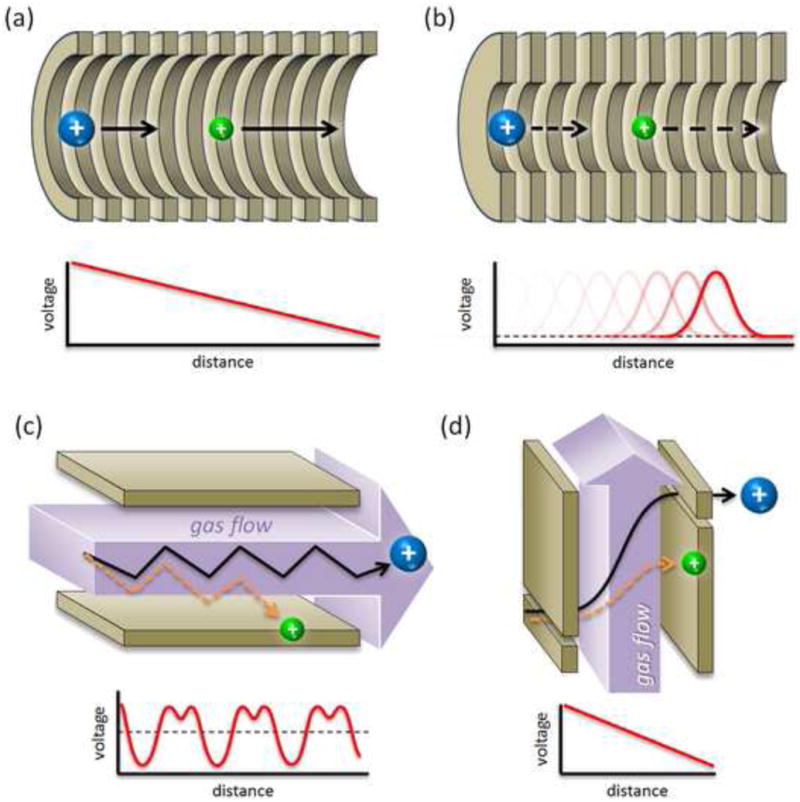
Basic operational principles of contemporary ion mobility techniques. (a) Conventional drift time ion mobility whereby ions are introduced into a gas-filled chamber and separated based upon their differential drift down a continuous declining potential. (b) Traveling wave ion mobility which mobility separates ions in a gas-filled chamber using a dynamic traveling potential hill. (c) Asymmetric field ion mobility whereby ions are separated based upon their differential migration orthogonal to a sweeping gas flow. (d) Differential ion mobility which separates ions based upon their ion mobility-dependent spatial displacement as they traverse an electric field gradient that is applied orthogonal to a constant flow of gas. In all schemes, ion motion is depicted from left to right.
The most straightforward method of measuring the ion mobility is the drift time method in which the arrival time of a distribution of ions is recorded as it traverses a pressured chamber under the influence of a weak electric field (Figure 1a). For reasons of ensuring analytical precision, the gas number density and electric field are kept static, and the drift distance of the ions is also well-defined. This drift time ion mobility (DTIM) method offers the highest precision measurements of ion mobility and thus has demonstrated very high analytical resolving power [35; 36], but ion losses due to ion-gas diffusion can be high, and so the drift time method inherently suffers from low sensitivity. Because the arrival time of all ions is recorded during each measurement cycle, the DTIM method is useful when a broadband ion mobility spectrum is desired, such as in the analysis of complex biological samples.
The DTIM method suffers from two practical disadvantages which has limited its widespread use: low sensitivity (low ion transfer efficiency) and difficulty in coupling with commercial instrumentation. The latter shortcoming results from the necessary use of a constantly declining voltage across the drift region in order to draw the ions through the gas, which means that the front and back of the drift region are at a potential differential of up to several thousand volts. An alternate IM method which has been implemented commercially is the traveling wave ion mobility (TWIM) technique [37; 38]. TWIM is very similar to the DTIM, with the notable exception that TWIM uses a migrating low voltage pulse to push ions through the gas (Figure 1b). This allows the front and back of the drift region to be at the same voltage, making it well-suited for integration into an existing commercial MS platform. The commercial implementation of TWIM also utilizes refocusing fields to counteract diffusional ion losses, which greatly improves the analytical sensitivity. TWIM is also a temporally dispersive analysis and as with DTIM can obtain a full ion mobility spectrum for each instrument measurement cycle. The primary disadvantage of TWIM is that the measurement accuracy of the ion CCS is low due to the fact that the traveling wave voltages used are difficult to characterize quantitatively [25]. Obtaining accurate CCS measurements on a TWIM device is possible by calibrating against high precision CCS values obtained from DTIM methods [34; 39].
Both drift time and traveling wave IM methods separate ions by gas-phase mobility, which is intrinsic to a particular ion for a specific gas under low electric field conditions. When the electric field is raised considerably, ion-gas collisions become non-elastic (e.g., reactive or interactive ion-gas collisions) and the ion mobility begins to change. Two ions of different chemical composition may exhibit the same ion mobility at a low electric field but completely different mobilities at sufficiently high field, allowing them to be differentiated in the measurement [40]. An IM technique which exploits this differential mobility behavior at high field is known as asymmetric-field ion mobility spectrometry (FAIMS) and is available as a commercial technology for several MS instrument platforms [41]. As its name implies, FAIMS utilizes an asymmetric voltage waveform comprised of a low-field and high-field component which induces ions to migrate between both field conditions as they are swept through the field by a flowing gas (Figure 1c). Consequently, FAIMS passes only ions which are stable in the applied waveform, creating an efficient narrow band-pass ion mobility filtering device. A broadband ion mobility spectrum can be generated by scanning the FAIMS device across a voltage range. One main advantage of FAIMS is that it can separate ions which cannot be resolved by drift time or traveling wave IM and FAIMS devices operate with very high sensitivity. Because high-field ion mobility behavior is difficult to characterize, a priori determinations of where specific ion signals will appear on a FAIMS mobility spectrum are difficult to make, and so confident identification of ion species must be made using additional techniques, such as MS and multi-stage tandem MS fragmentation.
Another narrow band-pass IM technique is the differential mobility analyzer (DMA), which is also available as a commercial technology by several vendors [42; 43]. The DMA technique is conceptually similar to FAIMS, with ions traversing between two parallel electrodes in the presence of a gas flow. Unlike FAIMS, however, in a DMA, the applied electric field across the two electrodes is constant and the net ion migration proceeds from one electrode to the other, rather than being fully entrained in the gas flow as in FAIMS. In practice, ions transit the DMA device via two offset slits, one placed in each electrode. Thus, only ions possessing a specific gas-phase mobility will be able to pass from one slit to the other (Figure 1d). As with FAIMS, the DMA is a narrow band-pass ion mobility filtering device and a broadband IM spectrum can be obtained by scanning the applied electric field directly. Alternately, a broadband IM spectrum can be obtained by a DMA by using an array detector and monitoring the ion current originating from multiple dispersion paths simultaneously [44], however, this precludes the use of further post-IM spectrometer stages, as an array detector is a destructive ion detection method. Because the electric field is well-defined, the DMA can obtain high precision measurements of ion CCS [45] and is well-suited for size-based analyses of large particles in the 10s of nanometer diameter range or larger [46]. Currently, small analytes below ca. 5 nm in diameter are difficult to transmit and analyze with the DMA due to diffusional ion losses and band-broadening. Recent technological improvements in the DMA show promise for extending the usable size range below 5 nm with high sensitivity and resolution [47].
2.3 Ion Mobility-Mass Spectrometry
The stand-alone ion mobility measurement provides valuable information regarding analyte size and shape which can be used for characterization purposes. Ion mobility size information is, however, inherently coarse-grained since the CCS measurement is collisionally-averaged over all possible orientations of the analyte ion as it traverses the IM drift region. Thus, the greatest strength of the ion mobility technique is its ability to rapidly separate analyte signal prior to mass analysis, in the IM-MS configuration. IM as a chemical separator does not exhibit as high of a peak capacity as traditional condensed-phase separation techniques such as liquid or gas chromatography, however, IM separations occur on a timescale that is ca. 4 to 6 orders-of-magnitude faster, yield a peak capacity production rate for IM-MS of 106 to 108 sec−1 [48]. Tens of thousands of IM separations can occur during a single chromatography run, and contemporary IM technologies can be seamlessly integrated into commercial MS platforms. Because IM disperses chemical signals across another dimension of information (analyte size), IM-MS benefits from enhanced peak capacity and signal-to-noise compared to a conventional single dimension of MS analysis. For example, Ruotolo et al. estimated a 1 to 5-fold increase in peak capacity for IM-MS of tryptic peptides in helium gas as compared with MS analysis alone [49]. Additionally, IM-MS can be combined with condensed phase separations, such as liquid chromatography (LC-IM-MS) to further improve separation selectivity and concentration dynamic range [50; 51]. For example, Clemmer and colleagues utilized LC-ESI-IM-MS in order to enhance the concentration dynamic range of the analysis to greater than 106, whereby much less than 105 is typical for MS analysis alone [51; 52]. In addition to IM benefiting the performance of MS analysis as a chemical signal separation strategy, information from the combined IM-MS analysis can be used for data interrogation purposes. The projection of 2-dimensional IM-MS data results in chemical-class specific regions of data which represent the differential scaling of analyte size to mass [53; 54]. By virtue of the relative structural packing efficiency of different biomolecular classes, the average slope of the mobility-mass correlation line on a 2D IM-MS spectrum increases in the approximate order: small molecules< oligonucleotides<carbohydrates< peptides< proteins<lipids. The utility of this class information can be illustrated by considering a conventional MS spectrum of a complex mixture (Figure 2a, top panel), which corresponds to an overlap of signals representing all analytes in the sample. By isolating specific regions of data, mass spectra which are chemical-class specific can be extracted for further analysis (Figure 2b). The utility of these molecular class separations have unique implications for the accuracy of lipidomics data in comparison with MS-only data as discussed in Sections 3 and 4. It should be noted here that these molecular class separation trends are complicated when multiply-charged ions are present, as is the case with ESI-based IM-MS methods. Multiply-charged ion distributions tend to overlap with one another in IM-MS conformational space and decrease overall peak capacity since one analyte is represented by several different ion signals in the spectrum. Additional post-acquisition data treatments, such as charge-state deconvolution [55], can be utilized for ESI-IM-MS data workup to help simplify the data analyses.
Figure 2.
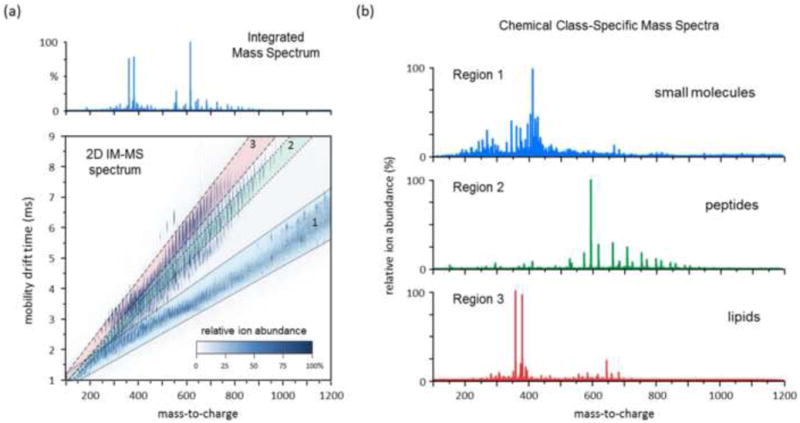
An example of the analytical utility of IM-MS for the separation of different chemical classes. (a) The combined 2-dimensional IM-MS spectrum acquired from a methanol extract of whole rat blood. The integrated mass spectrum (top panel) represents the typical spectrum which would be obtained using a conventional single-dimension of MS analysis. (b) Chemical class-specific mass spectra extracted from the 2D spectrum in (a). Three regions of the data are highlighted, which contain chemical signals predominately represented by small molecule metabolites, peptides and lipids. This data was acquired on a commercial traveling wave instrument by directly infusing the desalted blood extract sample.
Section 3 – Emerging Role of IM-MS for Fundamental Lipid Characterization and Lipidomics from Complex Biological Samples
Only a few reports of lipid studies by IM-MS have been published to date. Here, we highlight several seminal contributions for fundamental lipid studies and lipid analyses directly from complex biological samples. Largely, these lipid studies have arisen from previous DTIM-MS work involving peptides and proteins from the groups of Jarrold [56; 57; 58; 59], Bowers [60; 61], Clemmer [62], and Russell [63]. The studies reviewed in this section detail lipid separations using both DTIM-MS and commercial TWIM-MS instruments.
Section 3.1 IM-MS Separation of Phospholipid Classes
Woods and coworkers have investigated the mobility-mass (drift time and m/z) correlation profiles of signals obtained from phosphatidyl-choline (PC), -ethanolamine (PE), -serine (PS), -inositol (PI), -glycerol (PG), phosphatidic acid (PA) and sphingomyelin (SM) lipid containing standards [64]. Furthermore, they have investigated the effect of the coordination of different alkali metals on the IM profiles of these lipid classes. In all experiments, singly charged lipid ions were generated by matrix-assisted laser desorption ionization (MALDI) from either 2,5-dihydroxybenzoic acid (DHB) or 2,6-dihydroxyacetophenone (DHA), the preferred lipid MALDI matrices in common use today. Several trends emerged from this study including the observation of mobility differences based solely on phospholipid acyl chain degree of unsaturation, type of linkage, and polar headgroup. It appears that there are distinguishable and sometimes baseline resolvable mobility drift time differences between classes of phospholipids, with the IM data following a general gas-phase density trend SM<PC/PE<PS/PG<PA (Figure 3a). Increasing number of acyl chain double bonds as well as plasmalogen type of fatty acid - glycerol linkage both appear to significantly increase the gas-phase density of glycerophospholipid ions. Additionally, coordination to different alkali metal cations has been found to further enhance the observed mobility separations. In the case of SM, alkali metal adduction shifts the observed IM-MS signals into the higher mass region of the 2D mass mobility spectrum with very little change in the ion mobility, except in the case of Cs+ coordination (Figure 3b). Alkali metal doping and coordination experiments can be utilized to quickly distinguish which lipid signals originate from protonated ions and which signals occur as a result of coordination with cations within the sample itself (i.e., preformed cation complexes).
Figure 3.
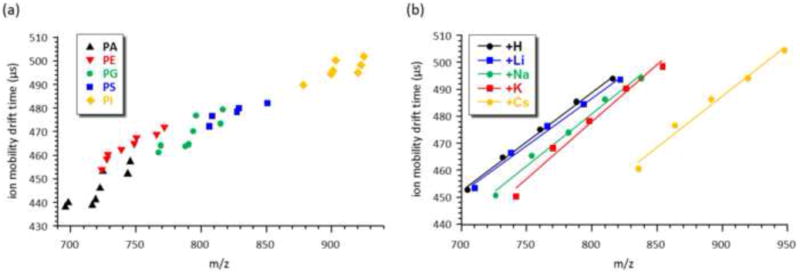
(a) IM-MS data plot of several lipid extracts obtained with MALDI-DTIM-MS. Individual lipid classes cluster in regions of IM-MS space which are ascribed to differences in head group, acyl chains, and cation. (b) Shifts in the drift time and m/z observed for saturated SM lipids coordinated to different cation groups. Panels (a) and (b) were adapted from Figures 3 and 4 in Springer and Elsevier, J. Amer. Soc. Mass Spectrom. 19(11), 2008, 1655-1662, A Study of Phospholipids by Ion Mobility TOFMS, Jackson, S. N.; Ugarov, M.; Post, J.D.; Egan, T.; Langlais, D.; Schultz, J. A.; Woods, A. S., © 2008 American Society for Mass Spectrometry, with kind permission from Springer Science+Business Media B.V.
Section 3.2 Detailed TWIM Analyses of Saturated and Unsaturated Phosphatidylcholines
The effect of the number of double bonds on the mobility of lipid ions was investigated for PC signals obtained on a TWIM-MS instrument using electrospray ionization (ESI) [65]. A single double bond was found to account for a 5% shift in the mobility time deviation from the average mobility-mass correlation line of PC lipids, while each additional double bond appears to further shift the mobility time by ca. 1%. In this investigation, Kim et al. also found that sodium vs. proton cationization and the position of saturated acyl chains (i.e., sn-1 or sn-2) in lipid isomers both appear to have no significant effect on mobility [65]. The authors also performed molecular dynamics modeling of gas-phase lipid ions to establish a more concrete structural understanding of the observed separation of saturated and unsaturated PC ions by ion mobility. The analysis of the computationally generated PC structures appears to support the intuitive hypothesis that the steric restraints imposed by acyl chain double bonds are the key factors which lead to an increased gas-phase packing density of unsaturated PC lipid ions.
Kim et al. also estimated lipid collision cross-sections based on empirically derived high-confidence helium-based lipid and peptide CCS values published from DTIM-MS measurements [53; 66], and compared DTIM-MS based CCS values to lipid CCS derived solely on TWIM-MS data, following a recently published TWIM-MS CCS derivation protocol [25]. While Kim et al. did not find significant differences between TWIM-MS PC CCS values, calibrated with either lipid or peptide DTIM-MS CCS measurements, a later study encompassing multiple lipid classes by Ridenour et al. underscored the importance of carefully choosing which DTIM-MS CCS values are used for estimating TWIM-MS CCS values [24]. Ridenour et al. found that the accuracy of the estimated TWIM-MS CCS depends significantly on whether the same chemical-class species is used for the calibration, that is, calibrating lipids with peptide values results in lower accuracy than calibrating lipids with lipid values. Therefore, when such values are available, calibration of TWIM-MS CCS values should be based on DTIM-MS CCS measurements of ions of identical biomolecular class. The derivation of accurate CCS values from TWIM measurements is still an active area of research.
Section 3.3 Multistage IM for IM-MS Lipid Structural Analysis
Clemmer and coworkers detail several unique potential uses of a multistage DTIM-MS instrument whereby the IM spectrometer is divided into three separate IM regions [67]. This novel instrument allows ion activation experiments to be conducted between each IM stage, which has specific implications for probing lipid analyte structure. In one example, ion aggregates (multimers) formed in the ESI process are isolated by one stage of IM, fragmented, then analyzed by a subsequent IM stage, identifying the presence of multimers and yielding structural information regarding the individual monomer units. This experiment has practical utility for MS research in that multiply charged multimers such as a doubly-charged dimer can exist isobaric in m/z to a singly-charged monomer, which complicates the interpretation of MS data. IM-MS has been utilized effectively for various studies of protein aggregates [33; 68; 69; 70], and here its utility is underscored for lipid aggregate analysis. In another example, the multistage IM capabilities were utilized to select and activate specific lipid ion species (Figure 4), yielding fragmentation assignment of sn-1 and sn-2 fatty acids without the need of lithium ion cationization of the parent lipid which is commonly used in lipid fragmentation studies [71]. The effect of cationization on the observed mobility data was also investigated using the H+, Na+, K+, and NH4+ cations. As with the study from Woods and coworkers [64], the findings demonstrate a lack of cationization effect on the ion mobilities of SM lipids. In general, the results confirmed the previously observed gas-phase packing density dependence of lipid IM separations on fatty acid length and degree of unsaturation and demonstrated that ion mobility separation of lipid subclasses follows the general empirical trend in gas-phase size: PE<PC<PG<SM.
Figure 4.
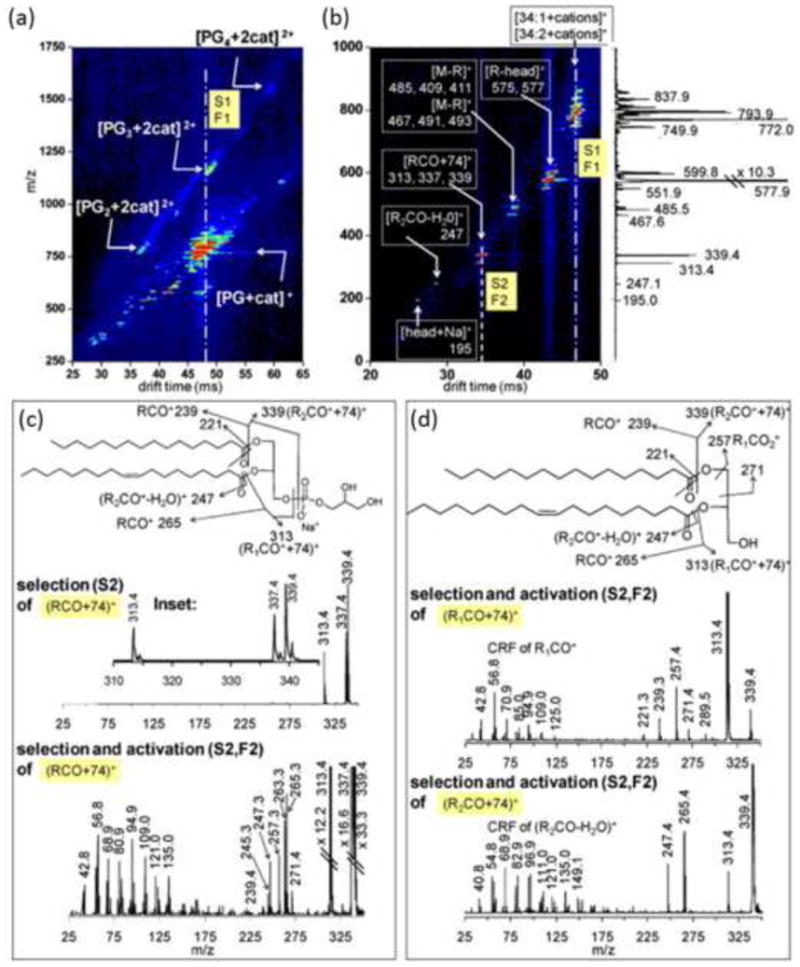
(a) DTIM-MS spectrum of multiply charged multimers of PG lipids demonstrating the ion mobility separation of isobaric lipid ion signals in the 2D IM-MS analysis. (b) DTIM-MS spectrum resulting from tandem ion mobility selection and fragmentation (IM/IM-MS) of the drift time region highlighted by the dotted line in panel (a), which pertains to predominately singly charged monomer ions. (c, top) Mass spectrum resulting from selection of the drift time window highlighted in panel (b). Panels (c, bottom) and (d) represent a second stage of ion fragmentation whereby specific fragment ions generated from the first stage of tandem IM are activated (IM/IM/IM-MS). This is analogous to a higher order tandem MS experiment (e.g., MS3) except that a complete IM-MS spectrum is generated for each stage of ion activation/fragmentation, providing additional structural information regarding fragment ions. Reprinted from Int. J. Mass Spectrom. 287(1-3), Trimpin, S.; Tan, B.; Bohrer, B.C.; O'Dell, D.K.; Merenbloom, S.I.; Pazos, M. X.; Clemmer, D. E.; Walker, J. M.; Profiling of Phospholipids and Related Lipid Structures Using Multidimensional Ion Mobility Spectrometry-Mass Spectrometry, 58-69, Copyright (2008), with permission from Elsevier B.V.
Section 3.4 IM-MS for Rapid Biomolecular Separations
As mentioned in Section 2, IM-MS affords fast (μs to ms) two dimensional separation of ions based on their gas-phase density, a property dependent on both structure and mass. In earlier IM-MS bioanalytical work it was demonstrated that combined IM-MS analyses can resolve the mobility-mass correlation domains of the major biomolecular classes based upon a gas-phase size trend of lipid>peptides>carbohydrates>oligonucleotides [54; 72; 73]. For lipids, a diversity of structures was observed, but confident structural assignments were difficult to make due to the lack of information regarding the expected mobilities of different lipid subclasses. Utilization of IM-MS for complex biomolecular separations requires a more thorough characterization of the mobility-mass correlations of the biomolecular classes. In addition, in order to derive structural information from the IM-MS measurement and provide a conceptual framework for theoretically predicting the expected IM separations, an absolute measure of the gas-phase size of various biomolecular ions is desirable. Recent work has moved to answer these questions on multiple fronts, in lipid, carbohydrate, oligonucleotide and peptide IM-MS analyses, in order to build a more complete picture of their respective mobility-mass correlations [32]. The DTIM instrument utilized in this work allows first principles determination of gas-phase ion neutral collision cross-section values. Fenn et al. presented a cross-section database of several lipid, oligonucleotide and carbohydrate standards and compared these measurements to previously published peptide CCS values [74]. An average fit (i.e., mobility-mass correlation line) of the data was generated and used to characterize the IM-MS conformational space for an ensemble of biomolecular classes. Within the same biomolecular family, such as phospholipids, the distribution around the average mobility-mass correlation fit can be thought of as a probability distribution that reflects the amount of phospholipid structure variability. This kind of examination provides a coarse-grained view of IM-MS biomolecular separations (Figure 5). On another level, empirical correlation information can be used to elucidate fine structure trends based on the knowledge of the identities of phospholipid signals, specifically, this manner of analysis can predict the positive or negative deviation of a given phospholipid class about the average lipid correlation (Figure 6).
Figure 5.
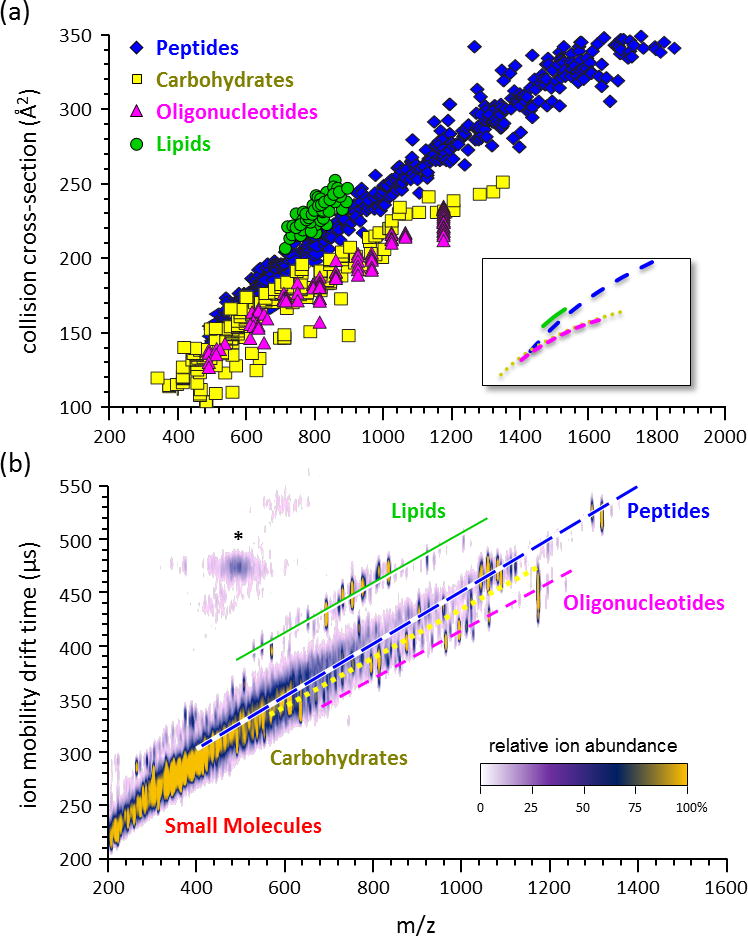
(a) A plot of collision cross-section vs. mass-to-charge measured from a large sample of various biomolecular classes, including peptides (n=610), carbohydrates (n=192), oligonucleotides (n=96), and lipids (n=53). The average mobility-mass correlation lines are contained in the inset, which represents logarithmic regression fits to the data. (b) An empirical 2D IM-MS spectrum of ion mobility drift time vs. mass-to-charge obtained on a DTIM-MS instrument for a complex sample containing a mixture of different biomolecular classes. The lines are provided for visualization purposes only. Signals in the vicinity of the asterisk (*) represent limited post-IM fragmentation of the high abundant peptide signals. Note that in the 2D plots lipid signals appear significantly removed from the other chemical signals. Panels (a) and (b) are adapted from Springer, Anal. Bioanal. Chem. 394(1) 2009, 235-244, Characterizing Ion Mobility-Mass Spectrometry Conformation Space for the Analysis of Complex Biological Samples, Fenn, L.S.; Kliman, M.; Mahsut, A.; Zhao, S.R.; McLean, J.A.; from Figure 1 © Springer-Verlag 2008 with kind permission from Springer Science+Business Media B.V.
Figure 6.
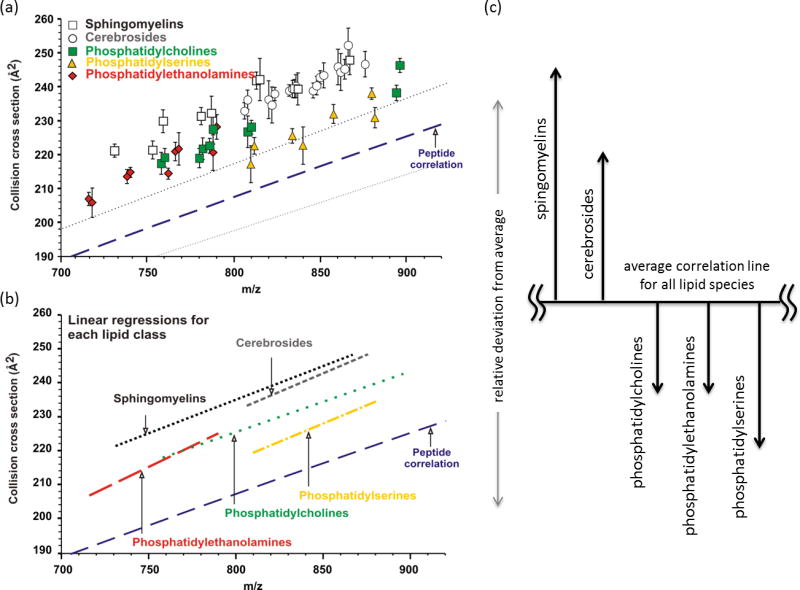
(a) A plot of average collision cross-section versus m/z for 44 intact lipid signals from five lipid extracts (Avanti, Birmingham, AL). Signals are shown in relation to the average peptide correlation line. (b) Linear regression fits through all signals corresponding to the indicated lipid class. (c) The expected deviation of various lipid molecular classes from the average lipid mobility-mass correlation line. Panel (c) was adapted from Springer and Elsevier J. Amer. Soc. Mass Spectrom. 20(10), 2009, 1775-1781, The Mass-Mobility Correlation Redux: The Conformational Landscape of Anhydrous Biomolecules, McLean, J.A.; from Figure 3 © 2009 American Society for Mass Spectrometry with kind permission from Springer Science+Business Media B.V.
Section 4 – The Future Outlook of IM-MS Research for Lipidomics
Recently IM-MS measurement strategies have demonstrated great utility in the analysis of highly complex biological samples ranging from serum [51] to intact tissue [24; 75; 76]. The advantages of IM-MS for complex sample analysis are several fold, including (i) simultaneous characterization of all biomolecular species in a sample, (ii) minimizing sample losses and sample preparation artifacts arising from extensive purification procedures, (iii) preserving the biomolecular context, such as that encountered with conjugate species (e.g., biomolecular complexes, glycoproteins, and glycolipids, etc.), and (iv) ability to observe unpredicted biomolecular interdependencies or correlations. Therefore, we envision two significant areas of research for which IM-MS will play an increasing role in the future, namely, simultaneous omics determinations directly from biological samples and high selectivity sample interrogation through imaging IM-MS.
As a post-ionization separation technique, IM-MS is amenable to spectral deconvolution of signals generated directly from complex biological samples (e.g., tissues, cells) and thus provides an opportunity for the simultaneous study of multiple biomolecular classes. As discussed in Section 3.4, the differential scaling of size to mass for structurally different molecules results in class-specific partitioning of ion signals in the 2-dimensional IM-MS analysis (refer to Figure 5). Improvements in data dimensionality can be made by coupling IM-MS with other condensed-phase separations, such as liquid or gas chromatography. For example, Clemmer and colleagues have demonstrated the utility of LC–IM–MS for studies of the human plasma proteome whereby 3-D separations provided an enhanced concentration dynamic range (ca. 105 to 106) [51; 52; 77]. Because IM-MS is a combined analytical technique, IM-MS is particularly amendable to tandem spectrometry experiments (i.e., ion fragmentation experiments between spectrometer measurements). For example, in an IM-MS instrument, ion fragmentation can be initiated at the interface (IM/MS), which results in fragmentation of ions which have already been subjected to ion mobility separation. This enables the generation of ion fragmentation data that is simultaneously correlated back to the precursor parent ions, which allows large-scale ion fragmentation experiments on several hundred analytes to be performed in parallel. Such high-throughput strategies are integral in the development of systems approaches to chemical analysis.
For many lipid studies, MALDI is the preferred technique for generating sample ions amendable to MS analysis, particularly those involving direct analysis of biological samples such as tissue and cellular material. One of the challenges of MALDI-based lipid research is the presence of exogenous chemical noise originating from the MALDI matrices and corresponding complexes. The common lipid matrices in use today, DHA and DHB, have a high propensity to form matrix clusters which appear at higher m/z regions and otherwise overlap with ion signals of interest (e.g., lipid ions and their corresponding fragment ions generated from tandem experiments). Recently, IM-MS was utilized by Kliman et al. to separate lipid signals from matrix cluster signals in a relative quantitation study of lipids from a Drosophila eas2 epilepsy model mutant. By removing the extraneous contribution of matrix cluster signals from the lipid analysis, statistically significant changes in the abundance of several lipid species were observed between mutant and wildtype brain tissue samples [76].
These and many other recent developments in MALDI for lipid analysis has not only allowed direct detection of lipids from complex biological samples, but has also enabled the spatial distribution of lipids within biological tissue to be characterized through imaging MS [78; 79]. The emerging advances in imaging MS have played a pivotal role in the development of imaging IM-MS for lipid analysis [75; 80; 81]. The analysis of complex samples is challenging due to the large numbers of analytes present which collectively represent a wide dynamic range of concentrations, abundances and chemical properties. For imaging MALDI MS experiments, this challenge is compounded by the consideration that in order to increase experimental throughput, it is desirable to obtain fewer laser shots per image pixel while maintaining the same or similar degree of information as would be obtained in a longer acquisition of data. As discussed previously, IM-MS can significantly improve the limits-of-detection for low abundant species while providing added data dimensionality which is particularly useful for analyzing complex samples where isomeric ion signals are likely present. In Figure 7, the separation of two nominal mass isomers from a complex sample matrix is demonstrated by using imaging DTIM-MS. For this experiment, the peptide, RPPGFSP, and the lipid, PC 34:2, were deposited onto a thin (12 μm) tissue section of rat liver in two overlapping rectangular areas using a reagent spotter robot (Figure 7a, left panel). The peptide and lipid represent nominal mass isomers which are indistinguishable by MS analysis alone, but are readily separated using IM (Figure 7a, right panel). Based solely on the IM information, the resulting DTIM-MS image map can be deconvoluted in order to extract images representing only the peptide or the lipid (Figure 7a, bottom panel). In another example, the spatial distribution of a specific cerebroside (24:0 OH) is determined by direct DTIM-MS imaging of a coronal rat brain tissue section (16 μm). The resulting spatial maps are generated through isolation of the sodiated cerebroside 24:0 OH ion (m/z 850.7) in the 2D DTIM-MS map from the chemical noise present in the sample. The generation of such high quality lipid localization images would be challenging using MS imaging alone, and would normally require selective derivatization strategies in order to shift the ion signal away from the endogenous chemical noise.
Figure 7.
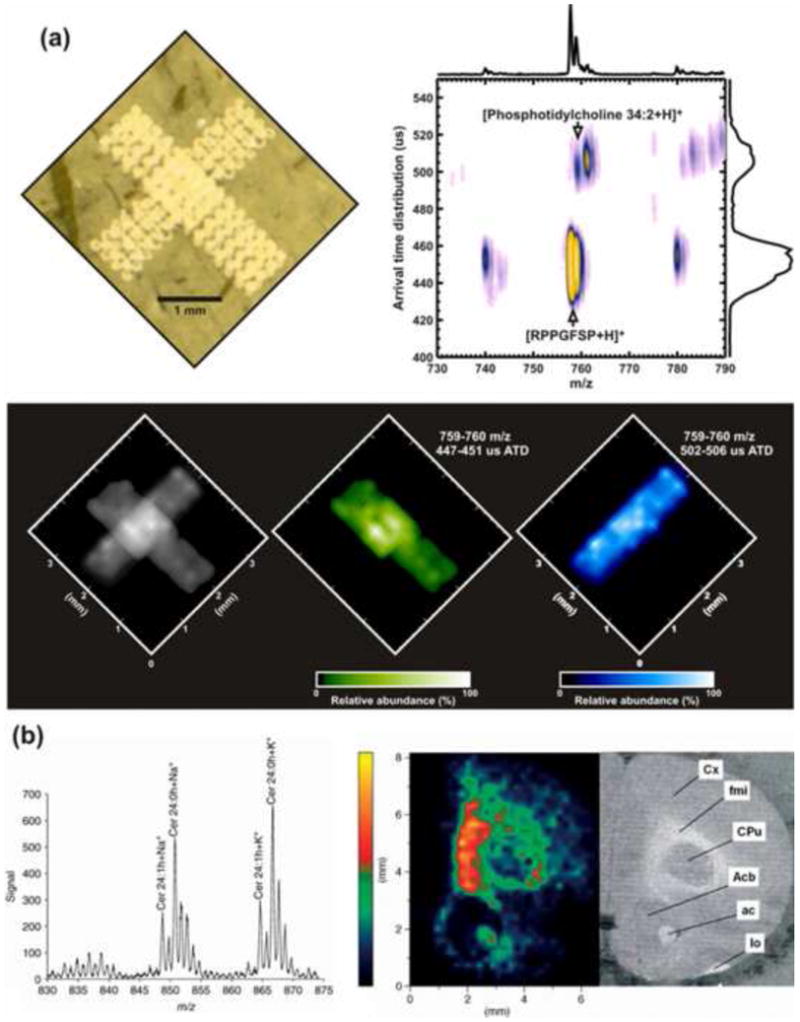
(a) Imaging DTIM-MS experiment of two nominally isobaric analytes, the peptide RPPGFSP and lipid PC 34:2. (a, left panel) An optical image of both analytes deposited onto a thin (12 mm) mouse liver tissue section in the pattern of an “X”. (a, right panel) Resulting DTIM-MS spectrum of the overlapping region of the two analytes. The IM-MS signal intensity is indicated by false coloring, where purple and yellow corresponds to the least and most intense signals, respectively. (a, bottom panel) Image maps generated using only the MS data, to left, and the combined IM-MS data, right. (b) Imaging IM-MS analysis of cerebrosides obtained from rat brain tissue. (b, left panel) Combined MS spectrum of sodium and potassium coordinated cerebroside 24:0 OH (m/z = 850.7) ion signal. (b, middle panel) Image map of the sodiated cerebroside 24:0 OH isolated from the IM-MS data. (b, right panel) Optical image of an adjacent rat brain section. Histological abbreviations are as follows: Cx - cortex; fmi -forceps minor of the corpus callosum; Cpu - caudate putamen (striatum); Acb - nucleus accumbens; ac -anterior commissure; lo - lateral olfactory tract. Panels (a) and (b) are adapted from Ref. [80] and Ref. Ref. [75], respectively, with permission. Copyright © 2007 Wiley-Liss, Inc.
The capability to measure accurate CCS values of lipids using IM-MS instruments and the correlation of such values to computationally determined structures as demonstrated by Kim et al. and summarized in section 3.2 will play a significant role in the elucidation of gas-phase lipid structural separations. Kim et al. used computational modeling, specifically molecular dynamics (MD), to determine gas-phase separation trends of PC lipids. This approach can be applied to other lipids classes for which reasonable gas-phase parameters are in place. Existing MD modeling packages such as Amber, Accelrys, and Charmm offer sufficiently wide parameter databases to encompass most bonds of glycerophospholipids and sphigolipids, which are currently the focus of IM-MS studies. The processing speed of currently available desktop Linux workstations allows charge parameterization (i.e., determination of charge distribution using ab initio calculations) for entire lipid structures and MD calculation of thousands of conformational isomers of a given lipid ion in less than 48 hours. Despite the fact that molecular dynamics packages do not possess parameters for proton charges, reasonable gas-phase parameters for many free floating cations, including alkali metal and alkali earth metal cations are a standard part of the above-mentioned MD packages. Since lipids are primarily detected from complex samples as cationized species rather than protonated structures, modeling of their gas phase behavior in the presence of a discrete charge carrier, for example sodium and potassium cations, offers the opportunity to elucidate detailed atomic level interactions in a fashion similar to the interactions studied in oligonucleotides by Fenn et al. [82].
As the performance of IM-MS improves, the applications can be extended towards higher sample complexity and lower limits-of-detection. For example, intriguing studies which combine contemporary IM-MS experiments with molecular dynamics/mechanics computational investigations are emerging to elucidate the structure and stability of lipid-incorporated complexes, such as membrane proteins [83] and large (n=54 lipids) micelles [84]. Comprehensive systems analyses on a single biological sample is now nearly feasible, but success in these approaches can only be achieved through continued developments both in the analytical technologies and in the bioinformatics necessary to extract physiologically-relevant information from the data. With the introduction of high-end commercial TWIM-MS instrumentation, ion mobility technology is now in the reach of users and its impact over the next few years, particularly in the areas of lipid research, will no doubt be high.
Research Highlights.
A mini-review of the current field of ion mobility-mass spectrometry (IM-MS) analytical approaches to the study of lipids.
IM-MS impacts lipid research by increasing data dimensionality, improving limits-of-detection and deconvoluting spectral complexity.
IM-MS has been utilized in lipid research both as an enhanced separation technique and as a structural analysis tool.
Imaging experiments using IM-MS has been applied to lipid analyses and has potential high impact for the study of very complex biological samples.
Contemporary examples of IM-MS lipid research are limited, but the future impact of IM-MS is projected to be high.
Acknowledgments
The authors would like to acknowledge C.R. Goodwin and L.S. Fenn for their constructive comments and suggestions. Financial support for this work was provided by the National Institutes of Health (1R01GM092218-01 and RC2DA028981), the U.S. Defense Threat Reduction Agency (HDTRA-09-1-0013), Vanderbilt University College of Arts and Sciences, Vanderbilt Institute of Chemical Biology, and Vanderbilt Institute for Integrative Biosystems Research and Engineering.
Footnotes
Publisher's Disclaimer: This is a PDF file of an unedited manuscript that has been accepted for publication. As a service to our customers we are providing this early version of the manuscript. The manuscript will undergo copyediting, typesetting, and review of the resulting proof before it is published in its final citable form. Please note that during the production process errors may be discovered which could affect the content, and all legal disclaimers that apply to the journal pertain.
Contributor Information
Michal Kliman, Email: michal.kliman@vanderbilt.edu.
Jody C. May, Email: jody.c.may@vanderbilt.edu.
John A. McLean, Email: john.a.mclean@vanderbilt.edu.
References
- 1.Wenk MR. The emerging field of lipidomics. Nature Reviews Drug Discovery. 2005;4:594–610. doi: 10.1038/nrd1776. [DOI] [PubMed] [Google Scholar]
- 2.Watson AD. Lipidomics: a global approach to lipid analysis in biological systems. Journal of Lipid Research. 2006;47:2101–2111. doi: 10.1194/jlr.R600022-JLR200. [DOI] [PubMed] [Google Scholar]
- 3.Brown HA, Murphy RC. Working towards an exegesis for lipids in biology. Nature Chemical Biology. 2009;5:602–606. doi: 10.1038/nchembio0909-602. [DOI] [PMC free article] [PubMed] [Google Scholar]
- 4.Cullis PR, Dekruijff B. Lipid Polymorphism and the Functional Roles of Lipids in Biological-Membranes. Biochimica Et Biophysica Acta. 1979;559:399–420. doi: 10.1016/0304-4157(79)90012-1. [DOI] [PubMed] [Google Scholar]
- 5.Farias RN, Bloj B, Morero RD, Sineriz F, Trucco RE. Regulation of Allosteric Membrane-Bound Enzymes through Changes in Membrane Lipid-Composition. Biochimica Et Biophysica Acta. 1975;415:231–251. doi: 10.1016/0304-4157(75)90003-9. [DOI] [PubMed] [Google Scholar]
- 6.Spector AA, Yorek MA. Membrane Lipid-Composition and Cellular Function. Journal of Lipid Research. 1985;26:1015–1035. [PubMed] [Google Scholar]
- 7.Dowhan W. Molecular basis for membrane phospholipid diversity: Why are there so many lipids? Annual Review of Biochemistry. 1997;66:199–232. doi: 10.1146/annurev.biochem.66.1.199. [DOI] [PubMed] [Google Scholar]
- 8.Han XL, Gross RW. Shotgun lipidomics: Electrospray ionization mass spectrometric analysis and quantitation of cellular lipidomes directly from crude extracts of biological samples. Mass Spectrometry Reviews. 2005;24:367–412. doi: 10.1002/mas.20023. [DOI] [PubMed] [Google Scholar]
- 9.Song HW, Ladenson J, Turk J. Algorithms for automatic processing of data from mass spectrometric analyses of lipids. Journal of Chromatography B-Analytical Technologies in the Biomedical and Life Sciences. 2009;877:2847–2854. doi: 10.1016/j.jchromb.2008.12.043. [DOI] [PMC free article] [PubMed] [Google Scholar]
- 10.Shevchenko A, Simons K. Lipidomics: coming to grips with lipid diversity. Nature Reviews Molecular Cell Biology. 2010;11:593–598. doi: 10.1038/nrm2934. [DOI] [PubMed] [Google Scholar]
- 11.Yetukuri L, Ekroos K, Vidal-Puig A, Oresic M. Informatics and computational strategies for the study of lipids. Molecular Biosystems. 2008;4:121–127. doi: 10.1039/b715468b. [DOI] [PubMed] [Google Scholar]
- 12.Merrill AH, Sullards MC, Allegood JC, Kelly S, Wang E. Sphingolipidomics: High-throughput, structure-specific, and quantitative analysis of sphingolipids by liquid chromatography tandem mass spectrometry. Methods. 2005;36:207–224. doi: 10.1016/j.ymeth.2005.01.009. [DOI] [PubMed] [Google Scholar]
- 13.Liebisch G, Lieser B, Rathenberg J, Drobnik W, Schmitz G. High-throughput quantification of phosphatidylcholine and sphingomyelin by electrospray ionization tandem mass spectrometry coupled with isotope correction algorithm. Biochimica Et Biophysica Acta-Molecular and Cell Biology of Lipids. 2004;1686:108–117. doi: 10.1016/j.bbalip.2004.09.003. [DOI] [PubMed] [Google Scholar]
- 14.Han XL, Gross RW. Shotgun lipidomics: multidimensional MS analysis of cellular lipidomes. Expert Review of Proteomics. 2005;2:253–264. doi: 10.1586/14789450.2.2.253. [DOI] [PubMed] [Google Scholar]
- 15.Fahy E, Subramaniam S, Murphy RC, Nishijima M, Raetz CRH, Shimizu T, Spener F, van Meer G, Wakelam MJO, Dennis EA. Update of the LIPID MAPS comprehensive classification system for lipids. Journal of Lipid Research. 2009;50:S9–S14. doi: 10.1194/jlr.R800095-JLR200. [DOI] [PMC free article] [PubMed] [Google Scholar]
- 16.Sud M, Fahy E, Cotter D, Brown A, Dennis EA, Glass CK, Merrill AH, Murphy RC, Raetz CRH, Russell DW, Subramaniam S. LMSD: LIPID MAPS structure database. Nucleic Acids Research. 2007;35:D527–D532. doi: 10.1093/nar/gkl838. [DOI] [PMC free article] [PubMed] [Google Scholar]
- 17.Fahy E, Sud M, Cotter D, Subramaniam S. LIPID MAPS online tools for lipid research. Nucleic Acids Research. 2007;35:W606–W612. doi: 10.1093/nar/gkm324. [DOI] [PMC free article] [PubMed] [Google Scholar]
- 18.Niemela PS, Castillo S, Sysi-Aho M, Oresic M. Bioinformatics and computational methods for lipidomics. Journal of Chromatography B-Analytical Technologies in the Biomedical and Life Sciences. 2009;877:2855–2862. doi: 10.1016/j.jchromb.2009.01.025. [DOI] [PubMed] [Google Scholar]
- 19.Fahy E, Cotter D, Byrnes R, Sud M, Maer A, Li J, Nadeau D, Zhau Y, Subramanian S. Bioinformatics for lipidomics. Lipidomics and Bioactive Lipids: Mass-Spectrometry-Based Lipid Analysis. 2007;432:247–273. doi: 10.1016/S0076-6879(07)32011-9. [DOI] [PubMed] [Google Scholar]
- 20.Ivanova PT, Milne SB, Byrne MO, Xiang Y, Brown HA. Glycerophospholipid identification and quantitation by electrospray ionization mass spectrometry. Lipidomics and Bioactive Lipids: Mass-Spectrometry-Based Lipid Analysis. 2007;432:21–57. doi: 10.1016/S0076-6879(07)32002-8. [DOI] [PubMed] [Google Scholar]
- 21.Ivanova PT, Milne SB, Myers DS, Brown HA. Lipidomics: a mass spectrometry based systems level analysis of cellular lipids. Current Opinion in Chemical Biology. 2009;13:526–531. doi: 10.1016/j.cbpa.2009.08.011. [DOI] [PMC free article] [PubMed] [Google Scholar]
- 22.Petkovic M, Schiller J, Muller M, Benard S, Reichl S, Arnold K, Arnhold J. Detection of individual phospholipids in lipid mixtures by matrix-assisted laser desorption/ionization time-of-flight mass spectrometry: Phosphatidylcholine prevents the detection of further species. Analytical Biochemistry. 2001;289:202–216. doi: 10.1006/abio.2000.4926. [DOI] [PubMed] [Google Scholar]
- 23.Lou XW, van Dongen JLJ, Vekemans J, Meijer EW. Matrix suppression and analyte suppression effects of quaternary ammonium salts in matrix-assisted laser desorption/ionization time-of-flight mass spectrometry: an investigation of suppression mechanism. Rapid Communications in Mass Spectrometry. 2009;23:3077–3082. doi: 10.1002/rcm.4224. [DOI] [PubMed] [Google Scholar]
- 24.Ridenour WB, Kliman M, McLean JA, Caprioli RM. Structural Characterization of Phospholipids and Peptides Directly from Tissue Sections by MALDI Traveling-Wave Ion Mobility-Mass Spectrometry. Analytical Chemistry. 2010;82:1881–1889. doi: 10.1021/ac9026115. [DOI] [PMC free article] [PubMed] [Google Scholar]
- 25.Shvartsburg AA, Smith RD. Fundamentals of Traveling Wave Ion Mobility Spectrometry. Analytical Chemistry. 2008;80:9689–9699. doi: 10.1021/ac8016295. [DOI] [PMC free article] [PubMed] [Google Scholar]
- 26.Wallace A, Millar A, Langridge J. New structural insights from high-efficiency ion mobility and tandem mass spectrometry. Nature Methods. 2007:AN12–AN13. [Google Scholar]
- 27.Eiceman GA, Karpas Z. Ion Mobility Spectrometry. CRC Press; Boca Raton, FL: 1994. [Google Scholar]
- 28.Mason EA, McDaniel EW. Transport Properties of Ions in Gases. John Wiley & Sons; New York: 1988. [Google Scholar]
- 29.Barnett DA, Ells B, Guevremont R, Purves RW. Separation of leucine and isoleucine by electrospray ionization-high field asymmetric waveform ion mobility spectrometry-mass spectrometry. Journal of the American Society for Mass Spectrometry. 1999;10:1279–1284. doi: 10.1016/S1044-0305(99)00016-1. [DOI] [PubMed] [Google Scholar]
- 30.Breaux GA, Jarrold MF. Probing Helix Formation in Unsolvated Peptides. Journal of the American Chemical Society. 2003;125:10740–10747. doi: 10.1021/ja0300362. [DOI] [PubMed] [Google Scholar]
- 31.Counterman AE, Clemmer DE. Cis-trans signatures of proline-containing tryptic peptides in the gas phase. Analytical Chemistry. 2002;74:1946–1951. doi: 10.1021/ac011083k. [DOI] [PubMed] [Google Scholar]
- 32.Fenn LS, McLean JA. Enhanced carbohydrate structural selectivity in ion mobility-mass spectrometry analyses by boronic acid derivatization. Chemical Communications. 2008:5505–5507. doi: 10.1039/b810421b. [DOI] [PubMed] [Google Scholar]
- 33.Ruotolo BT, Giles K, Campuzano I, Sandercock AM, Bateman RH, Robinson CV. Evidence for macromolecular protein rings in the absence of bulk water. Science. 2005;310:1658–1661. doi: 10.1126/science.1120177. [DOI] [PubMed] [Google Scholar]
- 34.Ruotolo BT, Benesch JLP, Sandercock AM, Hyung SJ, Robinson CV. Ion mobility-mass spectrometry analysis of large protein complexes. Nature Protocols. 2008;3:1139–1152. doi: 10.1038/nprot.2008.78. [DOI] [PubMed] [Google Scholar]
- 35.Srebalus CA, Li J, Marshall WS, Clemmer DE. Gas-Phase Separations of Electrosprayed Peptide Libraries. Analytical Chemistry. 1999;71:3918–3927. doi: 10.1021/ac9903757. [DOI] [PubMed] [Google Scholar]
- 36.Dugourd P, Hudgins RR, Clemmer DE, Jarrold MF. High-Resolution Ion Mobility Measurements. Review of Scientific Instruments. 1997;68:1122–1129. [Google Scholar]
- 37.Giles K, Pringle SD, Worthington KR, Little D, L WJ, Bateman RH. Applications of a Traveling Wave-Based Radio-Frequency-Only Stacked Ring Ion Guide Rapid Communications in Mass Spectrometry. 2004;18:2401–2414. doi: 10.1002/rcm.1641. [DOI] [PubMed] [Google Scholar]
- 38.Pringle SD, Giles K, Wildgoose JL, Williams JP, Slade SE, Thalassinos K, Bateman RH, Bowers MT, Scrivens JH. An investigation of the mobility separation of some peptide and protein ions using a new hybrid quadrupole/travelling wave IMS/oa-ToF instrument. International Journal of Mass Spectrometry. 2007;261:1–12. [Google Scholar]
- 39.Bush MF, Hall Z, Giles K, Hoyes J, Robinson CV, Ruotolo BT. Collision Cross Sections of Proteins and Their Complexes: A Calibration Framework and Database for Gas-Phase Structural Biology. Analytical Chemistry. 2010;82:9557–9565. doi: 10.1021/ac1022953. [DOI] [PubMed] [Google Scholar]
- 40.Shvartsburg AA. Differential Mobility Spectrometry: Nonlinear Ion Transport and Fundamentals of FAIMS. CRC Press; Boca Raton, FL: 2009. [Google Scholar]
- 41.Guevremont R. High-field asymmetric waveform ion mobility spectrometry (FAIMS) Canadian Journal of Analytical Sciences and Spectroscopy. 2004;49:105–113. [Google Scholar]
- 42.de la Mora JF, Ude S, Thomson BA. The potential of differential mobility analysis coupled to MS for the study of very large singly and multiply charged proteins and protein complexes in the gas phase. Biotechnology Journal. 2006;1:988–997. doi: 10.1002/biot.200600070. [DOI] [PubMed] [Google Scholar]
- 43.Chen DR, Pui DYH, Hummes D, Fissan H, Quant FR, Sem GJ. Design and evaluation of a nanometer aerosol differential mobility analyzer (Nano-DMA) Journal of Aerosol Science. 1998;29:497–509. [Google Scholar]
- 44.Zimmermann S, Abel N, Baether W, Barth S. An ion-focusing aspiration condenser as an ion mobility spectrometer. Sensors and Actuators B: Chemical. 2007;125:428–434. [Google Scholar]
- 45.Hogan CJ, Ruotolo BT, Robinson CV, Fernandez de la Mora J. Tandem Differential Mobility Analysis-Mass Spectrometry Reveals Partial Gas-Phase Collapse of the GroEL Complex. The Journal of Physical Chemistry B. 2011;115:3614–3621. doi: 10.1021/jp109172k. [DOI] [PubMed] [Google Scholar]
- 46.Tammet H. Size and mobility of nanometer particles, clusters and ions. Journal of Aerosol Science. 1995;26:459–475. [Google Scholar]
- 47.Santos JP, HontañÃ3n E, Ramiro E, Alonso M. Performance evaluation of a high-resolution parallel-plate differential mobility analyzer. Atmospheric Chemistry and Physics. 2009;9:2419–2429. [Google Scholar]
- 48.McLean JA, Ruotolo BT, Gillig KJ, Russell DH. Ion Mobility-Mass Spectrometry: a New Paradigm for Proteomics. International Journal of Mass Spectrometry. 2005;240:301–315. [Google Scholar]
- 49.Ruotolo BT, Gillig KJ, Stone EG, Russell DH. Peak capacity of ion mobility mass spectrometry: Separation of peptides in helium buffer gas. Journal of Chromatography B. 2002;782:385–392. doi: 10.1016/s1570-0232(02)00566-4. [DOI] [PubMed] [Google Scholar]
- 50.Hilderbrand AE, Myung S, Srebalus Barnes CA, Clemmer DE. Development of LC-IMS-CID-TOFMS techniques: analysis of a 256 component tetrapeptide combinatorial library. Journal of the American Society for Mass Spectrometry. 2003;14:1424–1436. doi: 10.1016/j.jasms.2003.08.002. [DOI] [PubMed] [Google Scholar]
- 51.Liu X, Plasencia M, Ragg S, Valentine SJ, Clemmer DE. Development of high throughput dispersive LC--ion mobility--TOFMS techniques for analysing the human plasma proteome. Briefings in Functional Genomics and Proteomics. 2004;3:177–186. doi: 10.1093/bfgp/3.2.177. [DOI] [PubMed] [Google Scholar]
- 52.Valentine SJ, Plasencia MD, Liu X, Krishnan M, Naylor S, Udseth HR, Smith RD, Clemmer DE. Toward Plasma Proteome Profiling with Ion Mobility-Mass Spectrometry. Journal of Proteome Research. 2006;5:2977–2984. doi: 10.1021/pr060232i. [DOI] [PubMed] [Google Scholar]
- 53.Fenn L, Kliman M, Mahsut A, Zhao S, McLean J. Characterizing ion mobility-mass spectrometry conformation space for the analysis of complex biological samples. Analytical and Bioanalytical Chemistry. 2009;394:235–244. doi: 10.1007/s00216-009-2666-3. [DOI] [PMC free article] [PubMed] [Google Scholar]
- 54.McLean JA. The Mass-Mobility Correlation Redux: The Conformational Landscape of Anhydrous Biomolecules. Journal of the American Society for Mass Spectrometry. 2009;20:1775–1781. doi: 10.1016/j.jasms.2009.06.016. [DOI] [PubMed] [Google Scholar]
- 55.Fenn J, Mann M, Meng C, Wong S, Whitehouse C. Electrospray ionization for mass spectrometry of large biomolecules. Science. 1989;246:64–71. doi: 10.1126/science.2675315. [DOI] [PubMed] [Google Scholar]
- 56.Kohtani M, Jones TC, Schneider JE, Jarrold MF. Extreme stability of an unsolvated alpha-helix. Journal of the American Chemical Society. 2004;126:7420–7421. doi: 10.1021/ja048766c. [DOI] [PubMed] [Google Scholar]
- 57.Dugourd P, Antoine R, Breaux G, Broyer M, Jarrold MF. Entropic stabilization of isolated beta-sheets. Journal of the American Chemical Society. 2005;127:4675–4679. doi: 10.1021/ja0437499. [DOI] [PubMed] [Google Scholar]
- 58.Clemmer DE, Hudgins RR, Jarrold MF. Naked Protein Conformationals - Cytochrome-C in the Gas-Phase. Journal of the American Chemical Society. 1995;117:10141–10142. [Google Scholar]
- 59.Mao Y, Ratner MA, Jarrold MF. One water molecule stiffens a protein. Journal of the American Chemical Society. 2000;122:2950–2951. [Google Scholar]
- 60.Wyttenbach T, vonHelden G, Bowers MT. Gas-phase conformation of biological molecules: Bradykinin. Journal of the American Chemical Society. 1996;118:8355–8364. [Google Scholar]
- 61.Thalassinos K, Grabenauer M, Slade SE, Hilton GR, Bowers MT, Scrivens JH. Characterization of Phosphorylated Peptides Using Traveling Wave-Based and Drift Cell Ion Mobility Mass Spectrometry. Analytical Chemistry. 2009;81:248–254. doi: 10.1021/ac801916h. [DOI] [PubMed] [Google Scholar]
- 62.Hoaglund CS, Valentine SJ, Sporleder CR, Reilly JP, Clemmer DE. Three-dimensional ion mobility TOFMS analysis of electrosprayed biomolecules. Analytical Chemistry. 1998;70:2236–2242. doi: 10.1021/ac980059c. [DOI] [PubMed] [Google Scholar]
- 63.Ruotolo BT, Gillig KJ, Woods AS, Egan TF, Ugarov MV, Schultz JA, Russell DH. Analysis of phosphorylated peptides by ion mobility-mass spectrometry. Analytical Chemistry. 2004;76:6727–6733. doi: 10.1021/ac0498009. [DOI] [PubMed] [Google Scholar]
- 64.Jackson SN, Ugarov M, Post JD, Egan T, Langlais D, Schultz JA, Woods AS. A Study of Phospholipids by Ion Mobility TOFMS. Journal of the American Society for Mass Spectrometry. 2008;19:1655–1662. doi: 10.1016/j.jasms.2008.07.005. [DOI] [PMC free article] [PubMed] [Google Scholar]
- 65.Kim HI, Kim H, Pang ES, Ryu EK, Beegle LW, Loo JA, Goddard WA, Kanik I. Structural Characterization of Unsaturated Phosphatidylcholines Using Traveling Wave Ion Mobility Spectrometry. Analytical Chemistry. 2009;81:8289–8297. doi: 10.1021/ac900672a. [DOI] [PMC free article] [PubMed] [Google Scholar]
- 66.Valentine SJ, Counterman AE, Clemmer DE. A database of 660 peptide ion cross sections: use of intrinsic size parameters for bona fide predictions of cross sections. Journal of the American Society for Mass Spectrometry. 1999;10:1188–1211. doi: 10.1016/S1044-0305(99)00079-3. [DOI] [PubMed] [Google Scholar]
- 67.Trimpin S, Tan B, Bohrer BC, O'Dell DK, Merenbloom SI, Pazos MX, Clemmer DE, Walker JM. Profiling of phospholipids and related lipid structures using multidimensional ion mobility spectrometry-mass spectrometry. International Journal of Mass Spectrometry. 2009;287:58–69. [Google Scholar]
- 68.Schenauer MR, Leary JA. An ion mobility-mass spectrometry investigation of monocyte chemoattractant protein-1. International Journal of Mass Spectrometry. 2009;287:70–76. doi: 10.1016/j.ijms.2009.02.023. [DOI] [PMC free article] [PubMed] [Google Scholar]
- 69.Erba EB, Ruotolo BT, Barsky D, Robinson CV. Ion Mobility-Mass Spectrometry Reveals the Influence of Subunit Packing and Charge on the Dissociation of Multiprotein Complexes. Analytical Chemistry. 2010;82:9702–9710. doi: 10.1021/ac101778e. [DOI] [PubMed] [Google Scholar]
- 70.Leary JA, Schenauer MR, Stefanescu R, Andaya A, Ruotolo BT, Robinson CV, Thalassinos K, Scrivens JH, Sokabe M, Hershey JWB. Methodology for Measuring Conformation of Solvent-Disrupted Protein Subunits using T-WAVE Ion Mobility MS: An Investigation into Eukaryotic Initiation Factors. Journal of the American Society for Mass Spectrometry. 2009;20:1699–1706. doi: 10.1016/j.jasms.2009.05.003. [DOI] [PubMed] [Google Scholar]
- 71.Stubiger G, Pittenauer E, Allmaier G. MALDI seamless postsource decay fragment ion analysis of sodiated and lithiated phospholipids. Analytical Chemistry. 2008;80:1664–1678. doi: 10.1021/ac7018766. [DOI] [PubMed] [Google Scholar]
- 72.Woods AS, Ugarov M, Egan T, Koomen J, Gillig KJ, Fuhrer K, Gonin M, Schultz JA. Lipid/peptide/nucleotide separation with MALDI-ion mobility-TOF MS. Analytical Chemistry. 2004;76:2187–2195. doi: 10.1021/ac035376k. [DOI] [PubMed] [Google Scholar]
- 73.Fenn LS, McLean JA. Biomolecular structural separations by ion-mobility-mass spectrometry. Analytical and Bioanalytical Chemistry. 2008;391:905–909. doi: 10.1007/s00216-008-1951-x. [DOI] [PubMed] [Google Scholar]
- 74.Tao L, McLean JR, McLean JA, Russell DH. A collision cross-section database of singly-charged peptide ions (vol 18, pg 1232, 2007) Journal of the American Society for Mass Spectrometry. 2007;18:1727–1728. doi: 10.1016/j.jasms.2007.04.003. [DOI] [PubMed] [Google Scholar]
- 75.Jackson SN, Ugarov M, Egan T, Post JD, Langlais D, Albert Schultz J, Woods AS. MALDI-ion mobility-TOFMS imaging of lipids in rat brain tissue. Journal of Mass Spectrometry. 2007;42:1093–1098. doi: 10.1002/jms.1245. [DOI] [PMC free article] [PubMed] [Google Scholar]
- 76.Kliman M, Vijayakrishnan N, Wang L, Tapp JT, Broadie K, McLean JA. Structural mass spectrometry analysis of lipid changes in a Drosophila epilepsy model brain. Molecular Biosystems. 2010;6:958–966. doi: 10.1039/b927494d. [DOI] [PMC free article] [PubMed] [Google Scholar]
- 77.Liu X, Valentine SJ, Plasencia MD, Trimpin S, Naylor S, Clemmer DE. Mapping the Human Plasma Proteome by SCX-LC-IMS-MS. Journal of the American Society for Mass Spectrometry. 2007;18:1249–1264. doi: 10.1016/j.jasms.2007.04.012. [DOI] [PMC free article] [PubMed] [Google Scholar]
- 78.Puolitaival SM, Burnum KE, Cornett DS, Caprioli RM. Solvent-free matrix dry-coating for MALDI Imaging of phospholipids. Journal of the American Society for Mass Spectrometry. 2008;19:882–886. doi: 10.1016/j.jasms.2008.02.013. [DOI] [PMC free article] [PubMed] [Google Scholar]
- 79.Burnum KE, Cornett DS, Puolitaival SM, Milne SB, Myers DS, Tranguch S, Brown HA, Dey SK, Caprioli RM. Spatial and temporal alterations of phospholipids determined by mass spectrometry during mouse embryo implantation. Journal of Lipid Research. 2009;50:2290–2298. doi: 10.1194/jlr.M900100-JLR200. [DOI] [PMC free article] [PubMed] [Google Scholar]
- 80.McLean JA, Ridenour WB, Caprioli RM. Profiling and imaging of tissues by imaging ion mobility-mass spectrometry. Journal of Mass Spectrometry. 2007;42:1099–1105. doi: 10.1002/jms.1254. [DOI] [PubMed] [Google Scholar]
- 81.Woods AS, Jackson SN. The application and potential of ion mobility mass spectrometry in imaging MS with a focus on lipids. Methods Mol Biol. 2010;656:99–111. doi: 10.1007/978-1-60761-746-4_5. [DOI] [PMC free article] [PubMed] [Google Scholar]
- 82.Fenn LS, McLean JA. Biomolecular structural separations by ion mobility-mass spectrometry. Analytical and Bioanalytical Chemistry. 2008;391:905–909. doi: 10.1007/s00216-008-1951-x. [DOI] [PubMed] [Google Scholar]
- 83.Wang SC, Politis A, Di Bartolo N, Bavro VN, Tucker SJ, Booth PJ, Barrera NP, Robinson CV. Ion Mobility Mass Spectrometry of Two Tetrameric Membrane Protein Complexes Reveals Compact Structures and Differences in Stability and Packing. Journal of the American Chemical Society. 2010;132:15468–15470. doi: 10.1021/ja104312e. [DOI] [PubMed] [Google Scholar]
- 84.van der Spoel D, Marklund EG, Larsson DSD, Caleman C. Proteins, Lipids, and Water in the Gas Phase. Macromolecular Bioscience. 2011;11:50–59. doi: 10.1002/mabi.201000291. [DOI] [PubMed] [Google Scholar]