

Abstract
The Mekong River Basin, site of the biggest inland fishery in the world, is undergoing massive hydropower development. Planned dams will block critical fish migration routes between the river's downstream floodplains and upstream tributaries. Here we estimate fish biomass and biodiversity losses in numerous damming scenarios using a simple ecological model of fish migration. Our framework allows detailing trade-offs between dam locations, power production, and impacts on fish resources. We find that the completion of 78 dams on tributaries, which have not previously been subject to strategic analysis, would have catastrophic impacts on fish productivity and biodiversity. Our results argue for reassessment of several dams planned, and call for a new regional agreement on tributary development of the Mekong River Basin.
Keywords: sustainable development, hydropower planning, fish species richness
From its origins in the Tibetan Himalayas in China, the Mekong River flows along a 4,600-km course toward the South China Sea, passing through Myanmar, Lao People's Democratic Republic (Lao PDR), Thailand, Cambodia, and Vietnam. The Mekong River Basin (MRB) 800,000 km2 watershed is home to about 65 million people (1, 2), with about two-thirds of them living in rural areas and relying on subsistence fisheries for their diet (1, 3). Over 1 million tons of freshwater fish are caught annually in the Cambodian and Vietnamese floodplains alone (3–5), making the sustainability of floodplains fisheries a major food security concern in both nations. Apart from its important role as a food source, the MRB is also a biodiversity hotspot for many species, in particular fish (6), and is characterized by large-scale fish migrations (7, 8). Both fish production and species richness are now threatened by imminent construction of hydropower plants on tributaries as well as on the Mekong River itself (3, 9–13). Although main-stem dams have been the subject of a thorough strategic assessment (14), transboundary cumulative impact assessment for tributary dams is still lacking (2, 10). Here we develop a framework capable of filling this gap, and demonstrate the trade-offs between hydropower, food security (namely fish production), and biodiversity (endangered fish species).
The Mekong River is the second most biodiverse river in the world (after the Amazon River). We identified 877 fish species in the MRB (not including estuary marine species). Regional species richness (Table S1) ranges from 484 species in the Mekong Delta to only 24 species in the Chinese headwaters far north. As many as 103 of these species migrate upstream of Kratie in Cambodia, and would be potentially impacted by hydropower development. Our modeling approach, described in Methods, computes the dry-season population and the contribution of each locality to the wet-season productivity in the floodplains. Within our theoretical framework, each upstream habitat has a local carrying capacity of migratory fish (LCCMF) (Fig. 1A) that is determined by the local carrying capacity (LCC) in the dry-season and the fraction of that LCC occupied by migratory (vs. nonmigratory) species. Migratory species fraction at each site is a function of distance-dependent migration cost, habitat suitability for different fish guilds, and interguild competition. Summing over accessible LCCMF, we get the basin-wide dry-season carrying capacity (BCC, Fig. 1B) of each species, which we assume to be proportional to fish population in either season.
Fig. 1.

Assessing impacts of hydropower development on migratory fish species. (A) The Mekong River (blue) flows from China, through Myanmar, Lao PDR, Thailand, Cambodia, and Vietnam (bottom left map). The relative dry-season migratory fish habitat capacity (stationary solution of Eq. 1) highlights the importance of the Se Kong, Sre Pok, and Se San subbasins for maintaining the migratory fish population (Inset shows expanded view and the location of five key planned dams). Kratie (star) in Cambodia is the border between the wet-season floodplains and the upstream habitats. (B) The BCC of each migratory fish species for different basin development scenarios described in the text. (C) Predicted population decline of each species based on lost habitat in each scenario, relative to an estimated historical population size in a pristine river.
Results
The MRC has formally adopted six dam-development scenarios for 2015 and 2030, known as Basin Development Plan 2 scenarios (BDP2) (15). These scenarios include between 16 and 78 tributary dams and up to 11 main-stem dams (Fig. 1 and Table 1). Using our model, we estimate the impact of each scenario on the biomass of migratory species in the floodplains, as well as the number of species at risk for extinction because of habitat loss. We find that construction of all 78 tributary dams, excluding main-stem dams, would produce less energy and pose greater environmental risk than the construction of just the upper six main-stem dams on the lower Mekong River (Table 1). Furthermore, although the 1995 Mekong Agreement requires international consultations before constructing main-stem dams, tributary dams are within national jurisdiction, and necessitate only a “notification” to the MRC Joint Committee; this is despite their potentially significant transboundary impacts, as we demonstrate in this work. For brevity, we choose to concentrate on a limited set of trade-offs, and exclude main-stem dams from our analysis.
Table 1.
Impact assessment of different dam scenarios on fish biomass and fish species richness
| BDP2 scenario | Year | No. of tributary dams in LMB | No. of main-stem dams in LMB† | Δ(Hydropower generation) (TWh/y) | Δ(Migratory fish biomass) (%)‡ | Biodiversity risks: Number of species… |
||
| Vulnerable | Endangered | Critically Endangered | ||||||
| Baseline | 2000 | 16* | 0 | −82.1 | +4.9 | 38 | 9 | 1 |
| Definite Future | 2015 | 41 | 0 | — | — | 78 | 11 | 1 |
| No main-stem dams | 2030 | 78§ | 0 | 24 | −19.1 | 9 | 85 | 6 |
| Six main-stem dams on upper LMB‖ | 2030 | 78 | 6 | 56.5 | −23.6 | 2 | 90 | 8 |
| No Cambodian main-stem dams | 2030 | 78 | 9 | 70.1 | −44.8 | 0 | 0 | 100 |
| All 11 main-stem dams | 2030 | 78 | 11 | 89.8 | −51.3 | 0 | 1 | 100 |
| Definite Future + six main-stem dams on upper LMB‖ | 2030 | 41 | 6 | 35.8 | −6.9 | 64 | 30 | 2 |
Most of the biodiversity and fish production losses are because of tributary dams, in the absence of main-stem dams. Changes in hydropower production and biomass are shown relative to BDP2 Definite Future scenario (97.4 TWh/y and 52.0%, respectively). LMB, Lower Mekong Basin.
*We include several decommissioned dams that are no longer included in the latest BDP2 but still pose a migration barrier for fish. These dams include Nam Ko, Nam Ngay, Huai Kum, Xelabam, and Lam Ta Khong.
†All scenarios include seven main-stem dams in the Chinese Upper Mekong Basin, except for the “Baseline” scenario, which includes only the Manwan dam completed in 1996. We added the regulatory dam Ganlanba to the BDP2 count because it poses a migration barrier.
‡A pristine river with no dams would support by definition 100% migratory fish biomass. One-percent biomass corresponds to annual catch of ∼6,400 tons of fish per year.
§Our analysis considers 27 dams. We excluded dams planned upstream of BDP2 Definite Future dams (Duc Xuyen, Upper Kontum, Xeset 3, Nam Ngum 3, Xekaman 4A, and Xekaman 4B) because our model predicts these will not impact floodplains production. Four dams on tributaries draining to the Tonle Sap below Kratie (Battambang 1, Battambang 2, Pursat 1 and Pursat 2) were also excluded.
‖The six main-stem dams are the Pakbeng, Luang Prabang, Xayaburi, Paklay, Sanakham, and Pakchom dams.
We focus hereafter only on dams for which the fate is still undetermined, namely the 27 dams that have construction planned between 2015 and 2030 (Table 1). To evaluate how much each of these tributary dams may contribute to the loss of fish production, we compute the difference in average migratory fish biomass for all scenarios with and without each dam. Individually, the dams with the largest impact on fish biomass are Lower Se San 2 (LSS2, 9.3% drop in fish biomass basin-wide), Se Kong 3d (2.3%), Se Kong 3u (0.9%), and Se Kong 4 (0.75%). See Table S2 for the complete list, including a similar ranking based on biodiversity loss. This analysis, however, does not provide a complete picture of the combined impact of multiple dams. Therefore, we analyze all possible permutations of these 27 dams in Fig. 2. Fig. 2A shows the impact of all 227 scenarios on migratory fish biomass, plotted against their respective hydropower production. The scenario space is divided into eight subspaces by LSS2 and the four dams on Se Kong River. For the remaining 22 dams, all subspaces contain some of the 227 scenarios (Fig. S1). This figure clearly demonstrates that at a regional scale a target hydropower production level can be achieved in many ways, with markedly different environmental consequences.
Fig. 2.

Trade-off analysis between hydropower generation, fish production, and biodiversity risks. (A) Change in migratory fish biomass versus change in total hydropower production in the MRB, both relative to BDP2 Definite Future scenario. Each point represents a different dam construction scenario. All 227 scenarios fall within eight areas (I–VIII), determined by the LSS2 and the cascade of Se Kong 3d (SK3d), Se Kong 3u (SK3u), Se Kong 4 (SK4), and Se Kong 5 (SK5) (Inset table in C). The PESN (black) show a highly nonlinear trend, which roughly divide into three regimes (green, yellow, and red; see main text). (B) Trade-off analysis between hydropower production and number of endangered species. PESN including LSS2 are marked black, and PESN with LSS2 excluded are marked green. (C) Correlation between change in migratory fish biomass and number of endangered species. (D) Sensitivity analysis. The slopes of the PESN three regimes are robust to uncertainty in model parameters. In particular, neither assuming uniform rank-abundance (uniform rank abundance), nor equal relative fraction of migratory species within each habitat (uniform migratory species fraction, using just total discharge as proxy of habitat), changes significantly the slopes of A. Ignoring spatial heterogeneity in runoff (uniform migratory species fraction and runoff, using only accessible area to measure fish habitat) still shows that impact of the LSS2 dam is much greater than other dams planned for 2030.
Given any target energy-production level, we highlight the scenarios with the least environmental impact in Fig. 2A. These “Pareto-efficient” scenarios (PESN) show a clear nonlinear trade-off between hydropower and fish biomass. Furthermore, we observe three distinct regimes in the PESN (Fig. 2A, colored backgrounds). We find that fish biomass first decreases by about 0.3% (∼1,700 tons/y) for each additional teraWatt hour per year (TWh/y) up to ∼14 TWh/y (70% of total span, value relative to BDP2 “Definite Future” scenario). Beyond that, the construction of dams on the Se Kong River causes 1.3% productivity loss (∼8,200 tons/y) per TWh/y up to 88% hydropower production, and the LSS2 dam amounts to 4% of fish loss (∼25,300 tons/y) per TWh/y produced. The number of endangered species exhibits a similar trade-off with hydropower production (Fig. 2B). The PESN in this case are those with the least biodiversity risks at each level of energy production. We see moderate (with LSS2) or negligible (without LSS2) increase in the number of endangered species up to 12–14 TWh/y, followed by a steep increase in biodiversity loss for each extra TWh/y. We also observe a significant negative correlation (Pearson R = 0.9875, P < 0.001 based on bootstrapping, n = 134,217,728) between migratory fish biomass, calculated based on the 48 dominant species, and the number of endangered species, calculated based on predicted population declines for all species. In fact, Fig. 2C shows that for scenarios with less than 5% biomass loss, biodiversity is relatively unaffected, whereas above this threshold about six species will become endangered for every 1% of lost biomass. This finding is extremely important because it relates fish abundance, a provisioning ecosystem service with significant value in the eyes of local stakeholders, to biodiversity, a supporting ecosystem service whose value is still vague or underestimated (3, 16, 17). Our findings that the trade-off illustrated in Fig. 2A is highly nonlinear and exhibits three distinct regimes are robust to many of the model parameters (Fig. 2D). These are the main results of this article, and have far-reaching consequences for policy and decision-making, discussed below.
Discussion
Although our work demonstrates the significant transboundary impact of tributary dam development, the focus of scientific research, media, and international efforts has been on avoiding main-stem dam construction, in particular of the controversial Xayaburi dam. Our analysis shows that construction of all planned tributary dams, nearly all within Lao PDR national borders, would have graver impacts on fish biodiversity basin-wide and on the Cambodian and Vietnamese floodplain's fish productivity, than the combined impact of the six upper main-stem dams on the lower Mekong River, including Xayaburi.
Which tributary dams should be built and which should be avoided? This decision could be made by assigning monetary value to hydropower and fish biomass. However, the monetary valuation of subsistence fisheries is still a subject of debate and is beyond the scope of this work. Nevertheless, the highly nonlinear shape of the PESN, and especially the separation into three distinct regimes, can significantly help decision-making for this question. Specifically, it is clear that under a large range of substitutability between energy production and fish productivity, scenarios within the first regime are preferable to those in the second regime (with Se Kong cascade), and those scenarios in the third regime (with LSS2) should probably be avoided. Hence, the construction of the LSS2 dam is highly detrimental according to this analysis, and the benefits of the Se Kong cascade are questionable. These conclusions are based only on two aspects of a much more complex socioecological and economic debate, and a more definite answer necessitates the integration of other aspects, such as social costs of damming, and costs of nutrient and sediment loss. Still, we can use the analysis of the PESN to design a simple decision-supporting tool (Fig. 3). For each energy level we color-code the percentage of scenarios within that range that include a particular tributary dam. Dams are sorted by the energy-level “threshold” above which >50% of scenarios include that project. As expected, LSS2 is last, which implies all PESN scenarios exclude LSS2 until the demand is over ∼20 TWh/y. We find that the proposed Se Kong and Nam Ou cascades are ordered according to their catchment area, with the most upstream dams included first and downstream dams appearing in PESN at a higher energy level. The Se Kong 3d dam is not included in the majority of any target energy level, suggesting this dam can always be avoided. Finally, one can simplify this analysis further by adopting a simple threshold rule, namely assume that for a given energy production target, all dams for which the energy level threshold is exceeded should be built. Compared with the PESN scenarios within each energy level, both energy production (Fig. S2A) and fish biomass (Fig. S2B) are within 2.5% of the best model scenario in nearly all cases (Fig. S2C). We also find this threshold rule works well for conservation (Fig. S2D).
Fig. 3.

Decision-supporting tool for tributary hydropower development. At each hydropower production level (upper abscissa, discretized at 1 TWh/y) we estimate the maximal remaining fish biomass (lower abscissa), and show what percentage of scenarios (within a range of 1% biomass of maxima at that energy range; for example, blue rectangle of Fig. 2A) include each dam. Stars denote the energy level threshold above which >50% of scenarios include each project. We suggest that a simple threshold rule can be used to design the best dam scenario for a given energy production target. Dams whose threshold is to the right of a vertical line at the target hydropower level should be avoided. This analysis improves on the ranking based only on a single dimension (Fig. S3).
In recent years construction of hydropower dams has occurred at an unprecedented rate. It is now estimated that 50% of all large rivers have been affected by dam construction (18, 19). Although socioeconomic progress is desirable, sustainable development requires that unnecessary risks to ecosystems and environmental services, such as fish production and biodiversity, be avoided. In the MRB we find that some hydropower projects can and should be avoided. Although the Mekong River and its tributaries are expected to be influenced by climate change and anthropogenic stressors (such as water extraction for domestic use of an increasing population), damming will continue to dominate the impacts on migratory fish (see SI Discussion). Our analysis has shown that hydropower generation, nearly all planned to be exported from Lao PDR to Thailand and Vietnam, will have strong and nonlinear trade-offs with floodplains fisheries production. This finding highlights the need for new regional agreements addressing transboundary impacts of tributary dam development in the Mekong River Basin.
Methods
Data Collection and Curation.
Our dataset was compiled from an extensive review of published and gray literature from 1936 to 2010 (including numerous projects Environmental Impact Assessments), of which 70 detailed fish species lists in 21 Mekong subbasins or main-stem sections were identified. We corrected for taxonomic name changes using www.fishbase.org. This dataset provides a comprehensive description of the fish biodiversity pattern in the Mekong River at a subbasin level (Table S1). Migratory species were identified using life-history information in four databases and published resources [Mekong Fish Database (20), www.fishbase.org, Halls and Kshatriya (21), and fishermen local knowledge (22)]. Finalization of the list was based on the expertise of one of the authors (E.B) as well as two additional Mekong fish experts.
Fish Migration Model.
Mekong fish fauna can be roughly classified into two guilds: long-distance migratory and nonmigratory species. We include in the latter guild fish that perform limited lateral migration. We developed a simple model of fish migration for understanding the relative abundance of the two guilds within each locality. Although animal migrations in seasonally varying environments have been studied in several models [see e.g., Holt and Fryxell (23) and references therein], our model differs from these by two key assumptions; (i) we assume that the upstream habitats are at their limiting (carrying) capacity at the end of each season, and (ii) we describe migration by a simple “migration effectiveness” e(d) that measures the number of returning offspring as function of distance d. We shall call the floodplains “habitat A,” and a particular upstream site “habitat B.” We formulate the model as a dynamical process for f(t), the fraction of migratory guild population in the dry-season in year t. Let K1 and K2 denote habitat B LCC in season 1 (the dry season) and season 2 (the wet season), respectively. After each annual cycle of migration, e(d)⋅f(t)⋅K1 migratory individuals return to habitat B. These compete with K2 nonmigratory individuals that grew there during the wet-season. This description holds regardless of the ecological reason for downstream migration: that is, feeding migration (spawning occurs upstream and young migrate to feed in floodplains) or spawning migration (adults find refuge upstream, but go downstream to spawn); both types are found in fish species of the Mekong River (24, 25). Assuming neutrality between the guilds, the number of migratory individuals surviving the dry-season (LCCMF) is the result of the following dynamic relation:
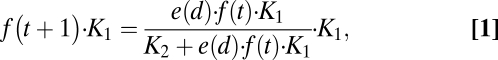 |
where for simplicity we ignored year-to-year variability in all parameters.
This model has a unique globally stable solution 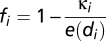 , where
  is the seasonality of habitat B (hereafter labeled by subscript i), and di is the distance of habitat B from the floodplains. We assume the population of each migratory species is proportional to sum over all accessible LCCMF within the species’ natural range (Table S3). Because nearly all planned dams do not consider fish passes, and the efficiency of fish passes in the Mekong, a river characterized by very high biodiversity, large biomass, and several migration pulses a year, has been strongly questioned, only habitats downstream of built dams are summed in calculating BCC. We note that in this model, all species found within one locality must have the same value of e(di), which justifies the use of a species-independent function. To understand this, consider two species with migration effectiveness ev and eu. For the former species to invade into a resident population of the latter, when the invading species is in scarcity
  and the resident has the equilibrium abundance found before
 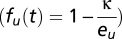 , one should satisfy
 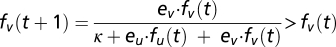 , which to first order in fv(t) gives ev > eu. Thus, invasion is possible if the migration effectiveness of the invading species is larger than that of the resident species. This process naturally leads to a successional series of invasions until some biological reason limits e. This limit is just the hallmark of the trade-off between fecundity and juvenile survival. Species can either have many young, with little care and therefore small survivorship (r selection), or fewer offspring with better chances of reaching adulthood (K selection).
Geospatial Analysis.
Seasonality (κ) was calculated based on hydrological modeling of the entire Mekong River at 5 arc-minute resolution by Costa-Cabral et al. (26). We defined κ as the ratio of mean runoff production in the wet season (July–October) and dry season (December–May). Seasonality can, in principle, be affected by other abiotic factors, in particular water temperature. Unlike temperate rivers, however, the water temperature in tropical rivers such as the Mekong River does not change appreciably between the two seasons. For example, from monthly monitoring data between 1985 and 1997 (courtesy of the MRC), water temperature in Pakse is around 25.8 °C in the dry season and 27.3 °C in the wet season. All spatially explicit calculations were performed with ArcGIS 9.3 (ESRI), and the average quantities over individual catchments were used throughout this study. LCC in each catchment area is proportional to the total discharge, namely runoff (precipitation minus evapotranspiration) multiplied by surface area. This quantity is an indicator for the amount of resources available for fish (20, 27) and its variability shows clear correlation to variability of local population size (28). The same approach was used in other studies of fish biodiversity in the Mississippi-Missouri (29) and Indian Peninsula (30). The MRC Hydropower Database (15) was used to determine the geographical position and mean annual energy production of each dam listed in the BDP2. We used the United States Geological Survey (USGS) HydroSHEDS database to define the catchment area upstream of each dam. The migration effectiveness e(di), which depends on distance from floodplains (we choose Phnom Penh as a convenient origin for distance measurement because it is between Cambodian Tonle Sap and Vietnamese floodplains; see Fig. 1A), is determined as explained in the legend of Fig. S4. Wetland habitats are less suitable than streams for migratory species (31, 32). We estimated that migration effectiveness is ∼50% lower in wetlands, based on the two surveys in upstream wetland villages (Table S4). The USGS global land-cover dataset was used to determine wetlands in each area. We defined wetlands as parcels the classification of which is irrigated grassland, wooded wet swamp, inland water, rice paddy/field, marsh wetland, or mangrove.
Estimating Biodiversity and Productivity Losses.
To determine biodiversity risks we adopted the definitions of the International Union for Conservation of Nature (IUCN), also used in the IUCN Red List (33). The criterion we use is the expected population decline after 10 y IUCN defines species whose population is predicted to decline by over 30%, 50%, and 80% in 10 y as vulnerable, endangered, and critically endangered, respectively. We use as a baseline the “pristine” river (i.e., a basin without any dams; a situation which actually existed before the year 1965). For brevity, we combine the endangered and critically endangered categories in Fig. 2.
To estimate floodplains migratory biomass, we used species-level catch-time series available from the bagnet (“dai”) fishery in the Tonle Sap River (collected every year from 1998–2009). We sum the total catch per species in all years to estimate relative abundances c(m) of 48 dominant migratory species (Table S5). The remaining 55 species are rare, or were otherwise not caught in the surveys. Total biomass loss was calculated by multiplying c(m) by each species population loss, and summing over species.
Sensitivity Analysis.
To check how our main result depends on modeling assumptions, we consider in Fig. 2D several simplifications of our model. Ignoring catch data [i.e., using c(m)=1/48 for all dominant species (uniform rank-abundance)] does not change our main results. Furthermore, ignoring seasonality and distance-dependent migration effectiveness by setting all fi to the mean value (0.6) retains the nonlinear trade-off we observe (uniform migratory species fraction). Finally, the disproportional deleterious impact of the LSS2 dam in Cambodia shows up even if we set all fi = 0.6 and ignore the spatial heterogeneity of dry-season runoff, namely set K1 = 1 for all habitats (uniform migratory species fraction and runoff).
Supplementary Material
Acknowledgments
We thank David Tilman, Pamela Matson, and Jianguo Wu for providing valuable comments on previous drafts of this manuscript. Fisheries data were kindly provided by the Inland Fisheries Research and Development Institute. We thank Ashley Halls for assistance in fish species classification. This work was supported in part by James S. McDonnell Foundation Grant 220020138 (to G.Z. and I.R.-I.); the AXA Research Fund (to G.Z.); and Mitsui-Bussan and the Government of Japan (Japan Mekong Fund) (E.B. and the WorldFish Center).
Footnotes
The authors declare no conflict of interest.
*The WorldFish Center is an international, nonprofit research organization dedicated to reducing poverty and hunger by improving fisheries and aquaculture. WorldFish is a member of the CGIAR Consortium, a global partnership that unites organizations engaged in research for sustainable development. Its funders include governments, foundations, and international and regional organizations.
3The conclusions of this research paper do not represent an official opinion or policy of IFReDI, the Fisheries Administration, or the Royal Government of Cambodia.
See Commentary on page 5553.
This article contains supporting information online at www.pnas.org/lookup/suppl/doi:10.1073/pnas.1201423109/-/DCSupplemental.
References
- 1.Mekong River Commission . State of the Basin Report 2010. Vientiane, Lao PDR: Mekong River Commission; 2010. [Google Scholar]
- 2.Mekong River Commission . IWRM -Based Basin Development Strategy for the Lower Mekong Basin. Vientiane, Lao PDR: Mekong River Commission; 2011. [Google Scholar]
- 3.Dugan PJ, et al. Fish migration, dams, and loss of ecosystem services in the Mekong basin. Ambio. 2010;39:344–348. doi: 10.1007/s13280-010-0036-1. [DOI] [PMC free article] [PubMed] [Google Scholar]
- 4.UNEP . Blue Harvest: Inland Fisheries as an Ecosystem Service. Penang, Malaysia: WorldFish Center; 2010. [Google Scholar]
- 5.Barlow C, Baran E, Halls AS, Kshatriya M. How much of the Mekong fish catch is at risk from mainstream dam development? Catch and Culture. 2008;14(3):16–21. [Google Scholar]
- 6.WWF . First Contact in the Greater Mekong—New Species Discoveries. Hanoi, Vietnam: World Wildlife Fund; 2008. [Google Scholar]
- 7.Poulsen AF, Poeu O, Viravong S, Suntornratana U, Tung NT. Fish Migrations of the Lower Mekong Basin: Implications for Development, Planning and Environmental Management. Phnom Penh: Mekong River Commission; 2002. [Google Scholar]
- 8.Baran E. Fish Migration Triggers in the Lower Mekong Basin and Other Tropical Freshwater Systems. Ventiane, Lao PDR: Mekong River Commission; 2006. [Google Scholar]
- 9.Baran E, Myschowoda C. Dams and fisheries in the Mekong Basin. Aquat Ecosyst Health Manage. 2009;12:227–234. [Google Scholar]
- 10.Grumbine RE, Xu JC. Environment and development. Mekong hydropower development. Science. 2011;332:178–179. doi: 10.1126/science.1200990. [DOI] [PubMed] [Google Scholar]
- 11.Dugan PJ. Mainstream dams as barriers to fish migration: International learning and implications for the Mekong. Catch and Culture. 2008;14(3):9–15. [Google Scholar]
- 12.Ferguson JW, Healey M, Dugan P, Barlow C. Potential effects of dams on migratory fish in the Mekong River: Lessons from salmon in the Fraser and Columbia Rivers. Environ Manage. 2011;47:141–159. doi: 10.1007/s00267-010-9563-6. [DOI] [PubMed] [Google Scholar]
- 13.Marmulla G, editor. Dams, Fish and Fisheries. Opportunities, Challenges and Conflict Resolution. Rome, Italy: FAO; 2001. [Google Scholar]
- 14.ICEM . MRC Strategic Environmental Assessment of Hydropower on the Mekong Mainstream. Hanoi, Vietnam: ICEM; 2010. [Google Scholar]
- 15.Mekong River Commission . Economic, Environmental and Social Impact Assessment of Basin-Wide Water Resources Development Scenarios. Vientiane, Lao PDR: Mekong River Commission; 2009. [Google Scholar]
- 16.Daily GC. Nature's Services: Societal Dependence on Natural Ecosystems. Washington, DC: Island Press; 1997. [Google Scholar]
- 17.Tilman D. The ecological consequences of changes in biodiversity: A search for general principles. Ecology. 1999;80:1455–1474. [Google Scholar]
- 18.Lehner B, et al. High-resolution mapping of the world's reservoirs and dams for sustainable river-flow management. Frontiers in Ecology and the Environment. 2011;9:494–502. [Google Scholar]
- 19.Nilsson C, Reidy CA, Dynesius M, Revenga C. Fragmentation and flow regulation of the world's large river systems. Science. 2005;308:405–408. doi: 10.1126/science.1107887. [DOI] [PubMed] [Google Scholar]
- 20.Guegan JF, Lek S, Oberdorff T. Energy availability and habitat heterogeneity predict global riverine fish diversity. Nature. 1998;391:382–384. [Google Scholar]
- 21.Halls AS, Kshatriya M. Modelling the Cumulative Barrier and Passage Effects of Mainstream Hydropower Dams on Migratory Fish Populations in the Lower Mekong Basin. Vientiane, Lao PDR: Mekong River Commission; 2009. [Google Scholar]
- 22.Baran E, Starr P, Kura Y. Influence of Built Structures on Tonle Sap Fisheries. Phnom Penh, Cambodia: Cambodia National Mekong Committee and the WorldFish Center; 2007. [Google Scholar]
- 23.Holt RD, Fryxell JM. Theoretical reflections on the evolution of migration. In: Milner-Gulland EJ, Fryxell JM, Sinclair ARE, editors. Animal Migration: A Synthesis. New York: Oxford University Press; 2011. pp. 17–31. [Google Scholar]
- 24.Poulsen AF, Ouch P, Sintavong V, Ubolratana S, Tung NT. Fish migrations of the Lower Mekong River Basin: implications for development, planning and environmental management. Phnom Penh, Cambodia: Mekong River Commission; 2002. [Google Scholar]
- 25.Baird IG, Flaherty MS, Phylavanh B. Rhythms of the river: Lunar phases and migrations of small carps (Cyprinidae) in the Mekong River. Nat Hist Bulletin of the Siam Society. 2003;51(1):5–36. [Google Scholar]
- 26.Costa-Cabral MC, et al. Landscape structure and use, climate, and water movement in the Mekong River basin. Hydrol Process. 2008;22:1731–1746. [Google Scholar]
- 27.Oberdorff T, Guegan JF, Hugueny B. Global scale patterns of fish species richness in rivers. Ecography. 1995;18:345–352. [Google Scholar]
- 28.Bayley PB, Li HW. Riverine Fishes. In: Petts GE, Calow P, editors. River Biota: Diversity and Dynamics. Oxford, UK; Cambridge, MA: Blackwell Science; 1996. pp. 92–122. [Google Scholar]
- 29.Muneepeerakul R, et al. Neutral metacommunity models predict fish diversity patterns in Mississippi-Missouri basin. Nature. 2008;453:220–222. doi: 10.1038/nature06813. [DOI] [PubMed] [Google Scholar]
- 30.Lynch HJ, et al. How restructuring river connectivity changes freshwater fish biodiversity and biogeography. Water Resour Res. 2011 doi: 10.1029/2010WR010330. [DOI] [Google Scholar]
- 31.Welcomme RL. Inland Fisheries: Ecology and Management. Hoboken, NJ: Wiley-Blackwell; 2001. [Google Scholar]
- 32.Welcomme RL, Winemiller KO, Cowx IG. Fish environmental guilds as a tool for assessment of ecological condition of rivers. River Res Appl. 2006;22:377–396. [Google Scholar]
- 33.International Union for Conservation of Nature (IUCN) IUCN Red List Categories and Criteria: Version 3.1. Gland, Switzerland and Cambridge, UK: IUCN Species Survival Commission; 2001. [Google Scholar]
Associated Data
This section collects any data citations, data availability statements, or supplementary materials included in this article.