

Abstract
2-Keto-3-deoxy-6-phosphogluconate (KDPG) and 2-keto-3-deoxy-6-phosphogalactonate (KDPGal) aldolases catalyze an identical reaction differing in substrate specificity in only the configuration of a single stereocenter. However, the proteins show little sequence homology at the amino acid level. Here we investigate the determinants of substrate selectivity of these enzymes. The Escherichia coli KDPGal aldolase gene, cloned into a T7 expression vector and overexpressed in E. coli, catalyzes retro-aldol cleavage of the natural substrate, KDPGal, with values of kcat/KM and kcat of 1.9 × 10⁴ M−1 s−1 and 4 s−1, respectively. In the synthetic direction, KDPGal aldolase efficiently catalyzes an aldol addition using a limited number of aldehyde substrates, including D-glyceraldehyde-3-phosphate (natural substrate), D-glyceraldehyde, glycolaldehyde, and 2-pyridinecarboxaldehyde. A preparative scale reaction between 2-pyridinecarboxaldehyde and pyruvate catalyzed by KDPGal aldolase produced the aldol adduct of the Rstereochemistry in >99.7% ee, a result complementary to that observed using the related KDPG aldolase. The native crystal structure has been solved to a resolution of 2.4 Å and displays the same (α/β)8 topology, as KDPG aldolase. We have also determined a 2.1 Å structure of a Schiff base complex between the enzyme and its substrate. This model predicts that a single amino acid change, T161 in KDPG aldolase to V154 in KDPGal aldolase, plays an important role in determining the stereochemical course of enzyme catalysis and this prediction was borne out by site-directed mutagenesis studies. However, additional changes in the enzyme sequence are required to prepare an enzyme with both high catalytic efficiency and altered stereochemistry.
Introduction
Enzymatic aldol addition is a powerful synthetic tool for stereocontrolled carbon–carbon bond formation. From a synthetic perspective, aldolases are broadly grouped according to nucleophile type, those that use: dihydroxyacetone phosphate (DHAP), [1] and [2] acetaldehyde, [3] and [4] glycine,5 and pyruvate or phosphoenolpyruvate (PEP). [6] and [7] From a mechanistic perspective, two classes of aldolases exist. [8], [9] and [10] The type I aldolases use a catalytic lysine to activate the nucleophilic substrate as the corresponding enamine, while type II aldolases use a Zn2+ ion to promote enol(ate) formation.
2-Keto-3-deoxy-6-phosphogluconate (KDPG) and 2-keto-3-deoxy-6-phosphogalactonate (KDPGal) aldolases are type I pyruvate aldolases of the Entner-Doudoroff and DeLey-Doudoroff glycolytic pathways, respectively.11 The Entner-Doudoroff pathway converts glucose to KDPG which, in turn, undergoes KDPG aldolase-catalyzed retro-aldol cleavage to the key metabolites pyruvate and d-glyceraldehyde-3-phosphate. In an analogous reaction sequence the DeLey-Doudoroff pathway converts galactose to the identical products through the action of KDPGal aldolase on KDPGal. During aldol addition, KDPG aldolase catalyzes the addition of pyruvate to electrophilic aldehydes with si-facial selectivity; KDPGal aldolase catalyzes the identical reaction but with opposite facial selectivity (Scheme 1). In contrast to other pyruvate aldolases KDPG and KDPGal aldolases display complete kinetic stereoselectivity, enhancing their utility as synthetic catalysts.
Scheme 1.

Aldol addition catalyzed by KDPG and KDPGal aldolases.
KDPG aldolase and KDPGal aldolase from Escherichia coli are both (α/β)8 barrel proteins that aggregate in solution as trimers. Although the proteins show similar tertiary and quaternary structures and catalyze the identical reaction differing in substrate specificity in only the configuration of a single stereocenter, the proteins show essentially no sequence homology at the amino acid level. As part of a broader study of the structural basis of the catalytic behavior of the pyruvate aldolases, we report the cloning, kinetics, substrate specificity, and crystal structure of KDPGal aldolase and compare its structure and activity to the analogous KDPG aldolase. Based on a model of bound substrate, we analyzed the role of two residues that appear poised to control the stereoselectivity of the enzymes—T161 in KDPG aldolase and V154 in the KDPGal analog.
Results and Discussions
Previously, we reported an initial characterization of the E. coli KDPGal aldolase using enzyme isolated from natural sources.12 Unlike KDPG aldolase, KDPGal aldolase is inducible and expressed only during growth of E. coli on galactose or galactonate.13 Because KDPG aldolase is a constitutively expressed enzyme, low-level contamination of the purified KDPGal aldolase by KDPG aldolase is a concern that is difficult to completely alleviate. To overcome this limitation, we cloned KDPGal aldolase following the work of Ran and coworkers and expressed the enzyme in a strain of E. coli lacking KDPG aldolase (eda–).14 The E. coli gene for KDPGal aldolase was amplified by PCR and cloned into a pET-28b(+) expression plasmid with a T7 RNA polymerase promoter to induce expression following treatment with isopropyl β-d-thiogalactopyranoside (IPTG).15 Constructs were prepared encoding the putative E. coli KDPGal aldolase gene in both native form and with a C-terminal His6 tag to facilitate purification. Bands corresponding to the predicted molecular weight for the native (21,381 Da) and the His6-tagged (22,682 Da) aldolases were identified in induced cell-free extracts from E. coli DF71 cultures transformed with the respective plasmid. The identity of the protein was confirmed by MALDI-MS which shows peaks at 21,383.6 Da (native) and 22,684.5 Da (His6-tagged). After induction, DF71 cells transformed with the His6-tagged plasmid produced 1200 U† of enzyme per liter of cell culture.
His6-tagged KDPGal aldolase was purified by nickel affinity chromatography; SDS–PAGE analysis suggested a protein purity of greater than 95%. Enzymatic assay of this preparation showed a specific activity of 80 U mg–1 at 25 °C for catalysis of the retro-aldol cleavage of KDPGal. Kinetic parameters for retro-aldol cleavage of KDPGal were determined using a coupled l-lactic dehydrogenase assay, yielding a value of kcat of 4 s–1, KM of 0.2 mM, and kcat/KM of 1.9 × 10⁴ M–1s–1 (Table 1). KDPG aldolase from E. coli has a similar value of KM, while the value of kcat is roughly 20-fold larger than that for KDPGal aldolase, leading to an enhanced catalytic efficiency of 8.0 × 10⁵ M–1s–1 for cleavage of KDPG
Table 1.
Kinetic parameters for KDPG and KDPGal aldolase.
| KDPG Aldolase | KDPGal Aldolase | |
|---|---|---|
| kcat (s−1) | 80 ± 2 | 18.0 ± 0.3 |
| KM (mM) | 0.1 ± 0.02 | 0.2 ± 0.01 |
| kcat / KM (mM−1s−1) | 800 ± 100 | 92 ± 5 |
The substrate specificity of E. coli KDPGal aldolase was investigated in the synthetic direction using a range of electrophiles and nucleophiles (Table 2). Both KDPG and KDPGal aldolases catalyze aldol addition using a broad range of electrophilic substrates, provided they incorporate polar functionality at C2, C3 or C4.16 Like KDPG aldolase, KDPGal aldolase does not efficiently catalyze aldol reactions using simple aliphatic aldehydes or benzaldehyde as electrophilic substrates. While KDPG aldolase accepts some nucleophiles other than pyruvate, including 2-oxobutanoate, phenylpyruvate,‡ and fluorobutanoate, KDPGal aldolase apparently only efficiently catalyzes aldol addition using pyruvate as the nucleophilic component (unpublished work). Additionally KDPG aldolase demonstrates a preference for the S-configuration at C2 of the electrophile; KDPGal aldolase accepts substrates of both stereochemical configurations. In both cases, the removal of the phosphate group from the natural electrophile d-glyceraldehyde-3-phosphate has a profound effect on the rate of conversion: d-glyceraldehyde is converted to 2-keto-3-deoxygluconate (galactonate) at roughly 1% the rate at which d-glyceraldehyde-3-phosphate is converted to 2-keto-3-deoxy-6-phosphogluconate (galactonate).
Table 2.
Substrate specifies of KDPG and KDPGal aldolases. The rate of aldol condensation relative to D-glyceraldehyde is denoted as follows: ++++, >100%; +++, 50 – 75%; ++, 25 – 50%; +, < 25%; ----, 0%.
| Electrophile | Nucleophile | KDPG Vrel16 |
Aldolase | KDPGal Vrel |
Aldolase |
|---|---|---|---|---|---|
| d-glyceraldehyde | pyruvate | 100 | 100 | ||
| 2-pyridinecarboxaldehyde | pyruvate | ++++ | +++ | ||
| d-ribose | pyruvate | + | +++ | ||
| chloroacetaldehyde | pyruvate | − − − − | ++ | ||
| d-erythrose | pyruvate | + | +++ | ||
| l-erythrose | pyruvate | − − − − | + | ||
| d-threose | pyruvate | + | + | ||
| l-threose | pyruvate | + | +++ | ||
| glycoladehyde | pyruvate | + | ++++ | ||
| 2-furaldehyde | pyruvate | + | − − − − | ||
| valeraldehyde | pyruvate | − − − − | + | ||
| benzaldehyde | pyruvate | − − − − | − − − − | ||
| d-glyceraldehyde | 2-ketobutyrate | ++++ | − − − − | ||
| d-glyceraldehyde | 3-flurobutyrate | + | − − − − |
The sense and extent of stereochemical discrimination during addition of pyruvate to unnatural electrophiles was determined by preparative scale synthesis of 4-hydroxy-2-keto-4-(2′-pyridyl) butyrate (Scheme 2). Conversion of the initial addition product to the corresponding lactone for chiral GC analysis requires conversion of the ketone to the dithioketal, according to our previously reported protocol.1713C and1H NMR spectra and the magnitude of the specific rotation were identical to those previously reported for the adduct prepared by KDPG aldolase-catalyzed addition.13 However, the sign of the rotation was opposite that of the KDPG aldolase product, consistent with re-facial selectivity during aldol addition. Chiral GC analysis showed a single peak, providing an enantioselectivity of >99.7%.
Scheme 2.

Preparative-scale condensation of pyruvate and pyridine carboxaldehyde.
Reagents: a) KDPGal aldolase; b) HCl, EtSH
The long-term goal of this work is to better define the structural basis of aldolase catalysis. The genes encoding KDPG and KDPGal aldolases are adjacent to each other on the E. coli genome, and presumably arose from a common precursor through gene duplication and subsequent evolution. Given that the two enzymes almost certainly arose from a single precursor and catalyze an identical reaction utilizing substrates that differ only in the stereochemical orientation of a single center, it is perhaps surprising that the two show virtually no sequence homology by standard BLAST comparison. [18] and [19] The E. coli KDPGal aldolase shows 25% amino acid sequence identity and 43% sequence similarity with the E. coli KDPG aldolase.20 On the other hand, the CLUSTALW alignment program shows that at least some of the residues predicted to be relevant for catalysis occur in similar loci (Fig. 1), including the catalytic lysine (K133/126) and the general base (E45/E37).
Figure 1.

The sequence homology between E. coli KDPG and KDPGal aldolase using CLUSTALW alignment.
In an attempt to rationalize the structural basis of KDPGal aldolase activity and substrate selectivity, we determined the native crystal structure to 2.4 Å resolution. We were unable to solve the structure by molecular replacement and, instead, calculated phases through single anomalous diffraction studies of selenomethionine-substituted protein. The protein shows a monomer in the asymmetric unit but the conventional trimer is generated by crystal symmetry (Fig. 2). The monomer of the KDPGal structure superimposes with the E. coli KDPG monomer with a root mean square deviation (rmsd) of 1.7 Å for 190 superimposable atoms: this difference in structure was sufficient to confound molecular replacement efforts. The two trimers superimpose with an rmsd of 2.3 Å for 562 superimposable atoms.
Figure 2.

Monomer and trimer of KDPGal aldolase.
We have recently reported crystal structures of both wild-type and mutant KDPG aldolases from Thermatoga maritima and E. coli and, on the basis of those structures, we proposed a molecular mechanism for catalysis. [11], [21] and [22] Like KDPG aldolase, KDPGal aldolase shows the canonical (α/β)8 barrel, a topology observed in roughly 10% of all known molecular structures (Fig. 3).23 A recently modeled structure of the KDPGal aldolase employed the (α/β)8 barrel topology.20 The catalytic lysine residue is conserved in space on the barrel; with the exception of transketolase/transaldolase the catalytic lysine of all type I (Schiff base) aldolases is conserved in space and located near the center of the barrel on β-strand 6.24 This conservation might plausibly reflect either divergent or convergent evolution. In accord with the former hypothesis, archaeal KDG aldolases, enzymes that show no stereochemical discrimination at C4, utilize this lysine placement.25 Alternatively, the location of the lysine on β-strand 6 may hold intrinsic benefits for the catalysis of aldol chemistry and arise in a convergent process. Our proposed mechanism for catalysis involves a general acid/base to facilitate both formation of the nucleophile enamine and nucleophilic addition, and the glutamate at position 37 of KDPGal aldolase is positioned to play this role. This assignment was confirmed by site-directed mutagenesis; the E37N mutant shows a kcat value reduced by 50-fold (0.07 vs 4 s–1) and a sixfold increase in KM (1.3 vs 0.2 mM) compared to wild-type protein. Similar decreases in activity are observed for the E45N mutant of KDPG aldolase[22].
Figure 3.
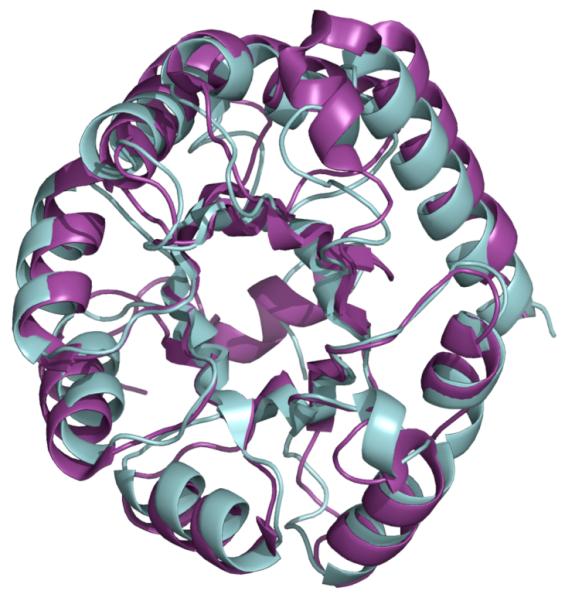
Change figure here. The E. coli KDPGal structure in cyan is essentially identical to the E. coli KDPG aldolase structure shown in purple.
The residues lining the substrate binding sites of KDPGal and KDPG aldolases show little conservation. On the other hand, many of the residues proposed as key mediators of KDPG aldolase activity are conserved in space in KDPGal aldolase. Phe135 and Pro136 of KDPG aldolase superimpose with Phe128 and Pro129 of KDPGal aldolase. Thr161, a residue conserved in KDPG aldolases, is replaced by Val154 in KDPGal aldolase. Additionally, the R49 side chain of KDPG aldolase, proposed to orient the nucleophilic substrate through formation of a salt bridge with the carboxylate moiety, falls in roughly the same locus in space as the side chain of R14 in KDPGal aldolase, despite the residues being located on different secondary elements (Fig. 4c). The KDPG aldolase residues that form a phosphate binding pocket—Ser184, G162, and G163—are also conserved in KDPGal aldolase. [22] and [26]
Figure 4.

(a) The co-complex of KDPGal aldolase with bound substrate; hydrogen bonds are shown as dotted lines. The residues discussed in the text are shown in stick and labeled. (b) The Fo-Fc electron density map contoured at 2.5 Å. Phases were derived from a model prior to any addition of ligand or water to this region. (c) Overlay of E. coli KDPGal (cyan) aldolase complex with our previous model of the E. coli KDPG (violet) aldolase-substrate complex. Shown in stick are key residues, with oxygen and nitrogen atoms colored red and blue, respectively, in both, and carbon atoms colored yellow in KDPGal aldolase and green in KDPG aldolase. For KDPGal aldolase the residues shown are the same as in A (but not labeled). For KDPG aldolase, residues R49, V20, E45, K133, T161, G158, and S184 are shown. The side chain of R49 of E. coli KDPG aldolase overlaps with the side chain of R14 of E. coli KDPGal aldolase. The difference in main chain position is unlikely to be significant as the KDPG aldolase from T. maritime11 has R14 in the same position as E. coli KDPGal.
KDPG and KDPGal aldolases catalyze identical reactions on substrates that differ in the configuration of only a single stereogenic center. Our initial models of the KDPG aldolase–KDPG complex suggested that the hydroxyl moiety of T161 could influence the stereochemical outcome of addition by preferentially hydrogen bonding through a water network to the C4 hydroxyl of the substrate in the gluco configuration. [21] and [22]
The corresponding residue in space in KDPGal aldolase is valine, and this residue is conserved throughout the KDPGal aldolases. We thus hypothesized that this residue might govern the stereoselectivity of aldol addition. To test our hypothesis, site-directed mutagenesis was used to prepare mutations at T161 in KDPG aldolase, converting the hydrogen-bonding residue to both alanine and valine. In parallel, the hydrophobic V154 residue of KDPGal aldolase was converted to both threonine and alanine. The kinetic parameters of wild-type and mutant proteins are shown in Table 3.
Table 3.
Activity and stereospecificity of KDPG and KDPGal mutant aldolases.
| Enzyme | Substrate | kcat (s−1) | Km (mM) | kcat/Km (mM−1 s−1) |
|---|---|---|---|---|
| WT KDPG | KDPG | 80 ± 2 | 0.1 ± 0.02 | 800 ± 100 |
| WT KDPG | KDPGal | 1.7 ± 0.1 | 0.6 ± 0.2 | 2.8 ± 0.9 |
| KDPG T161V | KDPG | 0.02 ± 0.002 | 0.3 ± 0.1 | 0.07 ± 0.02 |
| KDPG T161V | KDPGal | 0.008 ± 0.0005 | 0.08 ± 0.03 | 0.1 ± 0.04 |
| KDPG T161A | KDPG | 9.8 ± 0.2 | 0.2 ± 0.02 | 58 ± 5 |
| KDPG T161A | KDPGal | 0.5 ± 0.04 | 0.1 ± 0.05 | 5.0 ± 2.5 |
| WT KDPGal | KDPG | 1.4 ± 0.1 | 1.3 ± 0.3 | 1.1 ± 0.3 |
| WT KDPGal | KDPGal | 18.4 ± 0.3 | 0.2 ± 0.01 | 92 ± 5 |
| KDPGal V154T | KDPG | 0.01 ± 0.002 | 0.09 ± 0.07 | 0.1 ± 0.08 |
| KDPGal V154T | KDPGal | 0.2 ± 0.01 | 0.3 ± 0.1 | 0.7 ± 0.2 |
| KDPGal V154A | KDPG | 0.007 ± 0.0006 | 0.3 ± 0.1 | 0.02 ± 0.007 |
| KDPGal V154A | KDPGal | 0.5 ± 0.03 | 0.4 ± 0.1 | 1.3 ± 0.3 |
These data validate our hypothesis, at least in part. While wild-type KDPG aldolase shows roughly 40,000-fold selectivity for KDPG over KDPGal (kcat/KM, Table 3), the T161V mutant shows little stereoselectivity, accepting either substrate with roughly equal efficacy. Similarly, a 190-fold preference of KDPGal aldolase for KDPGal compared to KDPG is reduced to a sevenfold preference in the V154T mutant. Therefore, the identity of the residue at position 161/154 plays a major role in determining the stereoselectivity of these enzymes. On the other hand, the change in specificity is accompanied by a very significant loss of activity against both natural and epimeric substrates; conversion of T161 to a valine in KDPG aldolase diminishes the activity against KDPG by a factor of 104 and increases activity against KDPGal slightly. A similar, though not as pronounced, effect is observed in the KDPGal aldolase mutants. Replacement of the putative stereo-directing residue by alanine produces, perhaps not surprisingly, intermediate results. Thus, while the catalytic activity of the T161A mutant of KDPG aldolase for cleavage of KDPG is diminished by roughly a factor of 10, the activity against KDPGal is increased, by roughly a factor of 2. Assuming that the two substrates bind in the active sites in similar orientations, it is perhaps not surprising that conversion of a KDPG-specific aldolase to a KDPGal-specific aldolase would be more facile than the converse process; eliminating a hydrogen bond is more straightforward than creating one. In summary, this mutagenesis exercise demonstrates that while the amino acid at position 161 plays a role in determining stereoselectivity in aldol addition, other amino acid substitutions are also essential to create efficient KDPG and KDPGal aldolases with altered substrate selectivity.
To further probe the structural basis of stereoselectivity, we measured the diffraction pattern of the KDPGal aldolase-substrate complex, a structure which has eluded us with KDPG aldolase. Native KDPGal aldolase crystals were soaked with 20 mM KDPGal for 20 min prior to data collection. The resulting difference electron density clearly shows a covalent Schiff base complex between protein and substrate (Fig. 4a). The electron density is also suggestive of additional sulfate or phosphate occupancy, indicating less than complete substrate occupancy compensation in the crystal. We were unable to improve occupancy with longer soaks or with different substrate concentrations. Unsurprisingly the soak produces no significant change in the enzyme structure: Cα rmsd, excluding the flexible terminal residues, is less than 0.35 Å.
Fitting a model of KDPGal to this new density allows the identification of key residues contacting the substrate. The phosphate of the substrate is, as predicted, bound at the previously described phosphate binding site. [21] and [22] The KDPGal C4 and C5 hydroxyl moieties both participate in hydrogen bonds with R14, a residue we highlighted as conserved, despite being located on different secondary structural elements in KDPGal and KDPG aldolases (Figure 1 and Figure 4). Although this residue is likely important for substrate selectivity, this is difficult to probe by mutagenesis as deletion of this residue abolishes activity (data not shown). The key C4 hydroxyl moiety formed during aldol addition points away from the side chain of V154 but toward I12. In KDPG aldolase, V20 occupies the same position as I12 in KDPGal aldolase; however, in the model of KDPG bound to KDPG aldolase22 the C4 hydroxyl moiety is positioned away from V20. Interestingly, I12 and V20 appear to be conserved throughout the KDPGal and KDPG aldolase families, respectively. These data suggest that these residues may be partially involved in the stereoselectivity of the two enzymes, though further experimentation is required to fully elucidate the role of these residues. It is currently unclear whether these residues are vestigial, arising from a precursor protein, or the result of convergent evolution.
In our previous work22 we highlighted the trimer interface that brings residues from one monomer close to the active site of the adjacent unit. Our complex of bound KDPGal shows no direct contacts between substrate and the adjacent monomer, although alanines at positions 140 and 143 appear to impinge on the active site of the adjacent monomer. Both residues are located at the N-terminus of an α helix whose location varies slightly between KDPG and KDPGal aldolases, due to the presence of P146 in KDPGal (E119 in KDPG).
In toto, our results again illustrate our poor understanding of the factors that control enzyme efficiency and selectivity. Our system would seem an ideal candidate with which to study structure–function relationships in protein catalysis—two structurally well-characterized enzymes that utilize identical substrates in the synthesis direction catalyze the same chemical reaction, but differ only in the stereochemical outcome at a single center. Sequence alignment and structural studies highlight an obvious difference at the active site (T161 vs V154) which is predicted to underlie this behavior. Although mutation of this residue perturbs the stereochemical outcome, in accord with this prediction, it does so at the expense of significant catalytic activity. This problem has long dogged attempts to re-engineer enzymes through structure-based mutagenesis of active sites. Almost all changes mainly destroy enzyme activity; improvements in selectivity are produced only because the change is less catastrophic for one substrate than another.
Recently, the rational approach has been superseded by directed evolution. Here there exist at least a few examples of success, although often a decrease in catalytic activity also accompanies changes in specificity. Often, the most favorable changes in sequence tend to be located in flexible loops distant from the active site. [27] and [28] In contrast, mutations in the phosphate binding pocket of KDPG aldolase enhance the selectivity of this enzyme for hydrophobic substrates26 indicating that active site mutations may also be effective. In a recent review, Morley and Kazlauskas suggest that the prevalence of distal mutations in whole gene evolution experiments can be rationalized by simple probability.29 They posit that the number of amino acids located near the active site is much smaller than the number of distal residues, creating a biased distribution that leads to increased selection of mutations far from the active site. Their analysis of literature data suggests that mutations closer to the active site (<10 Å) are more likely to improve enantioselectivity while the effective distance for altering substrate selectivity is larger (<15 Å). [29] and [30] That mutations as far from the active site as 15 Å significantly alter substrate specificity is consistent with the notion that new functionality may arise from subtle remodeling across the entire protein architecture, and that single mutations alone are unlikely to provide highly efficient, optimized functionality. Indeed, the genomic relationship of KDPG and KDPGal aldolases and the striking lack of sequence similarity between two enzymes evolved to catalyze retro-aldol cleavage of such similar substrates would apparently mandate such a conclusion.
3. Conclusion
We have cloned, expressed, and characterized KDPGal aldolase from E. coli. KDPGal and KDPG aldolases show similar kinetic constants as well as similar structure topology. Our models of substrate binding predict an important role of a single residue on the stereochemical course of enzyme catalysis and this prediction was borne out by site-directed mutagenesis studies. However, all of these mutants have significantly diminished activity and therefore additional changes in the enzyme sequence are required to prepare an enzyme with both high catalytic efficiency and altered stereochemistry.
4. Experimental
4.1. Materials
Escherichia coli KDPGal-pTrc99A (pNR 7.088) plasmid14 was a generous gift from Dr. J.W. Frost, Michigan State University. Restriction endonucleases and T4 DNA ligase were purchased from New England Biolabs. Oligonucleotides were purchased from IDT (Integrated DNA Technologies, Inc.), Pfu DNA polymerase from Stratagene, and His-bind nickel affinity resin from Novagen. Plasmid preparation, bacterial transformation, enzymatic manipulation of DNA, and PCR DNA amplification were performed according to published procedures.31 XL-10 Gold strain of E. coli was used for cloning, whereas BL21 (DE3) or DF71 (eda–) strains of E. coli were used for protein expression.15 The DF71 cell line was obtained from the Yale Culture Facility. UV kinetic assays were performed on a Hewlett–Packard 8453 UV–vis spectrophotometer fitted with a thermocoupled cuvette holder. 1H and 13C NMR spectra were recorded on a Varian 300 MHz NMR spectrometer operating at 300.071 and 75.018, respectively.
4.2. Generating SacI and XhoI sites in pNR 7.088
Quikchange PCR was used to generate the restriction sites, SacI and XhoI, flanking the E. coli KDPGal aldolase gene in KDPGal-pTrc99A.32 The SacI site primers were designed and the gene was amplified by PCR (forward primer 1: 5′- CCGGGGATCCTATAAGGGAGCTCGCTCATGCAGTGGCA-3′; reverse primer 1: 5′- TGCCACTGCATGAGCGAGCTCCCTTATAGGATCCCCGG-3′) resulting in a SacI restriction site being generated. The crude PCR product was digested with DpnI (NEB) at 37 °C for 2 h and then transformed into XL-10 Gold cells (Novagen) followed by isolation of the plasmid DNA. The XhoI site primers were designed and the new gene was amplified by PCR (forward primer 2: 5′- GGCAGTGCAATGGCTCGAGTGCAAGCTTGGCTGTTTTGG-3′; reverse primer 2: 5′- CCAAAACAGCCAAGCTTGCACTCGAGCAGTCATTGCAC TGCC-3′) resulting in an XhoI restriction site being generated. The crude PCR product was digested with DpnI (NEB) at 37 °C for 2 h and then transformed into XL-10 Gold cells (Novagen) followed by isolation of the plasmid DNA (KDPGal-pTrc99A1) containing both the SacI and XhoI restriction sites. Plasmid KDPGal-pTrc99A (5 ng), PCR primers (250 ng each), dNTPs (200 μM each), Pfu buffer (5 μL, 10×, Stratagene), and Pfu DNA polymerase (2.5 U, Stratagene) were combined in a total volume of 50 μL. Each cycle of PCR amplification consisted of 95 °C for 30 s, 55 °C for 1 min, and 68 °C for 10 min for a total of 18 cycles. The E. coli KDPGal gene with the new restriction sites was confirmed by automated dideoxy sequencing.
4.3. Subcloning the E. coli KDPGal aldolase gene
The E. coli KDPGal gene was amplified from the KDPGal-pTrc99A1 plasmid by PCR using forward primer 1 and reverse primer 2 and the solution conditions listed above. Each cycle of PCR amplification consisted of 95 °C for 30 s, 58 °C for 30 s, and 72 °C for 1 min for a total of 50 cycles. The PCR product was purified using the QIAquick PCR purification kit (Qiagen) and digested with SacI (NEB) and XhoI (NEB) restriction enzymes at 37 °C for 16 h. A band of the correct size predicted for the digested KDPGal aldolase gene was purified by gel electrophoresis and ligated into a modified T7 expression vector pET28b (Novagen) digested with SacI and XhoI restriction enzymes. A His6-tag was then added to the 3′ end of the E. coli KDPGal gene using Quikchange PCR32 (forward primer 3: 5′-GAAGGCAGTGCAATTACTGCTCGAGCACCAC-3′; reverse primer 3: 5′-GTGGTGCTCGAGCAGTAATTG CACTGCCTCTC-3′) to introduce a stop codon (TGA) for a leucine (TAA). This crude PCR product was digested with DpnI (NEB) at 37 °C for 2 h and then transformed into XL-10 Gold cells followed by isolation of the new DNA. The His-tagged KDPGal gene in this plasmid (KDPGal-pET) was confirmed by automated dideoxy sequencing.
4.4. Expression of active E. coli KDPGal aldolase
The plasmid encoding the E. coli KDPGal gene (KDPGal-pET) was transformed into DF71 cells according to published procedures. The transformed mixture was spread on LB plates containing kanamycin (50 μg mL–1) and allowed to incubate for 14–16 h at 37 °C. A colony was picked and inoculated in 50 mL of TB culture media (EMD Chemicals) containing kanamycin (50 μg mL–1) and allowed to incubate for 14–16 h in a 250 rpm shaker at 37 °C. Ten milliliters of this overnight culture was used to inoculate 1 L of TB culture media containing kanamycin (50 μg mL–1) and incubated in the shaker untill OD600 = 0.6 was reached. Protein production was induced by addition of 1 mM isopropyl-β-d-thiogalactopyranoside (IPTG) followed by incubation at 37 °C for 4 h. Cells were harvested by centrifugation (5000 rpm, 10 min), re-suspended in 20 mM HEPES, pH 7.5, and disrupted by a French Press (12000 psi). Cellular debris was removed by centrifugation (10000 rpm, 20 min). The resulting extract was filtered (0.22 μm) and applied to a nickel affinity column. The resin was washed and eluted according to the manufacturer’s protocol (Novagen). His6-KDPGal eluted in 500 mM imidazole. The final eluent was dialyzed three times against 20 mM HEPES, pH 7.5, to remove imidazole. Protein concentrations were determined by the method of Edelhoch.33
4.5. Site-directed mutagenesis
Quikchange PCR32 was used on the constructed E. coli KDPG-pET34 and KDPGal-pET plasmids. The primers (Table 4) were designed to change T161 in KDPG aldolase into an alanine or valine as well as to change V154 in KDPGal aldolase into an alanine or threonine. The gene was amplified by PCR resulting in the desired mutation being generated. The crude PCR product was digested with DpnI (NEB) at 37 °C for 2 h and then transformed into XL-10 Gold cells (Novagen) followed by isolation of the new plasmid DNA. Plasmid KDPGal-pET (5 ng) or KDPG-pET (5 ng), PCR primers (250 ng each), dNTPs (200 μM each), Pfu buffer (5 μL, 10×, Stratagene), and Pfu DNA polymerase (2.5 U, Stratagene) were combined in a total volume of 50 μL. Each cycle of PCR amplification consisted of 95 °C for 30 s, 55 °C for 1 min, and 68 °C for 10 min for a total of 18 cycles. The generated mutations were confirmed by automated dideoxy sequencing.
Primers used for site-directed mutagenesis.
| Site-Directed Mutant | Primer Sequence: |
|---|---|
| KDPG T161V | For: 5′-CCGTTTCTGCCCGGTGGGTGGTATTTCT-3′ Rev: 5′-AGAAATACCACCCACCGGGCAGAAACGG-3′ |
| KDPG T161A | For: 5′-CCGTTTCTGCCCGGCGGGTGGTATTTCT-3′ Rev: 5′-AGAAATACCACCCGCCGGGCAGAAACGG-3′ |
| KDPGal V154T | For: 5′-CGCAGTCTTTGCCACTGGCGGCGTGACG-3′ Rev: 5′-CGTCACGCCGCCAGTGGCAAAGACTGCG-3′ |
| KDPGal V154A | For: 5′-CGCAGTCTTTGCCGCCGGCGGCGTGACG-3′ Rev: 5′-CGTCACGCCGCCGGCGGCAAGACTGCG-3′ |
4.6. Expression of KDPG and KDPGal aldolase mutants
Plasmids encoding the E. coli KDPGal or KDPG aldolase genes (E. coli KDPG-pET34 and KDPGal-pET) were transformed into DF71 (eda–) cells to avoid wild-type KDPG aldolase contamination. Cell cultures were grown and the mutant KDPG and KDPGal aldolases purified as previously described for wild-type enzymes except that protein production was induced by addition of 1 mM IPTG followed by incubation at 25 °C for 16 h.
4.7. Structural biology
Protein was purified as described above and concentrated to 10 mg mL–1 for crystallization experiments. Selenomethionine protein was prepared using the same construct by methionine biosynthesis inhibition.35 The protein was crystallized by screening against a wide range of conditions using sitting drop vapor diffusion. Initial crystal quality was assessed visually and the conditions which gave the most regular crystals (appearance) were optimized by systematically varying pH, buffer, and concentrations (protein, buffer, and precipitant). As judged by eye, the best crystals were obtained with protein at 5 mg ml–1 in 0.1 M MES mixed with equal volume of precipitating solution (0.1 M MES, 30% PEG 200, and 5% PEG 3000) dialyzed against 100× volume of the precipitating solution. Crystals grow as cubes with an edge of 0.2 mm in size. Native data and selenomethionine data were collected on BM14 (UK) using ADSC quantum CCD detector. Data were collected on crystals which were cryocooled to 100 K without addition of any other solution. Data were scaled and merged using MOSFLM36 and SCALA,37 part of the CCP4 package.38 Two selenium atoms were located by SHELXD and phases calculated with SHELXE.39 The map was clear enough to build in the KDPGal model based on our existing KDPG structure.21 The structure was refined using REFMAC5—TLS [40] and [41] and water added by hand. Manual rebuilding of the model used COOT.42 Full statistics on the data collection and refinement are given in Table 5. The structure and data have been deposited with the Protein Data Bank with accession codes 2v81 and 2v82.
Collected Crystal Data of KDPGal Aldolase.
| Data collection | SAD (Se Met) | KDPGal complex |
|---|---|---|
| Wavelength (Å) |
0.9781 | 0.979 |
| Resolution (Highest Shell, Å) |
59.-2.4 (2.46-2.40) |
50.-2.1 (2.2-2.10) |
| Spacegroup | H3 | |
| Cell constants (Å) α=β=90 γ=120° |
a=b=107.2 c=76.5 | a=b=104.6 c=74.2 |
| Unique reflections | 12814 (928) | 17654 |
| Average redundancy | 3.1 (3.0) | 4.2 (4.0) |
| Mean I/σ | 13.4 (5.0) | 20 (5.0) |
| Completeness (%) | 100.0 (100.0) | 100.0 (100.0) |
| Anom complete (%)a | 99.9 (100.0) | 0 |
| Rmergeb | 0.107 (0.217) | 0.059 (0.361) |
| Refinement | ||
| R | 19.6 (20.5) | 21.6 (24.4) |
| Rfree | 21.9 (25.3) | 24.7 (25.4) |
| rmsd bonds (Å) / angles (°) | 0.01 / 1.09 | 0.011/ 1.27 |
| Residues in disallowed regions of ramachandran plots |
0 | 0 |
| Protein atoms Water atoms Ligand |
1512 52 |
1502 61 16 |
| Average B-factor (Å2) | 40 | 35 |
| PDB accession code | 2v81 | 2v82 |
4.8. Enzyme kinetic parameters
Aldolase activity was measured using the standard coupled assay with l-lactic dehydrogenase. HEPES (20 mM, pH 7.0), NADH (0.42 mM), KDPGal or KDPG (0.2×–5× KM), and l-lactic dehydrogenase (EC 1.1.1.27 type II from rabbit muscle, 105 U) were added to a disposable cuvette. Aldolase was added to initiate the reaction and the disappearance of reduced cofactor was monitored for 5 min by the absorbance decrease at 340 nm. Aldolase activity was determined from the initial slope of the absorbance versus time curve, and kinetic parameters were determined by fits of the Michaelis–Menten equation to velocity versus substrate data using Origin 5.0 (Microcal). KDPGal and KDPG were synthesized according to published procedures. [12] and [43]
4.9. Substrate specificity
Unnatural nucleophile and electrophile assays were performed on a 500 μL scale with electrophile and nucleophile concentrations both at 50 mM. Aliquots (50 μL) were removed from the reaction over a 24-h period and progress of the reaction was monitored by the disappearance of pyruvate. The aldolase in the aliquots was inactivated by treatment with 7% perchloric acid (20 μL) and neutralized with NaOH, then 5 μL of each sample was assayed for residual pyruvate by a modification of the standard assay. Buffer (HEPES, 20 mM, pH 7.5), NADH (0.1 mM), and the reaction sample were added to a disposable cuvette. An initial UV absorbance value at 340 nm was recorded; l-lactic dehydrogenase (EC 1.1.1.27 type II from rabbit muscle, 2.0 μL) was added to the sample. After stabilization of the absorbance, the final value was recorded. The difference in initial and final absorbance values was plotted against time to yield a curve corresponding to the loss of pyruvate.
4.10. Synthesis of 4-hydroxy-2-keto-4-(2′-pyridyl)butyrate (enzymatic)
2-Pyridinecarboxaldehyde (4 mL, 36 mmol) was dissolved in HEPES buffer (20 mM, pH 7.5, 400 mL). E. coli KDPGal aldolase (600 U) was added to the mixture followed by sterile filtration (22 μm). Sodium pyruvate (3.8 g, 35 mmol) was dissolved in HEPES buffer (20 mM, pH 7.5, 30 mL) and sterile filtered. Sodium pyruvate was added to the enzyme solution in 5 mL aliquots over a 3-h period at 25 °C. The mixture was allowed to incubate at room temperature for 16 h and then lyophilized. The crude material was stirred in 600 mL of ethanol for 30 min and then filtered. Ethanol was then removed under reduced pressure and the solid was dried under vacuum for 1 h. One mole equivalent of LiCl (1.5 g, 34 mmol) was dissolved in deionized water (60 mL) and added to the crude product, stirred until no solid remained, and then lyophilized. Ethanol (50 mL) was added to the resulting solid and stirred followed by chilling at –20 °C for 4 h. This resulted in a white precipitate being formed which was filtered and washed with 100 mL of cold ethanol and then allowed to dry. This resulting solid was used without any further purification. 1H NMR (D2O) δ 2.93 (dd, 1H, J = 5.5, 15.6 Hz), 3.14 (dd, 1H, J = 8.0, 15.0 Hz), 5.21 (dd, 1H, J = 6.0. 8.0 Hz), 7.41 (t, 1H, J = 6.5 Hz), 7.56 (d, 1H, J = 8.0 Hz), 7.93 (t, 1H, J = 7.7 Hz), 8.40 (d, 1H, J = 5.5 Hz) ppm. 13C NMR (D2O) δ 41.8, 63.5, 120.0, 123.1, 138.0, 140.9, 155.1, 167.3, 168.0 ppm. HRMS calculated for C9H8NO4: 218.0429, found 218.0429.
4.11. Synthesis of racemic 4-hydroxy-2-keto-4-(2′-pyridyl)butyrate (chemical)44
Oxalacetic acid (4.5 g, 35 mmol) was dissolved in 3 M NaOH (20 mL) at 0 °C and brought to pH 9.0. 2-pyridine carboxaldehyde (3.75 g, 35 mmol) was added and the resulting solution was adjusted to pH 9.0 and maintained over a 1-h period. Once stabilized the solution was allowed to stir at room temperature for an additional hour. The pH of the reaction was lowered to 3.5 by addition of strongly acidic (Amberlyst 131) ion exchange (H+) resin. Spontaneous decarboxylation accompanied acidification. The solution was adjusted to pH 7.0 and then lyophilized. The crude material was stirred in 750 mL ethanol for 30 min and then filtered. The material was washed with ethanol and precipitated with LiCl as described above for the enzymatic synthesis. The resulting solid was used without any further purification. Spectral data (1H and 13C NMR) are identical to those previously reported.
4.12. Synthesis of 2,2-dithioethyl-4-(2′-pyridyl)-4-butyro-γ-lactone
The lithium carboxylate salt of the α-keto acid (400 mg, 2.0 mmol) in a 25 mL scintillation vial was treated with ethane thiol (6 mL) and HCl (2 mL). The solution was stirred overnight at room temperature. Distillation removed excess ethane thiol and the pH was brought up to ~7 followed by an extraction with CH2Cl2 (3 × 10 mL) to yield the crude dithioacetal. The extracts were dried over MgSO4 and the solvent was removed under reduced pressure. Silica gel chromatography (hexane/ethyl acetate, 3:1) yielded the desired dithioacetal. 1H NMR (CDCl3) δ 1.18 (t, 3H, J = 7.5), 1.22 (t, 3H, J = 7.5), 2.58–2.93 (m, 6H), 5.63 (dd, 1H, J = 6.32, 9.4 Hz), 7.18–7.23 (m, 1H), 7.41–7.44 (m, 1H), 7.68 (dt, 1H, J = 1.9, 6.0 Hz), 8.50–8.53 (m, 1H) ppm. 13C NMR (CDCl3) δ 13.6, 13.7. 24.1, 24.6, 45.8, 58.2, 78.3, 120.4, 123.3, 137.0, 149.3, 157.1, 171.7 ppm. HRMS calculated for C13H17NO2S2: 284.0778, found 284.0779.
4.13. Chiral GC
Chiral GC was performed on a Varian CP-3800 gas chromatograph using a Chromopack Chirasil-l- Val column (25 m × 0.25 mm ID) at temperature of 160 °C and pressure of 15 psi. This was used to determine the configuration of the 2,2-dithioethyl-4-(2′-pyridyl)-4-butyro-γ-lactone.
Acknowledgments
This work was supported by the National Institutes of Health (GM 61596). M.J.W. is supported in part by the NIH Chemistry–Biology Interface Training Grant. We would like to thank Manoj Cheriyan and Lance Rieter for carrying out the enzymatic assay with KDPG aldolase between 2- pyridinecarboxaldehyde and phenyl pyruvate.
References
- (1).Takayama S, McGarvey GJ, Wong CH. Annu. Rev. Microbiol. 1997;51:285–310. doi: 10.1146/annurev.micro.51.1.285. [DOI] [PubMed] [Google Scholar]
- (2).Zannetti MT, Walter C, Knorst M, Fessner WD. Chem.-Eur. J. 1999;5:1882–1890. [Google Scholar]
- (3).Heine A, Luz JG, Wong CH, Wilson IA. J. Mol. Biol. 2004;343:1019–1034. doi: 10.1016/j.jmb.2004.08.066. [DOI] [PubMed] [Google Scholar]
- (4).Racker E. J. Biol. Chem. 1952;196:347–365. [PubMed] [Google Scholar]
- (5).Liu JQ, Dairi T, Itoh N, Kataoka M, Shimizu S, Yamada H. J. Mol. Catal. B-Enzym. 2000;10:107–115. [Google Scholar]
- (6).Allen ST, Heintzelman GR, Toone EJ. J. Org. Chem. 1992;57:426–427. [Google Scholar]
- (7).Henderson D, Toone EJ, Pinto BM, editors. Vol. 3. Elsevier Science; Amsterdam: 1999. pp. 367–440. [Google Scholar]
- (8).Horecker BL, Tsolas O, Lai CY. In: The Enzymes. Boyer PD, editor. Vol. VII. Academic Press; New York: 1972. pp. 213–258. [Google Scholar]
- (9).Trombetta G, Balboni G, Iasio AD, Grazi E. Biochem. Biophys. Res. Commun. 1977;74:1297–1301. doi: 10.1016/0006-291x(77)90583-6. [DOI] [PubMed] [Google Scholar]
- (10).Kuo DJ, Rose IA. Biochemistry. 1985;24:3947–3952. doi: 10.1021/bi00336a022. [DOI] [PubMed] [Google Scholar]
- (11).Griffiths JS, Wymer NJ, Njolito E, Niranjanakumari S, Fierke CA, Toone EJ. Bioorg. Med. Chem. 2002;10:545–550. doi: 10.1016/s0968-0896(01)00307-8. [DOI] [PubMed] [Google Scholar]
- (12).Cotterill IC, Henderson DP, Shelton MC, Toone EJ. J. Mol. Catal. B- Enzym. 1998;5:103–111. [Google Scholar]
- (13).Henderson DP, Cotterill IC, Shelton MC, Toone EJ. J. Org. Chem. 1998;63:906–907. doi: 10.1021/jo971549s. [DOI] [PubMed] [Google Scholar]
- (14).Ran NQ, Draths KM, Frost JW. J. Am. Chem. Soc. 2004;126:6856–6857. doi: 10.1021/ja049730n. [DOI] [PubMed] [Google Scholar]
- (15).Studier FW, Rosenberg AH, Dunn JJ, Dubendorff JW. Methods Enzymol. 1990;185:60–89. doi: 10.1016/0076-6879(90)85008-c. [DOI] [PubMed] [Google Scholar]
- (16).Shelton MC, Cotterill IC, Novak STA, Poonawala RM, Sudarshan S, Toone EJ. J. Am. Chem. Soc. 1996;118:2117–2125. [Google Scholar]
- (17).Henderson DP, Shelton MC, Cotterill IC, Toone EJ. J. Org. Chem. 1997;62:7910–7911. doi: 10.1021/jo971549s. [DOI] [PubMed] [Google Scholar]
- (18).Altschul SF, Madden TL, Schaffer AA, Zhang JH, Zhang Z, Miller W, Lipman DJ. Nucleic Acids Res. 1997;25:3389–3402. doi: 10.1093/nar/25.17.3389. [DOI] [PMC free article] [PubMed] [Google Scholar]
- (19).Schaffer AA, Aravind L, Madden TL, Shavirin S, Spouge JL, Wolf YI, Koonin EV, Altschul SF. Nucleic Acids Res. 2001;29:2994–3005. doi: 10.1093/nar/29.14.2994. [DOI] [PMC free article] [PubMed] [Google Scholar]
- (20).Wymer N, Buchanan LV, Henderson D, Mehta N, Botting CH, Pocivavsek L, Fierke CA, Toone EJ, Naismith JH. Structure. 2001;9:1–9. doi: 10.1016/s0969-2126(00)00555-4. [DOI] [PubMed] [Google Scholar]
- (21).Fullerton SWB, Griffiths JS, Merkel AB, Cheriyan M, Wymer NJ, Hutchins MJ, Fierke CA, Toone EJ, Naismith JH. Bioorg. Med. Chem. 2006;14:3002–3010. doi: 10.1016/j.bmc.2005.12.022. [DOI] [PMC free article] [PubMed] [Google Scholar]
- (22).Nagano N, Orengo CA, Thornton JM. J. Mol. Biol. 2002;321:741–765. doi: 10.1016/s0022-2836(02)00649-6. [DOI] [PubMed] [Google Scholar]
- (23).Ran NQ, Frost JW. J. Am. Chem. Soc. 2007;129:6130–6139. doi: 10.1021/ja067330p. [DOI] [PubMed] [Google Scholar]
- (24).Jia J, Schorken U, Lindqvist Y, Sprenger GA, Schneider G. Protein Sci. 1997;6:119–124. doi: 10.1002/pro.5560060113. [DOI] [PMC free article] [PubMed] [Google Scholar]
- (25).Lamble HJ, Heyer NI, Bull SD, Hough DW, Danson MJ. J. Biol. Chem. 2003;278:34066–34072. doi: 10.1074/jbc.M305818200. [DOI] [PubMed] [Google Scholar]
- (26).Cheriyan M, Toone EJ, Fierke CA. Protein Sci. 2007;16:2368–2377. doi: 10.1110/ps.073042907. [DOI] [PMC free article] [PubMed] [Google Scholar]
- (27).Orencia MC, Yoon JS, Ness JE, Stemmer WPC, Stevens RC. Nat Struct Mol Biol. 2001;8:238–242. doi: 10.1038/84981. [DOI] [PubMed] [Google Scholar]
- (28).Horsman GP, Liu AMF, Henke E, Bornscheuer UT, Kazlauskas RJ. Chem.-Eur. J. 2003;9:1933–1939. doi: 10.1002/chem.200204551. [DOI] [PubMed] [Google Scholar]
- (29).Morley KL, Kazlauskas RJ. Trends Biotechnol. 2005;23:231–237. doi: 10.1016/j.tibtech.2005.03.005. [DOI] [PubMed] [Google Scholar]
- (30).Park HS, Nam SH, Lee JK, Yoon CN, Mannervik B, Benkovic SJ, Kim HS. Science. 2006;311:535–538. doi: 10.1126/science.1118953. [DOI] [PubMed] [Google Scholar]
- (31).Sambrook J, Russell DW. Molecular Cloning: A Laboratory Manual. 3rd ed Cold Springs Laboratory Press; Cold Spring Harbor, New York: 2001. [Google Scholar]
- (32).Zheng L, Baumann U, Reymond JL. Nucleic Acids Res. 2004:32. doi: 10.1093/nar/gnh110. [DOI] [PMC free article] [PubMed] [Google Scholar]
- (33).Edelhoch H. Biochemistry. 1967;6:1948. doi: 10.1021/bi00859a010. [DOI] [PubMed] [Google Scholar]
- (34).Griffiths JS, Cheriyan M, Corbell JB, Pocivavsek L, Fierke CA, Toone EJ. Bioorg. Med. Chem. 2004;12:4067–4074. doi: 10.1016/j.bmc.2004.05.034. [DOI] [PubMed] [Google Scholar]
- (35).Doublie S. Macromolecular Crystallography, Pt A. Vol. 276. Academic Press Inc; San Diego: 1997. pp. 523–530. [Google Scholar]
- (36).Leslie AGW. Joint CCP4 and ESF-EAMCB newsletter on protein crystallography. 1992;26:1–10. [Google Scholar]
- (37).Evans PR. Joint CCP4 and ESF-EAMCB newsletter on protein crystallography. 1997;33:22–24. [Google Scholar]
- (38).CCP4 Acta Cryst. D. 1994;50:760–763. doi: 10.1107/S0907444994003112. [DOI] [PubMed] [Google Scholar]
- (39).Schneider TR, Sheldrick GM. Acta Crystallogr. Sect. D-Biol. Crystallogr. 2002;58:1772–1779. doi: 10.1107/s0907444902011678. [DOI] [PubMed] [Google Scholar]
- (40).Murshudov GN, Vagin AA, Lebedev A, Wilson KS, Dodson EJ. Acta Crystallogr. Sect. D-Biol. Crystallogr. 1999;55:247–255. doi: 10.1107/S090744499801405X. [DOI] [PubMed] [Google Scholar]
- (41).Murshudov GN, Vagin AA, Dodson EJ. Acta Crystallogr. Sect. D-Biol. Crystallogr. 1997;53:240–255. doi: 10.1107/S0907444996012255. [DOI] [PubMed] [Google Scholar]
- (42).Emsley P, Cowtan K. Acta Crystallogr. Sect. D-Biol. Crystallogr. 2004;60:2126–2132. doi: 10.1107/S0907444904019158. [DOI] [PubMed] [Google Scholar]
- (43).Oconnell EL, Meloche HP. Method Enzymol. 1982;89:98–101. [Google Scholar]
- (44).Cornforth JW, Firth ME, Gottshack A. Biochem. J. 1958;68:57–61. doi: 10.1042/bj0680057. [DOI] [PMC free article] [PubMed] [Google Scholar]