

Abstract
Objective:
To assess pharmacokinetic interaction of garlic with atorvastatin in dyslipidemic rats.
Materials and Methods:
Sprague Dawley rats with induced dyslipidemia were divided into five groups of eight rats each. Group 1 was given atorvastatin (10 mg/kg body weight (b.wt) orally), group 2 was given atorvastatin (10 mg/kg b.wt orally)+garlic (1% w/w in feed), group 3 was maintained on atorvastatin (5 mg/kg b.wt orally)+garlic (0.5% w/w in feed), group 4 was maintained on atorvastatin (7.5 mg/kg b.wt orally)+garlic (0.25% w/w in feed), and group 5 was maintained on atorvastatin (2.5 mg/kg b.wt orally)+garlic (0.75% w/w in feed) for 12 weeks. Blood samples were collected at predetermined time intervals for kinetic analysis after the first and last oral dosing of atorvastatin for single and multiple dose studies, respectively. Plasma samples were assayed for atorvastatin concentration by High-Performance Liquid Chromatography (HPLC) and then the concentration-time data were analyzed.
Results:
Maximum observed plasma concentration (Cmax), half-life, Area Under Plasma Concentration Time Curve (AUC), and Mean Resident Time (MRT) were significantly (P<0.05) increased during multiple dose kinetic study and elimination rate constant was significantly (P<0.05) decreased in comparison with their respective single-dose values, while there was no significant difference in time to achieve maximum concentration (tmax) in all groups during both phases of the study. The highest values for kinetic parameters were observed in group 2 with correspondingly low activity of Cytochrome P450 (CYP450).
Conclusion:
The study revealed higher values [Cmax, AUC, Area Under The Moment Curve (AUMC), MRT, and half-life] of atorvastatin in garlic-treated groups.
KEY WORDS: Atorvastatin, garlic, pharmacokinetics
Introduction
Statins are effective therapeutic tools for dyslipidemia and reduce the risk of cardiovascular morbidity and mortality in patients with or at risk for coronary heart disease.[1] Atorvastatin reduces the levels of total cholesterol, Low-Density Lipoprotein (LDL)-cholesterol, triglycerides, and Very Low-Density Lipoprotein (VLDL) cholesterol and increases High-Density Lipoprotein (HDL) cholesterol levels in patients with a wide variety of dyslipidemia;[2] it is projected as a promising drug for monotherapy of varying degrees of hypercholesterolemia and hypertriglyceridemia.[3] The usage of herbal therapies along with prescription and Over-The-Counter (OTC) medications is increasing day by day. Garlic has been targeted for its hypotensive and hypocholesterolemic activity,[4] as its constituents are claimed to inhibit 3-Hydroxy-3-Methyl-Glutaryl Coenzyme-A (HMG CoA) reductase.[5] Raw, rather than cooked garlic is reported to be more beneficial in reducing blood cholesterol, triglycerides, and glucose levels, and could potentially play an important role in preventing atherosclerosis or diabetes.[6] This can be attributed to the presence of volatile sulfur compounds, thiosulfinates such as alliin and allicin that are inactivated upon cooking.[7]
Generally, herbal products are considered to be safe, but they can interact with allopathic drugs and result in altered activity and toxicity. Current information on herb-drug interaction is scanty, while there is progressive increase in the use of herbs in India and across the world. Herbs like garlic compete with other agents for metabolism by Cytochrome P450 (CYP450) affecting the bioavailability of co-administered drugs that may lead to potentially severe clinical manifestations.[8,9] Keeping this in view, we have studied the pharmacokinetic interactions of garlic with atorvastatin in dyslipidemic Sprague Dawley rats.
Materials and Methods
Experimental Design
After acclimatization for three weeks, 40 male Sprague Dawley rats of uniform age and weight were procured from National Institute of Nutrition, Hyderabad, and fed with diet containing 14% beef tallow and 1% cholesterol for six weeks to induce dyslipidemia. Then they were randomly divided into five groups with eight rats each and treated as follows for 12 weeks:
Group 1: Atorvastatin (10 mg/kg b.wt. orally) control
Group 2: Atorvastatin (10 mg/kg b.wt. orally)+Garlic (1% w/w in feed)
Group 3: Atorvastatin (5 mg/kg b.wt. orally)+Garlic (0.5% w/w in feed)
Group 4: Atorvastatin (7.5 mg/kg b.wt. orally)+Garlic (0.25% w/w in feed)
Group 5: Atorvastatin (2.5 mg/kg b.wt. orally)+Garlic (0.75% w/w in feed)
Garlic treatment was initiated two weeks prior to the first dose of atorvastatin. Pharmacokinetic study was performed in six animals from all groups in two phases. First phase was a single-dose pharmacokinetic study after the first dose of atorvastatin and the second phase was multiple dose pharmacokinetic study after the last dose of the same. In both phases, similar protocols were followed for drug administration and blood collection. Atorvastatin was administered orally once daily as a suspension in distilled water. Blood (approximately 500 μl) was collected from retro-orbital plexus at 0.25, 0.5, 1, 3, 6, 12, and 24 h after oral administration of atorvastatin into heparinized containers and plasma was separated by centrifugation at 3,000 rpm for 15 min and stored at –20°C till analysis.
Measurement of Plasma Atorvastatin Concentration
To the plasma sample (200 μl), an equal volume of phosphate buffer (pH 7.0) was added and mixed well and then atorvastatin was extracted by liquid–liquid extraction using methanol (1:4 ratio), following which the organic phase was separated, filtered through nylon 0.45-μm syringe filter (Millipore; Millex-HN) and evaporated to dryness at 45°C and then reconstituted in 40 μl of methanol; further, 20 μl of this was injected into the High-Performance Liquid Chromatography (HPLC) system (Shimadzu LC 20AT/SPD-20A detector). Same extraction procedure was applied for the standard samples as well as those to be assayed for pharmacokinetic analysis.[10] The chromatographic column was C-18 (Phenomenex, USA; 100A size 250 × 4.60 mm) coated with 0.5 μ silica gel. The mobile phase used was an isocratic solution of 0.1 mM ammonium acetate: Acetonitrile (50:50), which was filtered through 0.2-μm nylon filter paper (Pall corporation, India). The flow rate was adjusted to 1 ml/min. The peak was detected at 240 nm at 6.5 min after injection.
Stock solutions of atorvastatin were prepared by dissolving it in methanol at a concentration of 500 μg/ml. This solution was diluted with methanol to obtain the working standard solutions in the range of 75-5000 ng/ml. Plasma standards were prepared in the range of 7.5-500 ng/ml by taking 100 μl of working standard solutions in a disposable tube, evaporating to residue by heating at 45°C. To the residue, 1 ml of pooled untreated plasma was added and mixed in a vortex mixer for 30 sec and used for standard curve preparation. Standard curve was prepared from working plasma standards in the range of 7.5-500 ng/ml. After extraction of the drug, standard samples were injected into the HPLC system and peak areas were recorded and plotted against respective known concentrations of plasma atorvastatin to obtain a linear regression line (standard curve).
The concentration of atorvastatin in the plasma samples was determined by using linear regression formula obtained from a standard curve.
Y=a+bx
Concentration (y)=a+b×peak area of the chromatogram
Where, a=Y-intercept of the regression line (standard curve)
b=Slope of the regression line (standard curve)
By substituting the respective peak area of the chromatogram (x value in the above equation), the concentration of atorvastatin in the test plasma sample could be calculated.
Analytical recovery was determined by using two known concentrations of 7.5 and 125 ng/ml of atorvastatin in pooled untreated plasma with the help of standard curve prepared for atorvastatin in a solvent (methanol). Eight determinants were made for each concentration.
The recovery was calculated according to the following formula and found to be 100.32%.
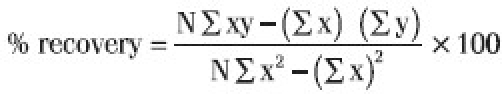
Where, x=known amount of drug added
y=amount of drug found by the assay method
N=number of observations
Intra-day variation was determined by assaying two standard plasma samples (7.5 and 125.0 ng/ml) eight times each in a day. The inter-day variation was determined by assaying two standard plasma samples (7.5 and 125.0 ng/ml) on eight occasions at least 24-h apart. Accuracy on nominal concentration was found to be in the range of 99.1-99.6%.
Pharmacokinetic Analysis
Pharmacokinetic analysis from the concentration-time data of atorvastatin was performed by using built-in pharmacokinetic functions of Microsoft Excel. By using this program, parameters like Cmax, tmax, elimination rate constant, half-life, AUC0-t, AUC0-inf, AUMC0-t, and AUMC0-inf were calculated. Elimination rate constant and half-life were calculated using all terminal concentration-time points from the point of peak concentration.
Css (max) and Css (min) the maximum and minimum plasma concentrations at steady state were calculated by the following equation by substituting respective time points and rate constants.
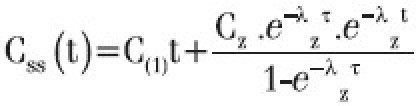
Where C(1)t=Σ Cn. e–λnt
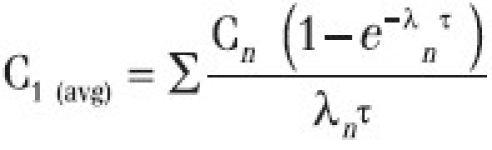
Css(avg) was calculated by the equation=Σ Cn/λnτ
Cn is Y-Intercept, the coefficient of each exponential term
Cz - is Y-Intercept, the coefficient of terminal phase exponential term
τ is the dosing interval
t is the time point
λn is rate constant
λz is elimination rate constant
Accumulation Ratio (R) was calculated based on the average concentration after the first dose and at steady state.
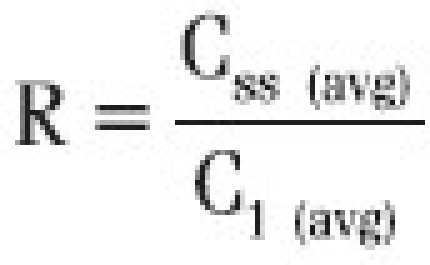
Where, C1 (avg) is average concentration during first dose interval (τ)
Percent fluctuation was calculated based on steady state concentration by the following equation
Swing was calculated based on maximum and minimum steady state concentration by the following equation
The mathematical basis for these functions was from Gibaldi and Perrier.[11]
Assay of CYP450
Liver tissues were collected, after 12 weeks of treatment, in cold conditions perfused with ice-cold 1.15 KCl solution containing 0.05 M EDTA and blotted free of blood and tissue fluid. The tissues were minced and homogenized in 0.25 M sucrose containing 0.05 M Tris buffer (pH 7.4) to prepare 10% homogenate (1 part tissue and 9 parts medium) and the microsomal suspension was prepared.[12] Total CYP450 was assayed on the basis of the principle that the reduced form of CYP450 readily combines with Carbon Monoxide (CO) to form a complex, having an absorption maximum at 450 nm. The difference in the absorption spectrum of CO-treated dithionite-reduced and CO-untreated dithionite-reduced sample is used to determine CYP450, using the extinction coefficient difference of 91 cm–1 mM–1.[13] The experimental protocol was approved by the Institutional Animal Ethics Committee.
Statistical Analysis
Single- and multiple-dose pharmacokinetic data were statistically analyzed by paired t test; steady state pharmacokinetics and other data were analyzed statistically by one-way Analysis of Variance (ANOVA) with Duncan's post-hoc comparison with significance level at 0.05 using Statistical Package for Social Sciences (SPSS) version 15.0.
Results
Plasma Atorvastatin Concentration
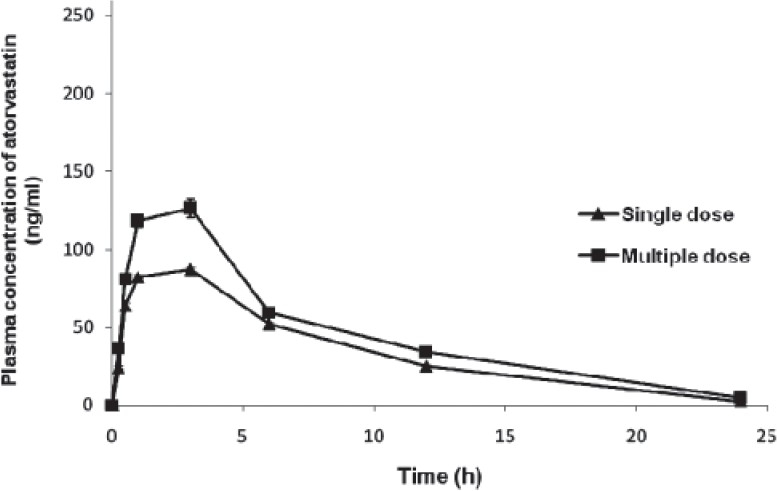
Atorvastatin concentration in the plasma was calculated using calibration curve obtained with working plasma standards and the drug was detectable up to 24 h after administration in all groups [Figures 1–5], except group 5 (2.5 mg/kg dose), in which atorvastatin was detectable up to 12 h after administration. In group 3, the drug was detectable in only two animals during single-dose kinetic study (phase 1) and in all six animals during multiple-dose kinetic study (phase 2) till the end of 24 h reading. In all groups, the concentration of atorvastatin during different time intervals was significantly (P<0.05) higher during multiple-dose kinetic study as compared to that in single-dose kinetic study from the beginning of the experiment, except for group 1 during 1-h and 6-h drug concentrations, where significant (P<0.05) difference between single- and multiple-dose drug concentrations was observed at 3 h, 12 h, and 24 h [Table 1].
Figure 1.

Plasma concentration (group 1)-time curve of atorvastatin on single- and multiple-dose administration in rats
Figure 5.

Plasma concentration (group 5)-time curve of atorvastatin on single- and multiple-dose administration in rats
Table 1.
Plasma concentration of atorvastatin (ng/ml) at different time intervals during single- and multiple-dose PK studies in different groups of rats

Figure 2.
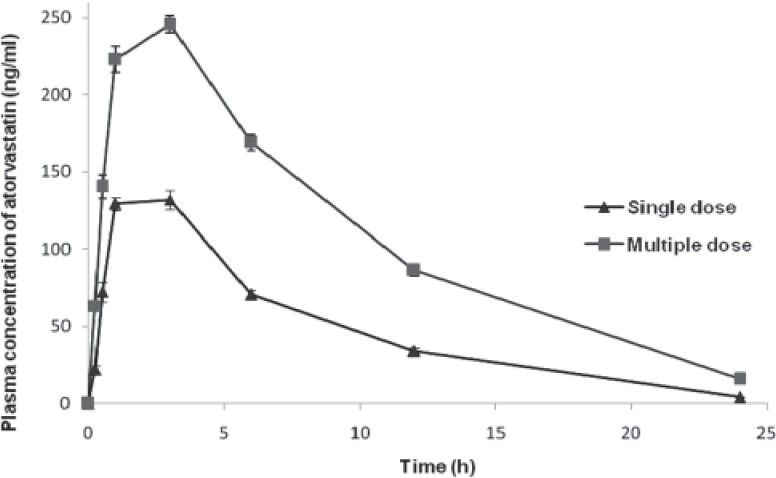
Plasma concentration (group 2)-time curve of atorvastatin on single- and multiple-dose administration in rats
Figure 3.
Plasma concentration (group 3)-time curve of atorvastatin on single- and multiple-dose administration in rats
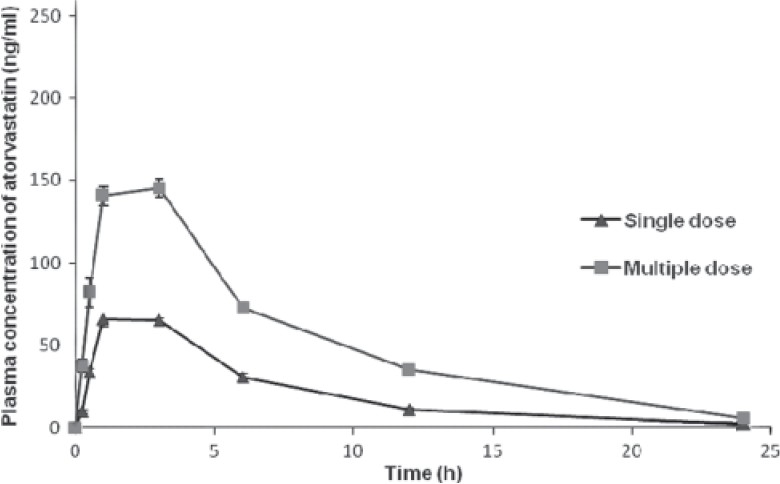
Figure 4.
Plasma concentration (group 4)-time curve of atorvastatin on single- and multiple-dose administration in rats
Cmax and tmax
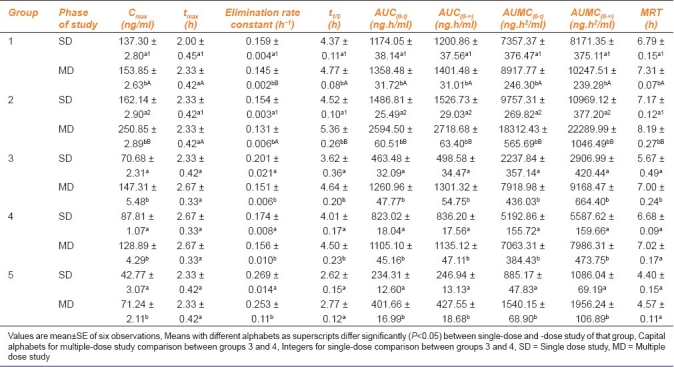
Maximum observed concentration (Cmax) (ng/ml) values of groups 1 through 5 [Figures 1 and 5] during multiple-dose kinetic study (153.85 ± 2.63, 250.85 ± 2.89, 147.31 ± 5.48, 128.89 ± 4.29, and 71.24 ± 2.11, respectively) were significantly (P<0.05) higher than those of their respective single-dose kinetic values. There was no significant difference in time to achieve maximum concentration (tmax) (h) values in all groups during both phases of study. The Cmax value observed during multiple dose study in group 2 was the highest (250.85 ± 2.89) and significantly (P<0.05) higher as compared to its single-dose study value (162.14 ± 2.90) and that of multiple-dose study value of group 1 (atorvastatin control). The highest Cmax value at the end of experiment was found in group 2, followed by that in groups 1 and 3, while the least value was recorded in group 5 followed by group 4.
Elimination Rate Constant
Elimination rate constant (h–1) in all groups showed a significant (P<0.05) decrease during multiple-dose study when compared to their respective values during single-dose study. Elimination rate constant value observed in group 2 during multiple-dose study was the least (0.131 ± 0.006) followed by groups 1, 3, and 4, while group 5 showed the highest elimination rate constant (0.253 ± 0.11). Elimination rate constant observed in group 2 was significantly (P<0.05) lower than that observed in group 1 (atorvastatin control) during multiple-dose study.
Elimination Half-Life, AUC, and AUMC
Elimination half-life (h) observed in group 2 (5.36 ± 0.26) during multiple-dose study was found to be the highest among all groups and significantly (P<0.05) higher than the value observed in group 1 (4.77 ± 0.08). All groups recorded a significant (P<0.05) increase in the half-life during multiple-dose study when compared to their respective single-dose study values. Half-life observed in group 5 was the least, followed by groups 3 and 4. The highest AUC(0-t) (ng.h/ml) and AUC(0-∞) (ng.h/ml) values were observed in group 2 during both phases of the study, followed by groups 1 and 3. The AUC values of all groups were significantly (P<0.05) higher during multiple-dose study when compared to their respective single-dose values. The AUC(0-∞) value observed in group 2 during multiple-dose (2718.68 ± 63.40) studies was significantly (P<0.05) higher than its respective single-dose value (1526.73 ± 29.03) and also higher than the value of group 1 (atorvastatin control) (1401.48 ± 31.01). Similar trend was also observed in AUMC (ng.h2/ml) values, where group 2 showed significantly (P<0.05) higher values when compared to its respective single-dose study and also when compared to group 1 values. Multiple-dose study values of all groups were significantly (P<0.05) higher than their corresponding single-dose study values.
Mean Resident Time
Mean Resident Time (MRT) (h) during multiple-dose study in all groups was significantly (P<0.05) higher when compared to their respective single-dose study value. The highest MRT was noted in group 2 (8.19 ± 0.27) during multiple-dose study followed by groups 1, 4, and 3, while MRT of group 5 (4.57 ± 0.11) was found to be the least. MRT value of group 2 was also significantly (P<0.05) higher than that of group 1 at the end of multiple-dose study (7.31 ± 0.07) [Table 2].
Table 2.
Pharmacokinetic parameters of atorvastatin during single- and multiple-dose study in different groups of rats
Steady State Pharmacokinetics
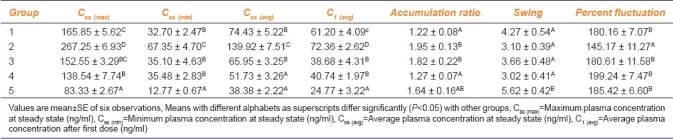
The maximum, minimum, and average plasma atorvastatin concentrations at steady state were significantly (P<0.05) higher in group 2 when compared to other groups. Accumulation ratio of groups 2 and 3 (1.95 ± 0.13 and 1.82 ± 0.22) was significantly (P<0.05) higher and that of group 5 was non-significantly higher when compared to others. Swing (5.62 ± 0.42) was significantly (P<0.05) higher in group 5 when compared to all other groups. Percent fluctuation was significantly (P<0.05) lower in group 2 (145.17 ± 11.27) when compared to all other groups [Table 3].
Table 3.
Pharmacokinetic parameters of atorvastatin during steady state in different groups of rats
Assay of CYP450
The highest activity of CYP450 (nmoles/mg microsomal protein) was seen in groups 1, 4 and 5 (0.156 ± 0.019, 0.147 ± 0.02, and 0.137 ± 0.018, respectively), while groups 2 and 3 showed significantly (P<0.05) lower activity (0.114 ± 0.009 and 0.123 ± 0.008, respectively).
Discussion
Increased Cmax values in all groups in the multiple-dose study with no change in tmax indicated the increased absorption of atorvastatin from the gastrointestinal tract. This can be further supported by decrease in the elimination constant in all groups, thus suggesting that a lesser amount of drug was eliminated per unit time as compared to that in the single-dose study at the beginning of the experiment. This increased the elimination half-lives of all groups in this study. The least elimination rate constant and highest elimination half-life recorded in group 2 can be attributed to a reduced metabolism resulting from inhibitory effect of garlic on CYP3A4, a principal metabolizing enzyme present in intestinal cells and liver. The plasma drug concentration in the course of time, represented by AUC, was also significantly increased in multiple-dose study in all groups, suggesting that a larger amount of drug was present in the body for longer time. The increase in AUC in the groups (2, 3, and 5) that were treated with garlic was more pronounced than that of atorvastatin control (group 1), which indicates the effect of garlic on absorption, metabolism, and elimination of atorvastatin. The garlic-treated groups exhibited up to 2- to 3-fold increase in AUC. The AUC is the pharmacokinetic parameter that gives a direct measure of quantitative and temporal changes in the drug in the body and is useful in understanding the extent of drug exposure by the vital organs of body. The higher values of Cmax, AUC, AUMC, MRT, and half-life in the garlic-treated groups in this study can be correlated with the effect of garlic on inhibition of CYP450, which plays a key role in drug metabolism. It was earlier reported that garlic inhibits CYP3A4 and P-gp[9] with a possible increase in drug concentration in the body. Atorvastatin is extensively metabolized by both intestinal and hepatic CYP3A4 before entering the systemic circulation with a resultant low oral bioavailability.[14,15] Garlic, which has been reported for its inhibitory activity on CYP3A4 and P-gp, may increase the oral availability of atorvastatin due to inhibition of first-pass metabolism with a marked increase in plasma concentrations leading to drug toxicity. In the present study, the concentration of atorvastatin was high in the plasma as evinced by high Cmax, AUC, AUMC, and MRT in the garlic-treated groups. The dose-dependent increase in pharmacokinetic (PK) parameters in this study supports the findings of earlier reports.[16] This effect was further enhanced in garlic-treated groups, which revealed elevated plasma drug concentration possibly due to increased oral absorption and decreased metabolism and elimination. The higher accumulation ratio in groups (2, 3, and 5), which were on high dose of garlic as compared to others, revealed the drug accumulation due to decreased metabolism and elimination with possible increased absorption. The accumulation ratio is used to quantify the extent of accumulation after multiple dosing of any compound relative to its first dose, hence suggesting the possible accumulation of atorvastatin in those receiving its high dose along with garlic (groups 2 and 3). Swing was significantly higher in group 5, which received the least dose of atorvastatin. The relatively lesser swing in plasma concentrations of the groups that received a high dose of garlic and atorvastatin could be attributed to accumulation of drug due to decreased metabolism and elimination with resultant small difference in maximum and minimum plasma concentration at steady state. Percent fluctuation was significantly lower in group 2 (high dose of garlic and atorvastatin) where there were significantly higher maximum, minimum, and average plasma concentrations at steady state when compared to group 1 (high dose of atorvastatin only). From steady state pharmacokinetics it can be concluded that the groups receiving high dose of atorvastatin and garlic (groups 2 and 3) exhibited accumulation of the drug in the body possibly with a decreased metabolism due to inhibition of CYP3A4 by garlic and elimination due to renal damage.[17]
Reddy et al.,[17] reported that the use of atorvastatin at high doses along with garlic resulted in renal damage as described by elevated biomarker levels of renal damage, histopathology, and electron microscopy. This finding can be attributed to elevated atorvastatin concentration with an increase in elimination half-life in groups receiving high dose of atorvastatin along with garlic. Organic Anion Transport Proteins (OATPs) are reported to be responsible for transport of large number of endogenous and xenobiotic compounds across cell membranes. OATP1B transporters are responsible for major hepatic uptake systems for atorvastatin and its metabolites. Inhibition of the hepatic uptake system like OATP1B by potent inhibitors like rifampin has been reported to increase plasma concentration and PK parameters of atorvastatin like AUC, which may result in the toxicity of atorvastatin.[18] Diallyl sulfide present in garlic has been reported to decrease the mouse hepatic OATP expression.[19]
From this study, it is concluded that garlic increased the concentration of atorvastatin and other pharmacokinetic parameters, namely, AUC, AUMC, MRT, and half-life, and also reduced the elimination rate constant, suggesting a synergistic pharmacokinetic profile.
Footnotes
Source of Support: Nil.
Conflict of Interest: None declared.
References
- 1.Mahley RW, Bersot TP. Drug therapy for hypercholesterolemia and dyslipidemia. In: Brunton LL, Lazo JS, Parker KL, editors. Goodman and Gilman's The Pharmacological Basis of Therapeutics. 11th ed. New York, USA: McGraw Hill; 2006. pp. 933–60. [Google Scholar]
- 2.Malhotra HS, Goa KL. Atorvastatin: An updated review of its pharmacological properties and use in dyslipidaemia. Drugs. 2001;61:1835–81. doi: 10.2165/00003495-200161120-00012. [DOI] [PubMed] [Google Scholar]
- 3.Alaupovic P, Heinonen T, Shurzinske L, Black DM. Effect of a new HMG-CoA reductase inhibitor, atorvastatin, on lipids, apolipoproteins and lipoprotein particles in patients with elevated serum cholesterol and triglyceride levels. Atherosclerosis. 1997;133:123–33. doi: 10.1016/s0021-9150(97)00119-6. [DOI] [PubMed] [Google Scholar]
- 4.Reuter HD. Allium sativum and Allium ursinum, part 2: Pharmacology and medicinal applications. Phytomedicine. 1995;2:73–91. doi: 10.1016/S0944-7113(11)80052-8. [DOI] [PubMed] [Google Scholar]
- 5.Augusti KT, Chackery J, Jacob J, Kuriakose S, George S, Nair SS. Beneficial effects of a polar fraction of garlic (Allium sativum Linn) oil in rats fed with two different high fat diets. Indian J Exp Biol. 2005;43:76–83. [PubMed] [Google Scholar]
- 6.Thomson M, Al-Qattan KK, Bordia T, Ali M. Including garlic in the diet may help lower blood glucose, cholesterol, and triglycerides. J Nutr. 2006;136:800S–2. doi: 10.1093/jn/136.3.800S. [DOI] [PubMed] [Google Scholar]
- 7.Lanzotti V. The analysis of onion and garlic. J Chromatogr A. 2006;1112:3–22. doi: 10.1016/j.chroma.2005.12.016. [DOI] [PubMed] [Google Scholar]
- 8.Jani A, Mehta A. Pharmacology of Allium sativum in relation to Cytochrome P450 and possible drug interactions. Pharmacognosy Rev. 2007;2:222–6. [Google Scholar]
- 9.Foster BC, Foster MS, Vandenhoek S, Krantis A, Budzinski JW, Arnason JT, et al. An in vitro evaluation of human cytochrome P450 3A4 and P-glycoprotein inhibition by garlic. J Pharm Pharm Sci. 2001;4:159–67. [PubMed] [Google Scholar]
- 10.Bahrami G, Mohammadi B, Mirzaeei S, Kiani A. Determination of atorvastatin in human serum by reversed-phase high-performance liquid chromatography with UV detection. J Chromatogr B. 2005;826:41–5. doi: 10.1016/j.jchromb.2005.08.008. [DOI] [PubMed] [Google Scholar]
- 11.Gibaldi M, Perrier D. Pharmacokinetics. 2nd ed. New York: Marcel Dekker; 1982. [Google Scholar]
- 12.Hayes W. Principles and Methods of Toxicology. 4th ed. Philadelphia, USA: Taylor and Francis; 2001. p. 1588. [Google Scholar]
- 13.Choi SJ, Kim M, Kim SI, Jeon JK. Microplate assay measurement of cytochrome P450-Carbon monoxide complexes. J Biochem Mol Biol. 2003;36:332–5. doi: 10.5483/bmbrep.2003.36.3.332. [DOI] [PubMed] [Google Scholar]
- 14.Lennernas H, Fager G. Pharmacodynamics and pharmacokinetics of the HMG–CoA reductase inhibitors. Similarities and differences. Clin Pharmacokinetics. 1997;32:403–25. doi: 10.2165/00003088-199732050-00005. [DOI] [PubMed] [Google Scholar]
- 15.Lea AP, McTavish D. Atorvastatin. A review of its pharmacology and therapeutic potential in the management of hyperlipidemias. Drugs. 1997;53:828–47. doi: 10.2165/00003495-199753050-00011. [DOI] [PubMed] [Google Scholar]
- 16.Dostal LA, Whitfield LR, Anderson JA. Fertility and general reproduction studies in rats with the HMG-CoA reductase inhibitor, atorvastatin. Fundam Appl Toxicol. 1996;32:285–92. doi: 10.1006/faat.1996.0132. [DOI] [PubMed] [Google Scholar]
- 17.Reddy GD, Reddy AG, Rao GS, Haritha C, Jyothi K. Interaction study on garlic and atorvastatin with reference to nephrotoxicity in dyslipidaemic rats. Toxicol Int. 2010;17:90–3. doi: 10.4103/0971-6580.72678. [DOI] [PMC free article] [PubMed] [Google Scholar]
- 18.Lau YY, Huang Y, Frassetto L, Benet LZ. Effect of OATP1B transporter inhibition on the pharmacokinetics of atorvastatin in healthy volunteers. Clin Pharmacol Ther. 2007;81:194–204. doi: 10.1038/sj.clpt.6100038. [DOI] [PubMed] [Google Scholar]
- 19.Cheng X, Maher J, Dieter MZ, Klaassen CD. Regulation of mouse organic anion-transporting polypeptides (OATPS) in liver by prototypical microsomal enzyme inducers that activate distinct transcription factor pathways. Drug Metab Dispos. 2005;33:1276–82. doi: 10.1124/dmd.105.003988. [DOI] [PubMed] [Google Scholar]