

Abstract
Purpose
Obesity and physical activity (PA) have been posited as modifiable risk factors to delay lower urinary tract symptom (LUTS) progression. This purpose of this study was to determine the independent associations between PA and obesity with LUTS at follow-up among white and African American men.
Materials and Methods
Male participants aged 40–79 were identified from the Southern Community Cohort Study, a prospective cohort based in the southeastern U.S. Baseline data collection included a validated PA questionnaire, height and weight, health history, and other information. We excluded participants with a history of or medication use for benign prostatic hyperplasia or prostate cancer. Participants (n=7318, 60% African American) completed the International Prostate Symptom Score (IPSS) approximately 5 years after baseline. An IPSS score greater than 8 or 20 were classified as having moderate or severe LUTS, respectively, at follow-up. Multivariable logistic regression was used to assess the relationships between obesity, PA and LUTS.
Results
Moderate to severe LUTS severity at follow-up was significantly associated with a BMI of 35 or more (OR=1.38, 95%CI: 1.17–1.63). Similarly, the lowest categories of PA were associated with severe LUTS onset in men with a normal BMI (OR=1.38, 95%CI: 1.05–1.82). These associations were independent of race.
Conclusions
Severe obesity is associated with increased risk of LUTS at follow-up, while physical inactivity may permit LUTS progression among normal weight men, regardless of race. These variables should be considered in future research into modifiable risk factors for LUTS.
Keywords: Benign prostatic hyperplasia, lower urinary tract symptoms, obesity, physical activity, race
Lower urinary tract symptoms (LUTS) such as decreased force of stream, straining, hesitancy, intermittency, incomplete emptying, dysuria, frequency, nocturia and urgency are among the most common conditions among older men.1 Risk factors for LUTS such as age and race2 are not modifiable, and the wide range of non-prostatic etiologies of LUTS limit the effectiveness of drugs such as finasteride or tamsulosin. As such, researchers have begun to search for modifiable risk factors, including lifestyle factors, associated with the development of LUTS in hopes of identifying behavioral or adjuvant care approaches to prevent or inhibit LUTS progression.
Obesity is one of the more common comorbidities associated with LUTS. Several prior prospective cohort studies have found that BMI, waist circumference (WC), the waist-hip ratio (WHR), or diabetes were associated with more frequent or severe LUTS, 3–5, although others have not.6 Similarly, physical activity was inversely associated with LUTS in several studies7–10, but not others.6, 11 Given the weight of the evidence, it is reasonable to postulate that interventions aimed at reducing obesity or increasing physical activity may reduce LUTS severity. Furthermore, if lifestyle factors such as obesity and physical activity influence LUTS through their effect on steroid hormones, as has been suggested,12 the association between LUTS and obesity or physical activity may also differ with race. To this end, further investigation of the relationship between these potentially modifiable risk factors and LUTS requires studies with adequate minority representation.
The goal of this study was to determine the independent associations between physical activity or obesity (as measured by body-mass index (BMI) with LUTS at follow-up among white and African American men. To achieve this goal, we used data from the Southern Community Cohort Study (SCCS), a large community-based prospective cohort of approximately 86,000 adults, more than two-thirds of whom are African-American, recruited in 12 southern states and followed for an average of nearly 5 years.13
METHODS
SCCS overall study design
A detailed description of the Southern Community Cohort Study (SCCS) has been published previously.13 Briefly, the SCCS is a prospective cohort study designed to study the etiology of several cancers, as well as to elucidate causes of disparities in cancer incidence and mortality across racial and urban/rural groups. The SCCS was approved by IRBs at Vanderbilt University and Meharry Medical College. SCCS enrollment strategies included in-person recruitment from 71 community health centers (CHCs) and a mass-mailing campaign throughout the southeastern United States. To be eligible, participants must have been between 40 and 79 years of age; English-speaking; and not under treatment for cancer within the past year (with the exception of non-melanoma skin cancer).
Data Collection
At the time of enrollment in SCCS, participants completed a baseline survey that focused on demographics, anthropometrics, income, a validated food frequency and physical activity survey,14, 15 disease histories, medications, and a wide range of other potential cancer risk factors. Physical activity assessment included 16 items assessing time spent in sports, household, occupational, and daily living activities. Responses to these 16 items were converted to MET equivalents based on the compendium developed by Ainsworth.15 Information on physical activity and BMI were only collected at baseline. Participants were specifically queried at baseline as to whether they had a history of BPH, an enlarged prostate or prostate cancer.
At an average of approximately five years after their enrollment (range 1.4 to 7.6 years), participants completed a follow-up survey. Men were asked if they had been diagnosed with or received treatment for BPH or prostate cancer since baseline. They also completed the International Prostate Symptom Score (IPSS) to ascertain the presence and severity of LUTS. The IPSS is a validated and reliable questionnaire that is considered the gold standard for assessment of LUTS in men.16 Responses to the 7 IPSS items are summed, and increasing IPSS scores are used to categorize patient symptoms as having none/mild (0 to 7), moderate (8 to 19), or severe (20 to 35) LUTS.17
Inclusion criteria
All male participants who completed a baseline and follow-up survey were initially considered eligible for the current study. Because the analysis was focused on LUTS at follow-up, we excluded, at baseline, any participants who reported a history of prostate cancer or prostatic enlargement or who had reported treatment (medications or surgery) for BPH. We also excluded participants who reported prostate cancer at follow-up or were identified as having prostate cancer from cancer registries or those who partially completed the IPSS at follow-up if they could not be definitively assigned to one of the three LUTS categories.
Defining LUTS at follow-up
Participants who reported an IPSS score of 8 or higher on the follow-up survey were considered to have clinically relevant LUTS. In addition, participants who had IPSS scores of less than 8 at follow-up but reported the initiation of medical or surgical treatment for BPH during the follow-up period were considered to have LUTS at follow-up.
Independent variables
Obesity was determined using baseline assessment of body-mass index (BMI) derived from patient report of height and weight at enrollment. BMI was treated as a categorical variable with 5 levels: <18.5 kg/m2 (underweight), 18.5–24.99 kg/m2 (normal and treated as referent category in statistical analyses), 25–29.99 kg/m2 (overweight), 30–34.99 kg/m2 (obese) and ≥35 kg/m2 (severely obese). Physical activity was initially expressed as total MET hours per day. To enhance the clinical interpretability of this measure, total MET hours of physical activity per day for the cohort were converted to quartiles, with the highest (most active) quartile being treated as the referent category in statistical analysis. Participant age at baseline and length of follow-up were treated as linear variables in the analysis, while health insurance, annual income, highest level of education achieved, race and source of recruitment (CHC vs mass mailing) were all treated as categorical variables in statistical modeling.
Statistical analysis
Descriptive statistics were initially generated for the entire cohort and then by racial group. Multivariable logistic regression was then used to calculate odds ratios (OR) and 95 percent confidence intervals (95% CI) that assessed the independent association of obesity and physical activity with clinically relevant LUTS at follow-up in the study cohort while controlling for age, length of follow-up, source of recruitment, health insurance, annual income, education and race. To study the interaction between the effect of physical activity and obesity on LUTS at follow-up, we then performed a subgroup analysis in which we created a series of multivariate logistic regression models with each model including only men in a particular BMI category. The dependent variable for each of these models was LUTS at follow-up, while the independent variables included physical activity and the other co-variates described above. Finally, we created a multinomial (polychotomous) logistic regression model in which the dependent variable was incident LUTS categorized as either moderate (IPSS: 8–19) or severe (IPSS 20 or higher or treatment for LUTS/BPH). All analyses were conducted using Statistical Analysis System (SAS, version 9.2) software.
RESULTS
The final study cohort consisted of 7318 participants, as depicted in Figure 1. Among these, 2570 were white, 4383 were African-American men, and 365 reported their race as other than white or African-American. Roughly a third of the cohort was obese (BMI>30), and the mean total MET-hours/day of exercise was 24 (table 1). Importantly, 42% of the participants reported moderate/severe LUTS with an IPSS score of greater than 8 or initiation for treatment for BPH at follow-up (table 2). Among the 3042 participants reporting LUTS at follow-up, 63 reported having undergone surgery for BPH (17 white, 39 African-American and 7 other racial groups), 446 reporting initiating medical therapy (158 white, 272 African-American and 16 other) and 2875 reported IPSS scores greater than 7 (902 white, 1855 African-American and 118 other).
Figure 1.
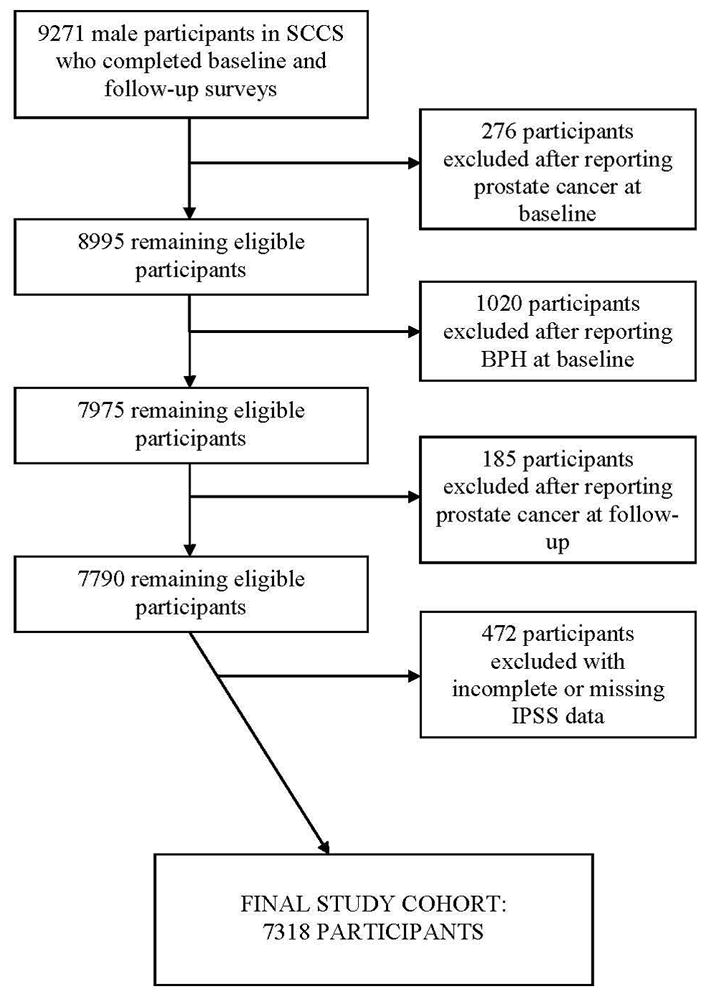
Development of the study cohort
Table 1.
Characteristics of the study population, stratified by race.
| White (n=2570) | Black (n=4383) | All (n=7318) | ||
|---|---|---|---|---|
| Mean (sd) | Mean (sd) | p-value | Mean (sd) | |
| Age (years; mean (s.d.)) | 54.9 (8.4) | 50.7 (7.7) | <0.0001 | 52.3 (8.2) |
|
| ||||
| Physical Activity | ||||
| Total activity (MET-hrs/day) | 22.5 (19.1) | 25.0 (22.1) | <0.0001 | 24.0 (21.0) |
| Moderate and vigorous sports (MET-hrs/day) | 1.8 (3.1) | 1.5 (3.0) | <0.0001 | 1.7 (3.0) |
| Total work activity (MET-hrs/day) | 20.7 (18.6) | 23.5 (21.3) | <0.0001 | 22.4 (20.3) |
| Total sitting time (hrs/day) | 9.5 (4.7) | 9.8 (5.3) | 0.03 | 9.7 (5.1) |
| % | % | % | ||
|
| ||||
| Body mass index (kg/m2) | <0.0001 | |||
| <18.5 | 1% | 1% | 1% | |
| 18.5–24.99 | 24% | 30% | 28% | |
| 25–29.99 | 40% | 35% | 37% | |
| 30–34.99 | 22% | 20% | 21% | |
| 35+ | 12% | 13% | 13% | |
| Unknown | 1% | 1% | 1% | |
|
| ||||
| IPSS score at follow-up | <0.0001 | |||
| Mild or no symptoms (0–7) | 63% | 55% | 58% | |
| Moderate symptoms (8–19) | 24% | 29% | 27% | |
| Severe symptoms (20–35) | 13% | 16% | 15% | |
|
| ||||
| Education completed | <0.0001 | |||
| <9 years | 6% | 7% | 6% | |
| 9–11 years | 9% | 20% | 16% | |
| High school or equivalent | 29% | 41% | 36% | |
| Some or junior college | 20% | 20% | 20% | |
| College graduate | 37% | 12% | 21% | |
| Unknown | 0% | 0% | 1% | |
|
| ||||
| Total household income | <0.0001 | |||
| <$15,000 per year | 27% | 53% | 42% | |
| $15,000 – $24,999 | 13% | 23% | 19% | |
| $25,000 – $49,999 | 19% | 14% | 16% | |
| $50,000+ | 39% | 9% | 21% | |
| Unknown | 2% | 1% | 2% | |
|
| ||||
| Health insurance | <0.0001 | |||
| Medicare | 23% | 18% | 20% | |
| Medicaid | 5% | 12% | 9% | |
| Military | 6% | 5% | 5% | |
| Private | 42% | 22% | 30% | |
| Other | 1% | 2% | 1% | |
| None | 22% | 41% | 33% | |
| Unknown | 1% | 1% | 1% | |
|
| ||||
| % enrolled at a CHC | 45% | 86% | <0.0001 | 70% |
Table 2.
LUTS at follow-up outcome stratified by various sociodemographic and clinical factors.
| Category | No LUTS at Follow-up | LUTS at Follow-up | p value |
|---|---|---|---|
| Total | 4276 (58%) | 3042 (42%) | - |
|
| |||
| Race | <0.0001 | ||
| White | 1617 (63%) | 953 (37%) | |
| African-American | 2421 (55%) | 1962 (45%) | |
| Other | 238 (65%) | 127 (35%) | |
|
| |||
| Body mass index (kg/m2) | 0.0004 | ||
| <18.5 | 40 (55%) | 33 (45%) | |
| 18.5–24.99 | 1209 (59%) | 837 (41%) | |
| 25–29.99 | 1584 (59%) | 1107 (41%) | |
| 30–34.99 | 920 (61%) | 592 (39%) | |
| 35+ | 488 (52%) | 454 (48%) | |
| Unknown | 35 (65%) | 19 (35%) | |
|
| |||
| Education completed | <0.0001 | ||
| <9 years | 223 (47%) | 247 (53%) | |
| 9–11 years | 553 (49%) | 581 (51%) | |
| High school or equivalent | 1516 (58%) | 1116 (42%) | |
| Some or junior college | 854 (60%) | 573 (40%) | |
| College graduate | 1059 (68%) | 494 (32%) | |
| Unknown | 71 (70%) | 31 (30%) | |
|
| |||
| Total household income | <0.0001 | ||
| <$15,000 per year | 1569 (50%) | 1541 (50%) | |
| $15,000 – $24,999 | 765 (55%) | 618 (45%) | |
| $25,000 – $49,999 | 776 (65%) | 413 (35%) | |
| $50,000+ | 1087 (72%) | 421 (28%) | |
| Unknown | 79 (62%) | 49 (38%) | |
|
| |||
| Health insurance | <0.0001 | ||
| Medicare | 746 (51%) | 717 (49%) | |
| Medicaid | 329 (49%) | 340 (51%) | |
| Military | 249 (62%) | 151 (38%) | |
| Private | 1520 (69%) | 673 (31%) | |
| Other | 57 (56%) | 44 (44%) | |
| None | 1344 (55%) | 1085 (45%) | |
| Unknown | 31 (49%) | 32 (51%) | |
|
| |||
| Enrolled at a CHC | <0.0001 | ||
| no | 1545 (70%) | 674 (30%) | |
| yes | 2731 (54%) | 2368 (46%) | |
The associations between obesity, physical activity, and LUTS at follow-up are summarized in Table 3. Compared to men with a BMI of 18.5–24.9 kg/m2, a BMI of 35 or more was significantly associated with a 38% increased risk of incident LUTS (OR=1.38, 95% CI:1.17–1.63). Furthermore, severe obesity was significantly associated with LUTS onset within white and African-American men. Overweight (BMI=25.0–29.9) was also significantly associated with LUTS among white men, although a test for interaction between race and BMI was not significant (p=0.41). A similar analysis on physical activity and LUTS (Table 3) found a marginally significant increased risk in LUTS associated only with the lowest physical activity level among all participants (OR=1.16, 95%CI: 1.00–1.34), whites (OR=1.26, 95%CI:0.96–1.64), and African-Americans (OR=1.11, 95%CI:0.93–1.33). These patterns and associations did not substantially change using models that additionally controlled for BMI or physical activity.
Table 3.
The relationship of obesity, physical activity, and LUTS in the SCCS; stratified by race/ethnicity.
| Incident LUTS (IPSS>8)* | Incident LUTS (IPSS > 8)** | All*** | |||||||
|---|---|---|---|---|---|---|---|---|---|
| All # | White | African-American | All# | White | African-American | Moderate LUTS (IPSS=8–19) | Severe LUTS (IPSS=20–35) | ||
| Variable | Category | OR (95% CI) | OR (95% CI) | OR (95% CI) | OR (95% CI) | OR (95% CI) | OR (95% CI) | OR (95% CI) | OR (95% CI) |
| BMI kg/m2 | 35+ | 1.38 (1.17–1.63) | 1.37 (1.03–1.85) | 1.33 (1.08–1.63) | 1.34 (1.13–1.58) | 1.33 (0.98–1.80) | 1.29 (1.05–1.59) | 1.27 (1.05–1.53) | 1.44 (1.15–1.81) |
| 30–34.9 | 1.04 (0.90–1.20) | 1.23 (0.96–1.58) | 0.95 (0.79–1.14) | 1.05 (0.91–1.22) | 1.24 (0.96–1.60) | 0.97 (0.81–1.17) | 1.00 (0.84–1.18) | 1.17 (0.95–1.44) | |
| 25–29.9 | 1.12 (0.99–1.27) | 1.26 (1.01–1.57) | 1.07 (0.92–1.25) | 1.13 (1.00–1.28) | 1.29 (1.02–1.61) | 1.07 (0.92–1.26) | 1.15 (1.00–1.33) | 1.12 (0.93–1.34) | |
| 18.5 – 24.9 | 1.00 (referent) | 1.00 (referent) | 1.00 (referent) | 1.00 (referent) | 1.00 (referent) | 1.00 (referent) | 1.00 (referent) | 1.00 (referent) | |
| <18.5 | 1.09 (0.67–1.77) | 1.80 (0.69–4.73) | 0.76 (0.42–1.38) | 0.99 (0.60–1.62) | 1.64 (0.61–4.42) | 0.69 (0.38–1.27) | 1.00 (0.57–1.76) | 0.97 (0.48–1.94) | |
| PA (met- hours/day) | Q1 (low) | 1.16 (0.99–1.34) | 1.26 (0.96–1.64) | 1.11 (0.93–1.33) | 1.14(0.99–1.32) | 1.22 (0.93–1.60) | 1.11 (0.93–1.34) | 1.10 (0.94–1.30) | 1.38 (1.12–1.69) |
| Q2 | 0.97 (0.84–1.12) | 1.17 (0.90–1.52) | 0.86 (0.73–1.06) | 0.96 (0.83–1.11) | 1.16 (0.89–1.50) | 0.88 (0.73–1.05) | 0.94 (0.80–1.11) | 1.10 (0.89–1.37) | |
| Q3 | 1.04 (0.90–1.20) | 1.09 (0.84–1.41) | 1.02 (0.85–1.22) | 1.04 (0.90–1.20) | 1.07 (0.83–1.39) | 1.03 (0.86–1.24) | 1.04 (0.87–1.23) | 1.08 (0.87–1.34) | |
| Q4 (high) | 1.00 (referent) | 1.00 (referent) | 1.00 (referent) | 1.00 (referent) | 1.00 (referent) | 1.00 (referent) | 1.00 (referent) | 1.00 (referent) | |
Odds ratios and 95% confidence intervals, adjusted for age, health insurance status, length of follow-up, education, income, and source of referral.
includes white, African-American, and ‘Other’ participants, and analyses adjust for race/ethnicity.
also controls for physical activity or BMI, as appropriate
Multinomial logistic regression controlling for age, race, health insurance status, length of follow-up, education, income, source of referral, and BMI or physical activity level (Met-hours/day)
We used multinomial logistic regression to determine if physical activity and/or obesity were associated with moderate LUTS or severe LUTS at follow-up. As shown in table 3, a BMI of 35 or was significantly with moderate LUTS and severe LUTS, with a stronger association for severe LUTS (OR=1.44, 95%CI: 1.15–1.81). Furthermore, participants in the lowest physical activity category were significantly more likely to report severe LUTS (OR=1.38, 95%CI:1.12–1.69).
To separate the relationships between BMI and physical activity, we explored the association of physical activity and LUTS within defined categories of BMI (Table 4). Physical activity was not significantly associated with LUTS among overweight, obese or severely obese men. However, the lowest level of physical activity was significantly associated with incident LUTS (OR=1.38 95% CI: 1.05–1.82) among men with a normal BMI (18.5–24.9 kg/m2).
Table 4.
The relationship of physical activity and LUTS at follow-up in the SCCS, within each BMI category.
| BMI Category | ||||
|---|---|---|---|---|
| 18.5–24.9 (n=2046) | 25.0–29.9 (n=2691) | 30.0–34.9 (n=1512) | ≥ 35.0 (n=942) | |
| PA quartile | OR (95% CI) | OR (95% CI) | OR (95% CI) | OR (95% CI) |
| Q1 (low) | 1.38 (1.05–1.82) | 0.99 (0.77–1.26) | 1.09 (0.79–1.52) | 1.20 (0.79–1.81) |
| Q2 | 0.87 (0.66–1.15) | 1.11 (0.87–1.42) | 1.03 (0.74–1.43) | 0.72 (0.47–1.09) |
| Q3 | 0.99 (0.76–1.19) | 1.04 (0.82–1.31) | 1.12 (0.81–1.55) | 0.99 (0.64–1.54) |
| Q4 (high) | 1.0 (ref) | 1.0 (ref) | 1.0 (ref) | 1.0 (ref) |
All models are adjusted for age, race, health insurance status, length of follow-up, education, income, and source
DISCUSSION
Primary prevention of LUTS by modifying potential risk factors is a laudable goal that could ultimately lessen the economic and public health burden of this common condition.18 Data from the SCCS indicate that severely obese participants were significantly more likely to report LUTS at follow-up after controlling for physical activity and other sociodemographic variables. The association between severe obesity and LUTS was noted in both white and African-American participants.
A number of previous epidemiological studies report greater LUTS severity associated with obesity. For example, a cross-sectional analysis from the National Health and Nutrition Examination Survey (NHANES)5 reported LUTS severity tended to increase with a BMI of 25 or higher after age 60 years. Not surprisingly, larger waist circumference was also associated with increased risk of LUTS, consistent with earlier findings from the Health Professionals Follow-up Study.19 In contrast, other studies have failed to document a relationship between obesity and LUTS20–22. Reasons for heterogeneous results from prior studies are unclear, but may involve different methods of measuring LUTS onset, or differences in risk factor profiles across different populations. Additionally, we found an association only with a BMI > 35, particularly for the most severe LUTS, and studies within leaner populations or more moderate LUTS severity may not be adequately powered to identify this association. The racial diversity of the SCCS cohort may also explain why the current study differs from prior studies that have failed to show a relationship between obesity and LUTS.
Similar to obesity, the literature addressing physical activity and LUTS is also inconsistent. Parsons and Kashefi10 performed a systematic review and meta-analysis on this topic using 11 observational studies that included 43,083 participants. Eight studies noted an inverse relationship between physical activity and LUTS, while two showed no relationship and 1 was equivocal. After pooling the data, the ORs for LUTS were 0.70, 0.74 and 0.74 for the light, moderate and heavy physical activity groups, respectively, compared to the sedentary group. This is remarkably similar to our findings in that the greatest risk of LUTS was in the sedentary group. Our study has the advantage, however, of having clear and consistent definitions of physical activity, being ethnically diverse and controlling for obesity. We found that the potential benefit of increased physical activity may not be applicable to all men at risk for LUTS, but rather only those with normal BMI. Among these men (with BMI 18.5–24.9), a rise in LUTS risk was seen only for those in the lowest, and not middle, quartiles of physical activity, suggesting that even modest gains in physical activity such as walking may provide a benefit for the most physically inactive. These data thus provide a basis for more personalized behavioral strategies to maximize the benefits on LUTS reduction across men at risk for progression. Further studies are needed to determine if physical inactivity could be a potentially modifiable risk factor for LUTS in normal weight men.
The underlying physiological mechanisms that explain the relationship between obesity or physical activity with LUTS are unclear. Adiopose tissue expresses aromatase, responsible for the conversion of androgens to estrogens, suggesting obesity may mediate LUTS through alterations in sex steroid levels.12 Adipocytes also mediates the release of cytokines that affect the inflammatory response, and some have hypothesized that obesity or another component of the metabolic syndrome mediates LUTS through an increase in systemic inflammation or oxidative stress.12,23 Not only is inflammation been found to be associated with surgical specimens of BPH,24 but the degree and severity of inflammation correlates with prostate enlargement.25 Physical activity, by contrast, was associated with LUTS severity among normal weight men, suggesting a mechanism independent of body adiposity. Improved insulin sensitivity may be one relevant mechanism26, but clearly additional research is needed to better understand the physiologic mechanism of the relationship between obesity, physical activity, and LUTS.
While our study has numerous strengths, including the use of a large racially and socioeconomically diverse cohort, prospective data collection, and the use of validated and reliable surveys to assess physical activity and LUTS, its limitations should be noted. Specifically, the analysis was limited by the lack of IPSS scores at baseline. Although we excluded men who had a history of prostate cancer, reported having been told that they had BPH and/or an “enlarged prostate,” or were receiving treatment for LUTS/BPH at baseline, it is likely that some of the participants in the study had LUTS at baseline and this could potentially be related to baseline BMI or physical activity. The risk of undetected LUTS at baseline may also be more pronounced among patients who started medical therapy or underwent surgery for BPH during the study period. As such, it is likely that the rate of LUTS at follow-up in the study cohort may be somewhat greater than the true rate of incident LUTS among participants. Furthermore, given the lack of baseline IPSS scores, the results from the multinomial regression model should be interpreted with caution, as I-PSS scores are known to vary over time and men may drift into and out of symptom strata.17 Acknowledging this, it is highly unlikely that the rate of LUTS underreporting at baseline is associated with either obesity or physical activity and, therefore, the estimates of relative risk, which are the key findings of the study, should not be biased by this limitation.
In summary, results from the SCCS indicate that severe obesity and low levels of physical activity among non-obese men are associated with increased risk of LUTS. While further research is needed, obesity may be a modifiable LUTS risk factor regardless of race/ethnicity while increasing physical activity may reduce LUTS severity among normal weight men.
Acknowledgments
Source of Funding: Grant numbers RO1CA092447 and N01-DK-7-0003 from the National Institutes of Health and the Urologic Diseases of America Project.
Key of Definitions for Abbreviations
- PA
physical activity
- LUTS
lower urinary tract symptoms
- IPSS
International Prostate Symptom Score
- BMI
Body-Mass Index
- SCCS
Southern Community Cohort Study
- CHC
Community Health Center
- BPH
Benign Prostatic Hyperplasia
- MET
metabolic equivalent of task
- OR
odds ratio
Footnotes
Publisher's Disclaimer: This is a PDF file of an unedited manuscript that has been accepted for publication. As a service to our customers we are providing this early version of the manuscript. The manuscript will undergo copyediting, typesetting, and review of the resulting proof before it is published in its final citable form. Please note that during the production process errors may be discovered which could affect the content, and all legal disclaimers that apply to the journal pertain.
References
- 1.Platz EA, Smit E, Curhan GC, Nyberg LM, Giovannucci E. Prevalence of and racial/ethnic variation in lower urinary tract symptoms and noncancer prostate surgery in U.S. men. Urology. 2002;59:877. doi: 10.1016/s0090-4295(01)01673-9. [DOI] [PubMed] [Google Scholar]
- 2.Sarma AV, Wei JT, Jacobson DJ, Dunn RL, Roberts RO, Girman CJ, et al. Comparison of lower urinary tract symptom severity and associated bother between community-dwelling black and white men: the Olmsted County Study of Urinary Symptoms and Health Status and the Flint Men’s Health Study. Urology. 2003;61:1086. doi: 10.1016/s0090-4295(03)00154-7. [DOI] [PubMed] [Google Scholar]
- 3.Hammarsten J, Hogstedt B. Clinical, anthropometric, metabolic and insulin profile of men with fast annual growth rates of benign prostatic hyperplasia. Blood Press. 1999;8:29. doi: 10.1080/080370599438365. [DOI] [PubMed] [Google Scholar]
- 4.Zucchetto A, Tavani A, Dal Maso L, Gallus S, Negri E, Talamini R, et al. History of weight and obesity through life and risk of benign prostatic hyperplasia. Int J Obes (Lond) 2005;29:798. doi: 10.1038/sj.ijo.0802979. [DOI] [PubMed] [Google Scholar]
- 5.Rohrmann S, Smit E, Giovannucci E, Platz EA. Associations of obesity with lower urinary tract symptoms and noncancer prostate surgery in the Third National Health and Nutrition Examination Survey. Am J Epidemiol. 2004;159:390. doi: 10.1093/aje/kwh060. [DOI] [PubMed] [Google Scholar]
- 6.Fritschi L, Tabrizi J, Leavy J, Ambrosini G, Timperio A. Risk factors for surgically treated benign prostatic hyperplasia in Western Australia. Public Health. 2007;121:781. doi: 10.1016/j.puhe.2007.01.011. [DOI] [PubMed] [Google Scholar]
- 7.Hong J, Kwon S, Yoon H, Lee H, Lee B, Kim HH, et al. Risk factors for benign prostatic hyperplasia in South Korean men. Urol Int. 2006;76:11. doi: 10.1159/000089729. [DOI] [PubMed] [Google Scholar]
- 8.Meigs JB, Mohr B, Barry MJ, Collins MM, McKinlay JB. Risk factors for clinical benign prostatic hyperplasia in a community-based population of healthy aging men. J Clin Epidemiol. 2001;54:935. doi: 10.1016/s0895-4356(01)00351-1. [DOI] [PubMed] [Google Scholar]
- 9.Lagiou A, Samoli E, Georgila C, Minaki P, Barbouni A, Tzonou A, et al. Occupational physical activity in relation with prostate cancer and benign prostatic hyperplasia. Eur J Cancer Prev. 2008;17:336. doi: 10.1097/CEJ.0b013e3282f5221e. [DOI] [PubMed] [Google Scholar]
- 10.Parsons JK, Kashefi C. Physical activity, benign prostatic hyperplasia, and lower urinary tract symptoms. Eur Urol. 2008;53:1228. doi: 10.1016/j.eururo.2008.02.019. [DOI] [PubMed] [Google Scholar]
- 11.Kristal AR, Arnold KB, Schenk JM, Neuhouser ML, Weiss N, Goodman P, et al. Race/ethnicity, obesity, health related behaviors and the risk of symptomatic benign prostatic hyperplasia: results from the prostate cancer prevention trial. J Urol. 2007;177:1395. doi: 10.1016/j.juro.2006.11.065. [DOI] [PubMed] [Google Scholar]
- 12.Parsons JK, Sarma AV, McVary K, Wei JT. Obesity and benign prostatic hyperplasia: clinical connections, emerging etiological paradigms and future directions. J Urol. 2009;182:S27. doi: 10.1016/j.juro.2009.07.086. [DOI] [PubMed] [Google Scholar]
- 13.Signorello LB, Hargreaves MK, Blot WJ. The Southern Community Cohort Study: investigating health disparities. J Health Care Poor Underserved. 21:26. doi: 10.1353/hpu.0.0245. [DOI] [PMC free article] [PubMed] [Google Scholar]
- 14.Signorello LB, Buchowski MS, Cai Q, Munro HM, Hargreaves MK, Blot WJ. Biochemical validation of food frequency questionnaire-estimated carotenoid, alpha-tocopherol, and folate intakes among African Americans and non-Hispanic Whites in the Southern Community Cohort Study. Am J Epidemiol. 171:488. doi: 10.1093/aje/kwp402. [DOI] [PMC free article] [PubMed] [Google Scholar]
- 15.Ainsworth BE, Haskell WL, Leon AS, Jacobs DR, Jr, Montoye HJ, Sallis JF, et al. Compendium of physical activities: classification of energy costs of human physical activities. Med Sci Sports Exerc. 1993;25:71. doi: 10.1249/00005768-199301000-00011. [DOI] [PubMed] [Google Scholar]
- 16.Barry MJ, Fowler FJ, Jr, MP OL, Bruskewitz RC, Holtgrewe HL, Mebust WK, et al. The American Urological Association symptom index for benign prostatic hyperplasia. The Measurement Committee of the American Urological Association. J Urol. 1992;148:1549. doi: 10.1016/s0022-5347(17)36966-5. [DOI] [PubMed] [Google Scholar]
- 17.Barry MJ, Fowler FJ, Jr, MP OL, Bruskewitz RC, Holtgrewe HL, Mebust WK. Measuring disease-specific health status in men with benign prostatic hyperplasia. Measurement Committee of The American Urological Association. Med Care. 1995;33:AS145. [PubMed] [Google Scholar]
- 18.Wei JT, Calhoun E, Jacobsen SJ. Urologic diseases in America project: benign prostatic hyperplasia. J Urol. 2005;173:1256. doi: 10.1097/01.ju.0000155709.37840.fe. [DOI] [PubMed] [Google Scholar]
- 19.Giovannucci E, Rimm EB, Chute CG, Kawachi I, Colditz GA, Stampfer MJ, et al. Obesity and benign prostatic hyperplasia. Am J Epidemiol. 1994;140:989. doi: 10.1093/oxfordjournals.aje.a117206. [DOI] [PubMed] [Google Scholar]
- 20.Haidinger G, Temml C, Schatzl G, Brossner C, Roehlich M, Schmidbauer CP, et al. Risk factors for lower urinary tract symptoms in elderly men. For the Prostate Study Group of the Austrian Society of Urology. Eur Urol. 2000;37:413. doi: 10.1159/000020162. [DOI] [PubMed] [Google Scholar]
- 21.Joseph MA, Harlow SD, Wei JT, Sarma AV, Dunn RL, Taylor JM, et al. Risk factors for lower urinary tract symptoms in a population-based sample of African-American men. Am J Epidemiol. 2003;157:906. doi: 10.1093/aje/kwg051. [DOI] [PubMed] [Google Scholar]
- 22.Wong SY, Woo J, Hong A, Leung JC, Kwok T, Leung PC. Risk factors for lower urinary tract symptoms in southern Chinese men. Urology. 2006;68:1009. doi: 10.1016/j.urology.2006.05.039. [DOI] [PubMed] [Google Scholar]
- 23.Furukawa S, Fujita T, Shimabukuro M, Iwaki M, Yamada Y, Nakajima Y, et al. Increased oxidative stress in obesity and its impact on metabolic syndrome. J Clin Invest. 2004;114:1752. doi: 10.1172/JCI21625. [DOI] [PMC free article] [PubMed] [Google Scholar]
- 24.Nickel JC, Downey J, Young I, Boag S. Asymptomatic inflammation and/or infection in benign prostatic hyperplasia. BJU Int. 1999;84:976. doi: 10.1046/j.1464-410x.1999.00352.x. [DOI] [PubMed] [Google Scholar]
- 25.Di Silverio F, Gentile V, De Matteis A, Mariotti G, Giuseppe V, Luigi PA, et al. Distribution of inflammation, pre-malignant lesions, incidental carcinoma in histologically confirmed benign prostatic hyperplasia: a retrospective analysis. Eur Urol. 2003;43:164. doi: 10.1016/s0302-2838(02)00548-1. [DOI] [PubMed] [Google Scholar]
- 26.Ford ES. Does exercise reduce inflammation? Physical activity and C-reactive protein among U.S. adults. Epidemiology. 2002;13:561. doi: 10.1097/00001648-200209000-00012. [DOI] [PubMed] [Google Scholar]