Abstract
Major histocompatibility complex class I-restricted CD8+ cytotoxic T lymphocytes are involved in the pathogenesis of multiple sclerosis (MS) and both autoimmune, experimental autoimmune encephalomyelitis, and viral, Theiler’s murine encephalomyelitis virus (TMEV) infection, animal models of MS. Following TMEV infection, certain T cell hybridomas, generated from cloned TMEV-induced CD8+ T cells, were able to produce clinical signs of disease (flaccid hind limb paralysis) upon adoptive transfer into naive mice. Dual T cell receptors (TCR) are present on the surface of these cells as both Vβ3 and Vβ6 were detected by polymerase chain reaction (PCR) screening and flow cytometry and multiple Vα mRNAs were detected by PCR screening. This is the first demonstration of antiviral CD8+ T cells having more than one TCR initiating an autoimmune disease in the natural host of the virus. We hypothesize that this is a potential mechanism for virus-induced autoimmune disease initiated by CD8+ T cells.
Keywords: Multiple sclerosis, Theiler’s murine encephalomyelitis virus, Autoimmune, CD8+ cytotoxic T lymphocytes, Hybridomas, Dual T cell receptor, Adoptive transfer
Introduction
Multiple sclerosis (MS) is a common inflammatory, demyelinating disease of the central nervous system (CNS) of humans. Although the cause of MS is unknown, both organ-specific autoimmune responses and viral infections are thought to play important roles. As such, there are both autoimmune, experimental autoimmune encephalomyelitis (EAE), and viral, Theiler’s murine encephalomyelitis virus (TMEV) infection, animal models of MS [reviewed in (Tsunoda and Fujinami 1996)]. Inflammatory demyelinating disease can be induced in EAE models through the administration of CNS proteins or peptides in adjuvant. A key feature demonstrating the autoimmune nature of EAE is through the adoptive transfer of myelin-specific T cells into naive animals resulting in CNS inflammation and demyelination with clinical disease. Intracerebral infection of susceptible strains of mice (SJL/J) with viruses from the less neurovirulent Theiler’s Original subgroup, such as the Daniels (DA) strain, results in an inflammatory demyelinating disease, with chronic viral infection developing about 1 month postinfection.
In MS and two of the animal models (EAE and TMEV), autoreactive major histocompatibility complex (MHC) class II-restricted CD4+ T cells are involved as effector cells mediating disease [reviewed in (Tsunoda and Fujinami 1996)]. However, in addition to the CD4+ T cells, MHC class I-restricted CD8+ T cells are also involved in pathogenesis. Both an association with MHC class I alleles and the expression of MHC class I molecules in the brain have been demonstrated in MS [reviewed in (Friese and Fugger 2005)]. Also, CD8+ T cells are found in significant numbers in MS lesions (Hayashi et al. 1988; McCallum et al. 1987; Sobel 1989) and actually outnumber the CD4+ T cells in active lesions (Babbé et al. 2000). In EAE, CD8+ suppressor T cells are thought to influence/regulate the pathogenicity of the disease (Ofosu-Appiah and Mokhtarian 1991; Sun et al. 1988; Weiner et al. 1994). More recently, an effector role for CD8+ T cells in EAE has been suggested based on the ability of adoptively transferred myelin-specific CD8+ cytotoxic T lymphocytes (CTL) to mediate CNS disease (Huseby et al. 2001; Sun et al. 2001). In TMEV, resistance to chronic infection maps genetically to the MHC class I H-2D locus (Clatch et al. 1985; Rodriguez et al. 1986) and MHC class I-restricted viral capsid-specific CD8+ CTL have been found in the CNS of TMEV-infected mice resistant to the development of the TMEV-induced demyelinating disease (Lin et al. 1995, 1997), indicating the importance of CD8+ CTL in viral clearance. In addition, the CD4/CD8 ratio in the CNS of TMEV-infected mice was lower than the ratio in the peripheral blood, indicating preferential infiltration of CD8+ T cells into the CNS (Tsunoda et al. 1996). Evidence supporting an effector role of CD8+ T cells in TMEV-induced demyelination includes parenchymal infiltration of these cells during chronic infection (Lindsley and Rodriguez 1989) and a decrease in demyelination upon infection of mice depleted of these cells (Rodriguez and Sriram 1988).
One possible scenario for the initiation and/or exacerbations of MS is that peripheral viral infections occurring outside of the CNS could start an immune response down the pathway which leads to CNS inflammation and demyelinating disease. To test this hypothesis, we previously found that peripheral infection of SJL/J mice with DA generated anti-DA-reactive CD8+ Tcells that could kill both infected and uninfected target cells (Tsunoda et al. 2002). Transfer of these antiviral and autoreactive CD8+ T cells could induce CNS inflammatory changes in naive mice. In subsequent studies, we demonstrated that cloned antiviral and autoreactive CD8+ T cells could kill both infected and uninfected target cells and also induce inflammatory changes such as perivascular infiltration and demyelination when transferred into naive mice (Tsunoda et al. 2005). T cell hybridomas were made from the cloned antiviral and autoreactive CD8+ T cells that produced interferon-γ upon co-culture with DA-infected or uninfected syngeneic target cells (Tsunoda et al. 2008).
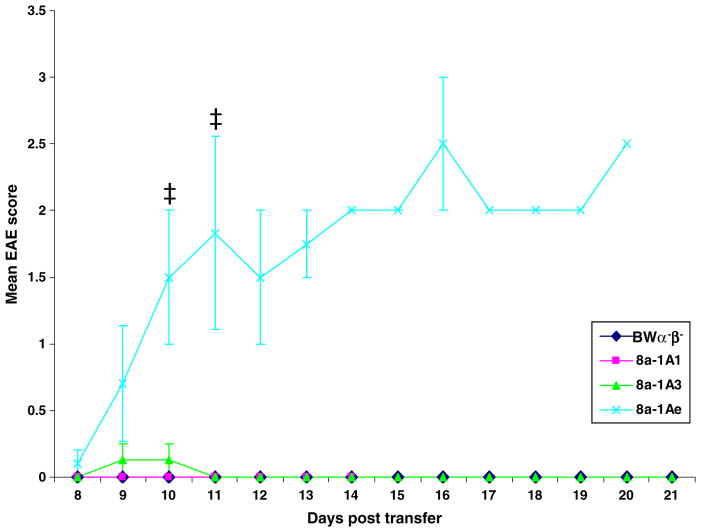
In the present study, we extended our initial characterization of the antiviral CD8+ T cell clones/hybridomas. We discovered that certain, but not all, hybridomas induced flaccid hind limb paralysis (clinical signs of disease) in the recipient mice following adoptive transfer. Inflammatory changes, such as cell infiltration, were evident in the brains in these mice. Three hybridomas, 8a-1A1, 8a-1A3, and 8a-1Ae, were chosen for further examination, since the 8a-1Ae hybridoma caused paralysis while the 8a-1A1 and 8a-1A3 hybridomas did not. Recipient mice receiving the 8a-1A1, 8a-1A3, and 8a-1Ae cells were scored for disease and the mean EAE scores correlated with the observed paralysis.
To explore a potential mechanism to explain how CD8+ T cells generated after viral infection could cause disease in naive mice, polymerase chain reaction (PCR) screening was used to determine which T cell receptor (TCR) Vα and Vβ mRNAs were expressed within the cells. In addition, flow cytometry was used to detect which TCR Vβ chains were present on the surface of the CD8+ T cells. Both PCR screening and flow cytometry detected Vβ3 and Vβ6 in/on the 8a-1A parental clone and the 8a-1A1, 8a-1A3, and 8a-1Ae cells. Multiple Vα mRNAs were detected, by PCR screening, within the 8a-1A parental clone and the 8a-1A1, 8a-1A3, and 8a-1Ae cells, suggesting the presence of dual TCRs on the cell surface of these clones/hybridomas.
Therefore in this study, we have demonstrated that TMEV infection of the mouse, its natural host, induces CD8+ T cells that have more than one TCR. Such virus-induced CD8+ T cells having multiple TCRs may be one mechanism involved in the development of CNS autoimmune disease.
Materials and methods
Animals
Female SJL/J mice were purchased from the Jackson Laboratory (Bar Harbor, ME). The care and use of the above-mentioned mice were in accordance with the guidelines prepared by the committee on Care and Use of Laboratory Animals, Institute of Laboratory Animals Resources, National Research Council.
Cell growth
T cell clones were grown, for flow cytometry, in RPMI 1640 media (Mediatech, Herndon, VA) containing 10% Cosmic Calf serum (Hyclone, Logan, UT), 2 mM L-glutamine (Mediatech), 10 mM HEPES (Invitrogen, San Diego, CA), 1 mM sodium pyruvate (Mediatech), 50 μM β-mercaptoethanol (Sigma-Aldrich, St. Louis, MO), and 1% Antibiotic–Antimycotic solution (Mediatech) and supplemented with 20 U/ml recombinant mouse interleukin (IL)-2 as needed (BD Bioscience, San Jose, CA).
BW-1100.129.237 (BW α−β−) cells (fusion partner cell line kindly provided by Dr. Philippa Marrack, Howard Hughes Medical Institute) and hybridomas, generated previously (Tsunoda et al. 2008), were grown, for adoptive transfer and flow cytometry, in RPMI 1640 media supplemented with 10% Cosmic Calf serum, 2 mM L-glutamine, 1% Antibiotic–Anti-mycotic solution, and 50 μM β-mercaptoethanol.
Adoptive transfer of antiviral T cells
The protocol of Huseby et al. (2001) was followed with slight modification. The 8a-1A1, 8b-1C5, 8b-1Cs, 8b-1CZ, 8a-1Am, 8a-1A3, and 8a-1Ae hybridomas and the control BWα−β− fusion partner were grown in vitro for adoptive transfer. On day –1, 6- to 7-week old SJL/J mice were sublethally irradiated at 400 rad with an X-RAD 320 Irradiator (Precision X-ray, North Branford, CT). On day 0, 2 × 10⁷ cells were adoptively transferred to the irradiated mice (three to ten mice per experimental group) via intravenous injection and 1 × 10⁴ U of IL-2 was administered to the mice intraperitoneally. Mice were weighed daily and scored for clinical signs of EAE. Clinical signs of EAE were assessed as follows: 0 = no clinical disease; 1 = loss of tail tonicity; 2 = mild hind leg paresis; 3 = moderate hind leg paralysis; 4 = complete paraplegia; and 5 = quadriplegia, moribund state, or death (Tsunoda et al. 1998).
Histology
Mice were euthanized with isoflurane when clinical signs were evident or 3 weeks post-transfer. Animals were perfused with phosphate-buffered saline, followed by a buffered 4% paraformaldehyde solution. Brain, spinal cord, lymph nodes, spleen, liver, kidney, lung, heart, sciatic nerve, and skeletal muscle were harvested and fixed in 4% paraformaldehyde. Brains were divided into five coronal slabs per brain, spinal cords were divided into 10–12 transverse slabs per spinal cord, organs were bisected, and all organs were embedded in paraffin. Multiple 4-μm-thick tissue sections were cut and mounted on slides. Brains and spinal cords were stained with Luxol fast blue and the other organs were stained with hematoxylin and eosin. Using the stained tissue sections, cell infiltration was examined in the various organs of the sublethally irradiated recipient mice adoptively transferred with multiple hybridomas and the BWα−β− cells (three to ten mice per experimental group). Damaged axons were visualized on serial sections with SMI 311 (Sternberger Monoclonal, Inc., Baltimore, MD), a cocktail of antibodies (SMI 32, 33, 37, 38, and 39) to nonphosphorylated neurofilament protein, with autoclave pretreatment, as previously described (Tsunoda et al. 2003, 2007).
TCR Vα and Vβ repertoire clone screening
The TCRs of the hybridomas were examined through the use of the SuperTCRExpress™ Mouse T Cell Receptor Vα and Vβ Repertoire Clone Screening Assay Kits (BioMed Immunotech, Tampa, FL), as per the manufacturer’s instructions. Briefly, RNA was purified, cDNA was synthesized and primary and nested PCR amplifications produced various PCR products which when separated on an agarose gel allowed for the screening of 22 individual Vα gene families (Vα1 to Vα23 minus Vα21) and 22 individual Vβ gene families (Vβ1 to Vβ20 with subfamilies Vβ8.1, Vβ8.2, and Vβ8.3). However, as the Vβ subfamilies 5, 8, 9, 11, 12, and 13 are deleted in the SJL/J stain of mouse (Singer et al. 1988), we only included Vβ5 of these Vβ subfamilies in the assay as a negative control. For Vα, the expression of the PCR products was quantified, compared to an internal control PCR product, by scanning the photographs of the agarose gels with a HP Scanjet 8200 series scanner and analyzing the images with the Odyssey Imaging System version 3.0 (Li-Cor Biosciences, Lincoln, NE).
Flow cytometry
The BWα−β− cells, the 8a-1A parental T cell clone and the 8a-1A1, 8a-1A3, and 8a-1Ae cells were activated for 3 h with phytohaemagglutinin (0.5 μg/ml; Sigma) and ionomycin (1 μg/ml; Sigma). Cells were stained with various combinations of anti-mouse Vβ6 TCR phycoerythrin (PE)-conjugated monoclonal antibody, anti-mouse Vβ3 TCR fluorescein isothiocyanate (FITC)-conjugated monoclonal antibody, anti-mouse TCRαβ FITC-conjugated monoclonal antibody, anti-mouse CD8 PE-conjugated monoclonal antibody, and the general lymphocyte marker anti-mouse CD45 V500-conjugated monoclonal antibody (all obtained from BD Biosciences). Nonviable cells were excluded through the use of 7-amino-actinomycin D (7-AAD) (BD Biosciences) for each experiment. Appropriate isotype control antibodies (BD Biosciences) were used for the detection of nonspecific staining. Cells were fixed after staining and stored at 4°C until analyzed. Cells were analyzed on a BD FACSCanto II (BD Biosciences). Flow cytometry data analysis was performed using FlowJo software (Tree Star, Inc., Ashland, OR).
Statistical analysis
The StatView program (SAS Institute Inc., Cary, NC) was used for all statistical analyses performed. The unpaired two-group Mann–Whitney U test was performed for all nonparametric analyses (mean EAE score).
Results
Adoptive transfer of antiviral T cells
Previously, an effector role for CD8+ T cells in EAE was suggested based on the ability of adoptively transferred myelin-specific CD8+ CTL to mediate CNS disease (Huseby et al. 2001; Sun et al. 2001). Here, we demonstrate an effector role for CD8+ T cells in TMEV-induced disease based on the ability of transferred virus-specific CD8+ CTL to mediate CNS disease. Multiple hybridomas (8a-1A1, 8b-1C5, 8b-1Cs, 8b-1CZ, 8a-1Am, 8a-1A3, and 8a-1Ae) were adoptively transferred into sublethally irradiated recipient mice. Clinical signs of disease, such as hind limb paralysis (Fig. 1), developed upon transfer of some (8b-1C5, 8b-1Cs, 8b-1CZ, 8a-1Ae), but not all (8a-1A1, 8a-1Am, 8a-1A3) of these hybridomas. Systematic evaluation of the clinical signs in recipient mice from day 8 through day 21 post-transfer for mice receiving the 8a-1A1, 8a-1A3 or 8a-1Ae cells or the control BWα−β− cells showed that the mice receiving the 8a-1Ae cells scored in the range of 1.5 to 3 (days 10 through 21), while the mice receiving the other two hybridomas or the fusion partner scored very low or not at all (Fig. 2). The recipient mice receiving the 8a-1Ae cells had a significantly greater mean clinical score than the recipient mice receiving either the 8a-1A1 cells or the BW α−β− cells at day 10 post-transfer and had a significantly greater mean clinical score than the recipient mice receiving the 8a-1A1 or 8a-1A3 cells or BW α−β− cells at day 11 post-transfer (p< 0.05, Mann–Whitney U test; Fig. 2). Of these three hybridomas, only the 8a-1Ae cells caused paralysis in the recipient mice, while the 8a-1A1 and 8a-1A3 cells and fusion partner did not cause paralysis.
Fig. 1.
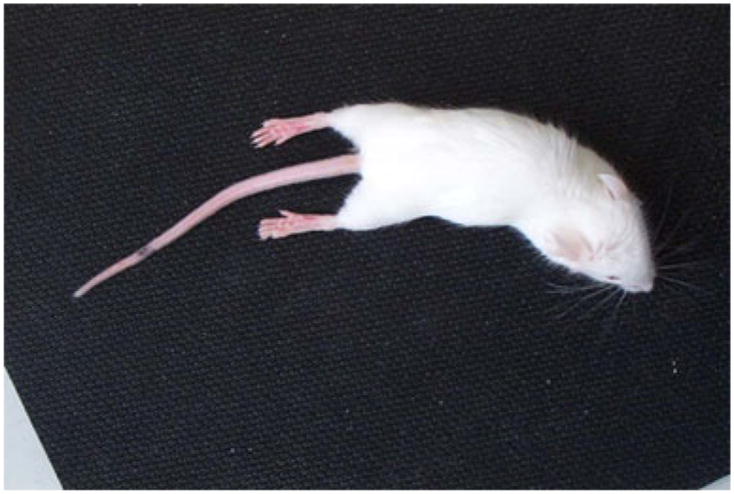
Clinical signs of disease. Adoptive transfer of 8b-1C5 cells via the intravenous route into sublethally irradiated recipient mice resulted in flaccid hind limb paralysis
Fig. 2.
Clinical score. EAE was scored, as described in the Methods, on days 8 through 21 post-transfer, in sublethally irradiated mice receiving the BWα−β− cells or the 8a-1A1, 8a-1A3, or 8a-1Ae cells. Only the mice receiving the 8a-1Ae cells had an appreciable EAE score. At day 10 post-transfer, the mice receiving the 8a-1Ae cells (three mice) had a significantly greater mean EAE score than the mice receiving either the 8a-1A1 cells (four mice) or the BW α−β− cells (five mice). At day 11 post-transfer, the mice receiving the 8a-1Ae cells (three mice) had a significantly greater mean EAE score than the mice receiving the 8a-1A1 or 8a-1A3 cells (four mice each) or the BWα−β−cells (five mice). ‡, p<0.05 (Mann–Whitney U test). Results are mean ± standard error of the mean of groups with one to five mice per group: three to five mice per group for days 8–11, two to five mice per group for days 12–16, and one to four mice per group for days 17–21
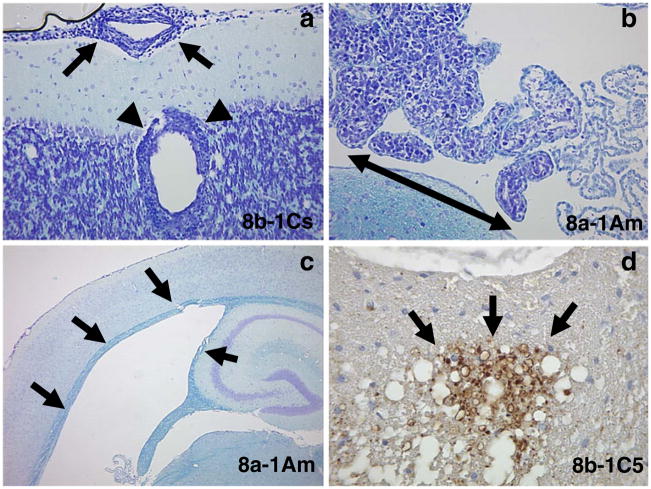
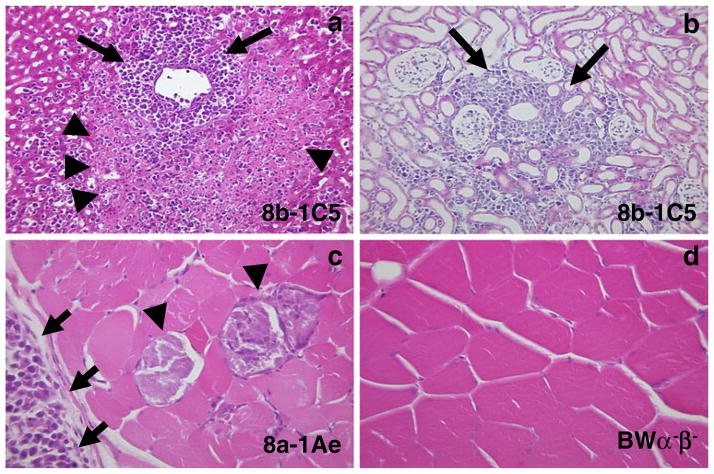
Pathologic changes were present in the CNS (Fig. 3, Table 1) and other organs (Fig. 4) of mice receiving the various hybridomas. Changes observed in the CNS included cell infiltration of the meninges (all hybridomas) and perivascular regions (8b-1Cs) (Fig. 3a, Table 1), cell infiltration of the choroid plexus (8a-1Am) (Fig. 3b, Table 1) and hydrocephalus (8a-1Am) (Fig. 3c, Table 1) of the brain, as well as axonal degeneration in the spinal cord (8b-1C5) (Fig. 3d, Table 1). Changes observed in the other organs included cell infiltration (some hybridomas) and necrosis of the liver (Fig. 4a), cell infiltration of the kidney (all hybridomas) (Fig. 4b) and cell infiltration and muscle fiber degeneration of the muscle (8a-1Ae and 8a-1A3 only) (Fig. 4c). Cell infiltration was also observed in the spleen, lymph node, and sciatic nerve (some hybridomas) but the lung and heart were not involved in most mice (histology not shown). The pattern and extent of cell infiltration in the CNS and other organs were examined in mice receiving the various hybridomas and control BW α−β− cells, and the results are presented in Table 2. No cell infiltration was found in the brains or other organs of mice receiving BWα−β− cells (Table 2, Fig. 4d). The pattern and extent of cell infiltration varied from hybridoma to hybridoma for any particular organ and from organ to organ for any particular hybridoma (Table 2). Overall, there was no correlation between the pattern or extent of the cell infiltration and the ability to induce paralysis.
Fig. 3.
Pathologic changes in the CNS. Adoptive transfer of 8b-1Cs cells via the intravenous route into sublethally irradiated recipient mice resulted in a meningeal (arrows) and perivascular (arrowheads) cell infiltration. Adoptive transfer of 8a-1Am cells via the intravenous route into sublethally irradiated recipient mice resulted in b choroid plexus cell infiltration (double arrowhead) and c hydrocephalus (arrows). Adoptive transfer of 8b-1C5 cells via the intravenous route into sublethally irradiated recipient mice resulted in d axonal degeneration (arrows) in the spinal cord. a–c Luxol fast blue staining, d Nonphosphorylated neurofilament protein immunohistochemistry
Table 1.
Pathological changes in the CNS
| Cells | Meningeal infiltration | Perivascular infiltration | Choroid plexus infiltration | Hydrocephalus | Axonal degenerationa |
|---|---|---|---|---|---|
| BWα−β− | 0/5 (0)b | 0/5 (0) | 0/5 (0) | 0/5 (0) | 0/1 (0) |
| 8a-1Am | 3/3 (100) | 2/3 (66) | 2/3 (66) | 2/3 (66) | NA |
| 8a-1Ae | 5/5 (100) | 0/5 (0) | 0/5 (0) | 1/5 (20) | 1/1 (100) |
| 8a-1A3 | 4/4 (100) | 0/4 (0) | 1/4 (25) | 0/4 (0) | NA |
| 8a-1A1 | 4/9 (44) | 1/9 (11) | 0/9 (0) | 0/9 (0) | 0/4 (0) |
| 8b-1C5 | 5/10 (50) | 0/10 (0) | 0/10 (0) | 0/10 (0) | 2/3 (66) |
| 8b-1Cs | 4/5 (80) | 3/5 (60) | 0/5 (0) | 1/5 (20) | 1/1 (100) |
| 8b-1CZ | 4/4 (100) | 2/4 (50) | 1/4 (25) | 1/4 (25) | 0/1 (0) |
NA not assayed
Assayed via SMI 311 immunostain
Number of mice affected/total number of mice examined (percent affected)
Fig. 4.
Pathologic changes in other organs. Adoptive transfer of 8b-1C5 cells via the intravenous route into sublethally irradiated recipient mice resulted in a cell infiltration (arrows) and necrosis (arrowheads) of the liver and b cell infiltration (arrows) of the kidney. Adoptive transfer of 8a-1Ae cells via the intravenous route into sublethally irradiated recipient mice resulted in c degeneration (arrowheads) and cell infiltration (arrows) of the skeletal muscle. No muscle pathology was seen upon adoptive transfer of the BW α−β− cells d via the intravenous route into sublethally irradiated recipient mice. a–d Hematoxylin and eosin staining
Table 2.
Homing patterns of antiviral CD8+ T cells
| Cells | Paralysis | Brain | Spinal cord | Spleen lymph | Liver | Kidney | Lung | Muscle | Heart | Sciatic nerve |
|---|---|---|---|---|---|---|---|---|---|---|
| BWα−β− | − | 0/5 (0)a | 0/5 (0) | 0/5 (0) | 0/5 (0) | 0/5 (0) | 0/5 (0) | 0/5 (0) | 0/5 (0) | 0/2 (0) |
| 8a-1Am | − | 3/3 (100) | 3/3 (100) | 0/3 (0) | 1/3 (33) | 3/3 (100) | 0/3 (0) | 0/3 (0) | 0/3 (0) | 2/2 (100) |
| 8a-1Ae | + | 5/5 (100) | 5/5 (100) | 0/5 (0) | 0/5 (0) | 3/5 (60) | 1/5 (20) | 3/5 (60) | 1/5 (20) | 2/2 (100) |
| 8a-1A3 | − | 4/4 (100) | 4/4 (100) | 3/4 (75) | 2/4 (50) | 4/4 (100) | 2/4 (50) | 4/4 (100) | 1/4 (25) | 2/2 (100) |
| 8a-1A1 | − | 4/9 (44) | 1/9 (11) | 4/9 (44) | 5/9 (55) | 6/9 (66) | 0/9 (0) | 1/9 (11) | 0/9 (0) | NA |
| 8b-1C5 | + | 5/10 (50) | 4/10 (40) | 0/10 (0) | 4/10 (40) | 3/9 (33) | 0/10 (0) | 0/10 (0) | 0/10 (0) | NA |
| 8b-1Cs | + | 4/5 (80) | 2/5 (40) | 0/5 (0) | 1/4 (25) | 2/4 (50) | 0/5 (0) | 0/5 (0) | 0/5 (0) | 0/1 (0) |
| 8b-1CZ | + | 4/4 (100) | 3/3 (100) | 4/4 (100) | 3/4 (75) | 3/4 (75) | 0/4 (0) | 1/4 (25) | 1/4 (25) | 1/1 (100) |
NA not assayed
Number of mice affected/total number of mice examined (percent affected)
TCR Vα and Vβ repertoire
A previous study reported single individual CD8+ CTLs having multiple TCR Vα chains following influenza virus infection (Dash et al. 2011). The proportion of these cells increased over the course of the infection and these cells were found in the lungs, a nonlymphoid tissue site distal from lymphoid tissue, suggesting a role for the induction of autoimmunity (Dash et al. 2011). To determine whether the CD8+ T cells induced following TMEV infection had multiple TCRs which could confer reactivity to virus and self, TCR Vα and Vβ usage was determined.
No Vβ transcripts were detected in BWα−β− cells for any of the Vβ gene families analyzed (data not shown). The 8a-1A parental CD8+ T cell clone and the 8a-1A1, 8a-1A3, and 8a-1Ae CD8+ T cells derived from 8a-1A all expressed both Vβ3 and Vβ6 (data not shown).
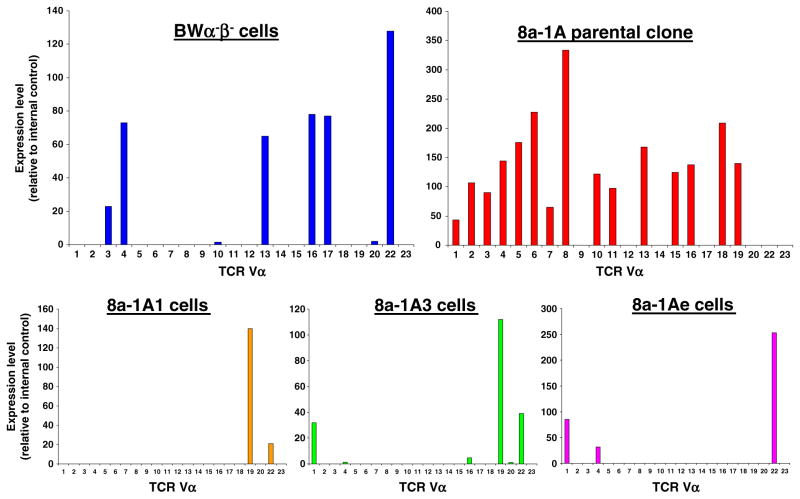
The Vα results for the BWα−β− cells, 8a-1A parental CD8+ T cell clone and 8a-1A1, 8a-1A3, and 8a-1Ae CD8+ T cells are presented as histograms in Fig. 5. Our analysis of BWα−β− cells found Vα3, Vα4, Vα13, V α 16, Vα17, and Vα22 mRNA (Fig. 5). Examination of the 8a-1A parental CD8+ T cell clone demonstrated the presence of Vα’s 1–8, 10, 11, 13, 15, 16, 18, and 19 mRNAs (Fig. 5). Our analysis of the 8a-1A1, 8a-1A3, and 8a-1Ae CD8+ T cells detected Vα’s 19 and 22 (8a-1A1), 1, 19, and 22 (8a-1A3) or 1, 4, and 22 (8a-1Ae) (Fig. 5). The lineages of the individual Vαs present in the 8a-1A1, 8a-1A3, and 8a-1Ae CD8+ T cells can be traced back to either the BWα−β− cells or the 8a-1A parental CD8+ T cell clone or to both.
Fig. 5.
Vα mRNA expression. The expression (relative to an internal control) of Vα mRNAs was analyzed and quantified, as described in the methods, and presented in histogram form for the BW α−β− cells (upper left histogram), the 8a-1A parental clone (upper right histogram) and the 8a-1A1, 8a-1A3, and 8a-1Ae cells (lower histograms from left to right, respectively). Multiple Vα mRNAs were found to be present in all of these cell types
Since Vβ3 and Vβ6 mRNAs are present in all three CD8+ T cells, it may be that a specific combination of a particular Vα chain with one or the other of the Vβ chains is the determining factor as to whether or not the CD8+ T cell is able to induce disease. The Vα22 mRNA is present in all three CD8+ T cells and, therefore, probably does not play a role in the induction of disease. The Vα19 mRNA is present in the 8a-1A1 and 8a-1A3 cells, which do not induce disease, and, therefore, also probably does not play a role in the induction of disease. The Vα1 mRNA is present in the 8a-1A3 cells which do not induce disease and the 8a-1Ae cells which do induce disease, so, again, this Vα probably does not play a role in the induction of disease. The Vα4 mRNA is present only in the 8a-1Ae cells which do induce disease, and, therefore, this Vα probably does play a role in the induction of disease.
Cell surface phenotype
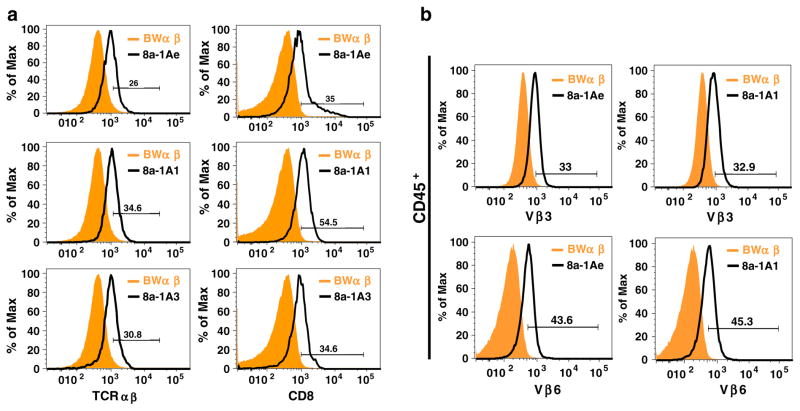
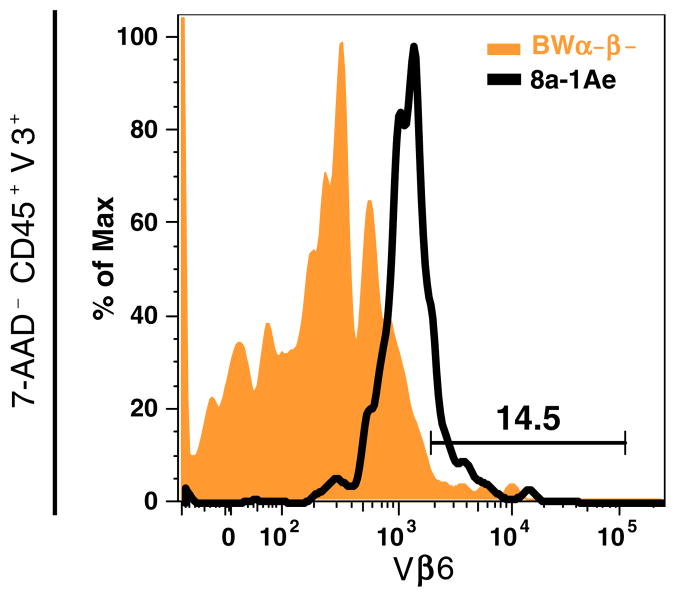
Flow cytometry was used to characterize the cell surface expression of T cell-specific markers (Fig. 6a) and to confirm the surface expression of Vβ3 and Vβ6 detected in the 8a-1A1, 8a-1A3, and 8a-1Ae cells by PCR (Figs. 6b and 7). All three hybridomas expressed both TCRαβ and CD8 in comparison to BWα−β− cells (Fig. 6a). All three hybridomas (8a-1A3 not shown) expressed both Vβ3 and Vβ6 compared to BW α−β− cells (Fig. 6b). Dual staining of CD45+ viable cells (7-AAD−) for both Vβ3 and Vβ6 demonstrated the presence of both Vβ3 and Vβ6 on the surface of the same 8a-1Ae cells (Fig. 7). Appropriate isotype control antibodies did not detect any nonspecific staining (data not shown).
Fig. 6.
Surface expression of T cell-specific markers. The BW α−β− cells and the 8a-1A1, 8a-1A3, and 8a-1Ae cells were analyzed by flow cytometry for surface expression of a TCRαβ and CD8, and b Vβ3 and Vβ6. a All three hybridomas expressed both TCRαβ and CD8 in comparison to BW α−β− cells. b The 8a-1A1, 8a-1A3 (not shown), and 8a-1Ae cells expressed both V β 3 and V β 6 compared to BWα−β− cells. Cells were gated for CD45+ cells
Fig. 7.
Dual expression of V β 3 and Vβ6. The BWα−β− cells and the 8a-1Ae cells were analyzed by flow cytometry for dual surface expression of Vβ3 and Vβ6. Viable 8a-1Ae cells (7-AAD−), gated for CD45+ cells followed by Vβ3+ cells, expressed Vβ6 in comparison to BW α−β− cells
Discussion
Epidemiological and molecular evidence implicates infectious agents (viral and bacterial) as the principal environmental insults responsible for the induction of autoimmune diseases [reviewed in (Ascherio and Munger 2007; Fujinami 2001; Libbey and Fujinami 2010)]. A variety of mechanisms have been suggested as the means by which infections can initiate and/or exacerbate autoimmune diseases [reviewed in (Cusick et al. 2011)]. One mechanism is molecular mimicry, where a foreign antigen shares sequence or structural similarities with self-antigens. Molecular mimicry has typically been characterized on an antibody or T cell level. However, structural relatedness between pathogen and self does not account for T cell activation in a number of autoimmune diseases. A proposed mechanism that could have been misinterpreted for molecular mimicry is the expression of dual TCRs on a single T cell. These T cells have dual reactivity to both foreign and self-antigens leaving the host vulnerable to foreign insults capable of triggering an autoimmune response.
Previously, we demonstrated that dual-reactive (viral and self) CD8+ T cells were produced following a natural viral infection (Tsunoda et al. 2002, 2005, 2006, 2008). Here, we demonstrate that some (8a-1Ae) but not others (8a-1A1 and 8a-1A3) of these dual-reactive (viral and self) CD8+ T cells could induce disease in naive mice. The TCR Vβ and Vα repertoires were than examined as a means of exploring a potential mechanism for how some of these dual-reactive (viral and self) CD8+ T cells could induce disease. We found that these cells had more than one TCR (Vβ3Vα? and Vβ6Vα?) on their surface. The presence of dual TCRs made up of different combinations of Vβ3, Vβ6, and Vαs could explain how some dual-reactive (viral and self) CD8+ T cells can induce disease while others cannot.
The concept that CD8+ CTLs can express dual TCRs which play a role in the development of CNS autoimmune disease is relatively new (Ji et al. 2010). In this recent study, CD8+ CTLs isolated from TCR-transgenic (Vβ8 Vα8) mice were shown to express, by flow cytometry, both Vβ8 proteins, specific for self, and Vβ6 proteins, specific for virus, and to express Vα8, Vα11, Vα13, and Vα14 mRNAs as determined by real-time PCR. The functionality of these Vα mRNAs was not determined and the specific pairing of Vα and Vβ chains on the T cell surface was not determined (Ji et al. 2010). In comparison, the CD8+ CTLs harboring the dual TCRs in our studies occurred following viral infection of wild-type mice (Tsunoda et al. 2002, 2005, 2006, 2008) and were not generated artificially using transgenes. The mouse is the natural host for TMEV, which is the virus used in our studies. In contrast to the previous study in which a self-specific CD8+ CTL was found to also express a viral-specific TCR (Ji et al. 2010), in our study, a viral-specific CD8+ CTL was found to also react with self (Tsunoda et al. 2002, 2005, 2006, 2008). The identification of the viral and self epitopes recognized by the dual-reactive CD8+ CTLs would increase our knowledge concerning the development of autoimmune disease. These studies are ongoing.
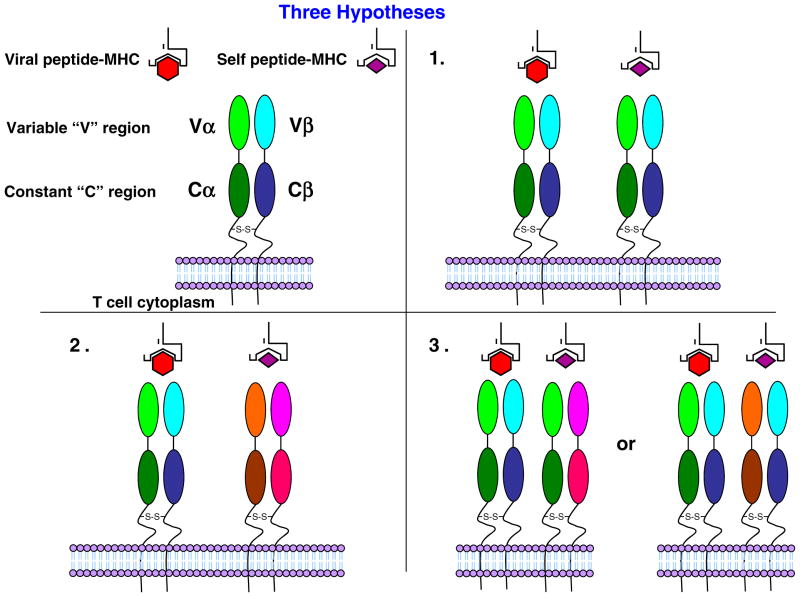
The role of the dual TCR in autoimmune disease could be through the activation of the T cell by a foreign antigen recognized by the first TCR which makes the cell competent to use the second TCR to attack self (Padovan et al. 1993). However, three possible mechanisms, including the above, exist for dual reactivity of the TCR in autoimmune disease: (1) molecular mimicry, where one TCR recognizes virus and self; (2) dual TCRs, where one TCR is specific for virus and the other TCR is specific for self; or (3) a chimeric TCR, where different Vα and Vβ combinations on a single T cell are responsible for recognizing virus and self (Fig. 8). The detection, via flow cytometry, of both Vβ6 and Vβ8 on the surface of a single T cell in the TCR-transgenic system (Ji et al. 2010) suggests that the dual reactivity occurs by either mechanism 2 dual TCRs or mechanism 3 chimeric TCR and not mechanism 1 molecular mimicry. Likewise, our ability to detect, via flow cytometry, both Vβ3 and Vβ6 proteins on the surface of a single T cell (Fig. 7) suggests that the dual reactivity in our system occurs by either mechanism 2 dual TCRs or mechanism 3 chimeric TCR and not likely mechanism 1 molecular mimicry. Studies are currently ongoing to determine the pairings of Vαs with Vβs on the surface of our hybridomas as a means of differentiating between mechanism 2 and mechanism 3.
Fig. 8.
Model for dual TCR reactivity. Three possible mechanisms exist for dual reactivity of the TCR in autoimmune disease: (1) Molecular mimicry, where one TCR recognizes virus and self; (2) dual TCRs, where one TCR is specific for virus and the other TCR is specific for self; and (3) a chimeric TCR, where different Vα and Vβ combinations on a single T cell are responsible for recognizing both virus and self
Acknowledgments
We wish to thank Nikki J. Kennett, BS, Daniel J. Doty, and Braden T. McElreath for excellent technical assistance. We wish to acknowledge Kathleen Borick for the outstanding preparation of the manuscript. This work was supported by funding from NIH [5R01NS34497 (R.S.), R21NS059724 (I.T.), P20RR018724 (I.T.), P20GM103433 (I.T)], and the Emma Mary Deland Foundation (R.S.).
Contributor Information
Jane E. Libbey, Department of Pathology, University of Utah School of Medicine, 30 North 1900 East, 3R330 SOM, Salt Lake City, UT 84132, USA
Matthew F. Cusick, Department of Pathology, University of Utah School of Medicine, 30 North 1900 East, 3R330 SOM, Salt Lake City, UT 84132, USA
Ikuo Tsunoda, Department of Microbiology and Immunology, Louisiana State University Health Sciences Center, 1501 Kings Highway, Shreveport, LA 71130, USA. Center for Molecular and Tumor Virology, Louisiana State University Health Sciences Center, 1501 Kings Highway, Shreveport, LA 71130, USA.
Robert S. Fujinami, Email: Robert.Fujinami@hsc.utah.edu, Department of Pathology, University of Utah School of Medicine, 30 North 1900 East, 3R330 SOM, Salt Lake City, UT 84132, USA
References
- Ascherio A, Munger KL. Environmental risk factors for multiple sclerosis. Part II: noninfectious factors. Ann Neurol. 2007;61:504–513. doi: 10.1002/ana.21141. [DOI] [PubMed] [Google Scholar]
- Babbé H, Roers A, Waisman A, Lassmann H, Goebels N, Hohlfeld R, Friese M, Schröder R, Deckert M, Schmidt S, Ravid R, Rajewsky K. Clonal expansions of CD8+ T cells dominate the T cell infiltrate in active multiple sclerosis lesions as shown by micro-manipulation and single cell polymerase chain reaction. J Exp Med. 2000;192:393–404. doi: 10.1084/jem.192.3.393. [DOI] [PMC free article] [PubMed] [Google Scholar]
- Clatch RJ, Melvold RW, Miller SD, Lipton HL. Theiler’s murine encephalomyelitis virus (TMEV)-induced demyelinating disease in mice is influenced by the H-2D region: correlation with TMEV-specific delayed-type hypersensitivity. J Immunol. 1985;135:1408–1414. [PubMed] [Google Scholar]
- Cusick MF, Libbey JE, Fujinami RS. Molecular mimicry as a mechanism of autoimmune disease. Clin Rev Allergy Immunol. 2011 doi: 10.1007/s12016-011-8294-7. [DOI] [PMC free article] [PubMed] [Google Scholar]
- Dash P, McClaren JL, Oguin TH, III, Rothwell W, Todd B, Morris MY, Becksfort J, Reynolds C, Brown SA, Doherty PC, Thomas PG. Paired analysis of TCRα and TCRβ chains at the single-cell level in mice. J Clin Invest. 2011;121:288–295. doi: 10.1172/JCI44752. [DOI] [PMC free article] [PubMed] [Google Scholar]
- Friese MA, Fugger L. Autoreactive CD8+ T cells in multiple sclerosis: a new target for therapy? Brain. 2005;128:1747–1763. doi: 10.1093/brain/awh578. [DOI] [PubMed] [Google Scholar]
- Fujinami RS. Viruses and autoimmune disease—two sides of the same coin? Trends Microbiol. 2001;9:377–381. doi: 10.1016/S0966-842X(01)02097-2. [DOI] [PMC free article] [PubMed] [Google Scholar]
- Hayashi T, Morimoto C, Burks JS, Kerr C, Hauser SL. Dual-label immunocytochemistry of the active multiple sclerosis lesion: major histocompatibility complex and activation antigens. Ann Neurol. 1988;24:523–531. doi: 10.1002/ana.410240408. [DOI] [PubMed] [Google Scholar]
- Huseby ES, Liggitt D, Brabb T, Schnabel B, Öhlén C, Goverman J. A pathogenic role for myelin-specific CD8+ Tcells in a model for multiple sclerosis. J Exp Med. 2001;194:669–676. doi: 10.1084/jem.194.5.669. [DOI] [PMC free article] [PubMed] [Google Scholar]
- Ji Q, Perchellet A, Goverman JM. Viral infection triggers central nervous system autoimmunity via activation of CD8+ Tcells expressing dual TCRs. Nat Immunol. 2010;11:628–634. doi: 10.1038/ni.1888. [DOI] [PMC free article] [PubMed] [Google Scholar]
- Libbey JE, Fujinami RS. Potential triggers of MS. Results Probl Cell Differ. 2010;51:21–42. doi: 10.1007/400_2008_12. [DOI] [PMC free article] [PubMed] [Google Scholar]
- Lin X, Thiemann NR, Pease LR, Rodriguez M. VP1 and VP2 capsid proteins of Theiler’s virus are targets of H-2D- restricted cytotoxic lymphocytes in the central nervous system of B10 mice. Virology. 1995;214:91–99. doi: 10.1006/viro.1995.9951. [DOI] [PubMed] [Google Scholar]
- Lin X, Pease LR, Rodriguez M. Differential generation of class I H-2D- versus H-2 K-restricted cytotoxicity against a demyelinating virus following central nervous system infection. Eur J Immunol. 1997;27:963–970. doi: 10.1002/eji.1830270424. [DOI] [PubMed] [Google Scholar]
- Lindsley MD, Rodriguez M. Characterization of the inflammatory response in the central nervous system of mice susceptible or resistant to demyelination by Theiler’s virus. J Immunol. 1989;142:2677–2682. [PubMed] [Google Scholar]
- McCallum K, Esiri MM, Tourtellotte WW, Booss J. T cell subsets in multiple sclerosis. Gradients at plaque borders and differences in nonplaque regions. Brain. 1987;110:1297–1308. doi: 10.1093/brain/110.5.1297. [DOI] [PubMed] [Google Scholar]
- Ofosu-Appiah W, Mokhtarian F. Characterization of a T suppressor cell line that downgrades experimental allergic encephalomyelitis in mice. Cell Immunol. 1991;135:143–153. doi: 10.1016/0008-8749(91)90261-9. [DOI] [PubMed] [Google Scholar]
- Padovan E, Casorati G, Dellabona P, Meyer S, Brockhaus M, Lanzavecchia A. Expression of two T cell receptor α chains: dual receptor T cells. Science. 1993;262:422–424. doi: 10.1126/science.8211163. [DOI] [PubMed] [Google Scholar]
- Rodriguez M, Sriram S. Successful therapy of Theiler’s virus-induced demyelination (DA strain) with monoclonal anti-Lyt-2 antibody. J Immunol. 1988;140:2950–2955. [PubMed] [Google Scholar]
- Rodriguez M, Leibowitz J, David CS. Susceptibility to Theiler’s virus-induced demyelination. Mapping of the gene within the H-2D region. J Exp Med. 1986;163:620–631. doi: 10.1084/jem.163.3.620. [DOI] [PMC free article] [PubMed] [Google Scholar]
- Singer PA, McEvilly RJ, Balderas RS, Dixon FJ, Theofilopoulos AN. T-cell receptor α-chain variable-region haplotypes of normal and autoimmune laboratory mouse strains. Proc Natl Acad Sci USA. 1988;85:7729–7733. doi: 10.1073/pnas.85.20.7729. [DOI] [PMC free article] [PubMed] [Google Scholar]
- Sobel RA. T-lymphocyte subsets in the multiple sclerosis lesion. Res Immunol. 1989;140:208–211. doi: 10.1016/0923-2494(89)90088-6. [DOI] [PubMed] [Google Scholar]
- Sun D, Qin Y, Chluba J, Epplen JT, Wekerle H. Suppression of experimentally induced autoimmune encephalomyelitis by cytolytic T-T cell interactions. Nature. 1988;332:843–845. doi: 10.1038/332843a0. [DOI] [PubMed] [Google Scholar]
- Sun D, Whitaker JN, Huang Z, Liu D, Coleclough C, Wekerle H, Raine CS. Myelin antigen-specific CD8+ T cells are encephalitogenic and produce severe disease in C57BL/6 mice. J Immunol. 2001;166:7579–7587. doi: 10.4049/jimmunol.166.12.7579. [DOI] [PubMed] [Google Scholar]
- Tsunoda I, Fujinami RS. Two models for multiple sclerosis: Experimental allergic encephalomyelitis and Theiler’s murine encephalomyelitis virus. J Neuropathol Exp Neurol. 1996;55:673–686. doi: 10.1097/00005072-199606000-00001. [DOI] [PubMed] [Google Scholar]
- Tsunoda I, Iwasaki Y, Terunuma H, Sako K, Ohara Y. A comparative study of acute and chronic diseases induced by two subgroups of Theiler’s murine encephalomyelitis virus. Acta Neuropathol (Berl) 1996;91:595–602. doi: 10.1007/s004010050472. [DOI] [PubMed] [Google Scholar]
- Tsunoda I, Kuang L-Q, Tolley ND, Whitton JL, Fujinami RS. Enhancement of experimental allergic encephalomyelitis (EAE) by DNA immunization with myelin proteolipid protein (PLP) plasmid DNA. J Neuropathol Exp Neurol. 1998;57:758–767. doi: 10.1097/00005072-199808000-00005. [DOI] [PubMed] [Google Scholar]
- Tsunoda I, Kuang L-Q, Fujinami RS. Induction of autoreactive CD8+ cytotoxic cells during Theiler’s murine encephalomyelitis virus infection: Implications for autoimmunity. J Virol. 2002;76:12834–12844. doi: 10.1128/JVI.76.24.12834-12844.2002. [DOI] [PMC free article] [PubMed] [Google Scholar]
- Tsunoda I, Kuang L-Q, Libbey JE, Fujinami RS. Axonal injury heralds virus-induced demyelination. Am J Pathol. 2003;162:1259–1269. doi: 10.1016/S0002-9440(10)63922-3. [DOI] [PMC free article] [PubMed] [Google Scholar]
- Tsunoda I, Kuang L-Q, Kobayashi-Warren M, Fujinami RS. Central nervous system pathology caused by autoreactive CD8+ T cell clones following virus infection. J Virol. 2005;79:14640–14646. doi: 10.1128/JVI.79.23.14640-14646.2005. [DOI] [PMC free article] [PubMed] [Google Scholar]
- Tsunoda I, Libbey JE, Kobayashi-Warren M, Fujinami RS. IFN-γ production and astrocyte recognition by autoreactive T cells induced by Theiler’s virus infection: role of viral strains and capsid proteins. J Neuroimmunol. 2006;172:85–93. doi: 10.1016/j.jneuroim.2005.11.004. [DOI] [PubMed] [Google Scholar]
- Tsunoda I, Tanaka T, Saijoh Y, Fujinami RS. Targeting inflammatory demyelinating lesions to sites of Wallerian degeneration. Am J Pathol. 2007;171:1563–1575. doi: 10.2353/ajpath.2007.070147. [DOI] [PMC free article] [PubMed] [Google Scholar]
- Tsunoda I, Kobayashi-Warren M, Libbey JE, Fujinami RS. Central nervous system degeneration caused by autoimmune cytotoxic CD8+ T cell clones and hybridomas. In: Binder MD, Hirokawa N, Windhorst U, editors. Encyclopedia of Neuroscience. Springer; New York: 2008. pp. 619–625. [Google Scholar]
- Weiner HL, Friedman A, Miller A, Khoury SJ, Al-Sabbagh A, Santos L, Sayegh M, Nussenblatt RB, Trentham DE, Hafler DA. Oral tolerance: immunologic mechanisms and treatment of animal and human organ-specific autoimmune diseases by oral administration of autoantigens. Annu Rev Immunol. 1994;12:809–837. doi: 10.1146/annurev.iy.12.040194.004113. [DOI] [PubMed] [Google Scholar]


