

Abstract
Objective
Task-specific focal hand dystonia (tspFHD) is a movement disorder diagnosed in individuals performing repetitive hand behaviors. The extent to which processing anomalies in primary sensory cortex extend to other regions or across the two hemispheres is presently unclear.
Methods
In response to low/high rate and novel tactile stimuli on the affected and unaffected hands, magnetoencephalography (MEG) was used to elaborate activity timing and amplitude in the primary somatosensory (S1) and secondary somatosensory/parietal ventral (S2/PV) cortices. MEG and clinical performance measures were collected from thirteen patients and matched controls.
Results
Compared to controls, subjects with tspFHD had increased response amplitude in S2/PV bilaterally in response to high rate and novel stimuli. Subjects with tspFHD also showed increased response latency (low rate, novel) of the affected digits in contralateral S1. For high rate, subjects with tspFHD showed increased response latency in ipsilateral S1 and S2/PV bilaterally. Activation differences correlated with functional sensory deficits (predicting a latency shift in S1), motor speed and muscle strength.
Conclusions
There are objective differences in the amplitude and timing of activity for both hands across contralateral and ipsilateral somatosensory cortex in patients with tspFHD.
Significance
Knowledge of cortical processing abnormalities across S1 and S2/PV in dystonia should be applied towards the development of learning based sensorimotor interventions.
Keywords: Focal hand dystonia, neuroimaging, magnetoencephalography, aberrant evoked sensory responses
Introduction
Task-specific focal hand dystonia (tspFHD) is an uncommon disorder of movement (Opavsky 2006) characterized by involuntary end range twisting postures of the fingers, wrist and forearm when performing a specific task. While the etiology of focal hand dystonia is considered idiopathic, most researchers and clinicians agree it is a multifactorial disorder which results from an interaction of intrinsic and extrinsic mechanisms. Intrinsic factors believed to contribute to the development of tspFHD include genetics (Gasser et al., 1998), musculoskeletal limitations (Byl et al., 2006), an imbalance of inhibition and excitation (Stinear et al., 2004; Simonetta-Moreau et al., 2006), somatosensory dysfunction (Butterworth et al., 2003, Byl et al., 2002; Meunier et al., 2001), and aberrant homeostatic plasticity (Quartarone et al., 2005). The extrinsic factors that may contribute to tspFHD range from trauma/injury to the upper extremity and neuropathy (Jankovic 2001; Charness et al., 1996) to psychological factors such as personal stress and perfectionism (Jabusch et al., 2004; Altenmuller and Jabusch, 2009) and environmental/behavioral stressors including poor ergonomics and excessive repetitive overuse (Byl et al., 1996). The cause–effect relationship between intrinsic pathophysiology and extrinsic influences is contentious. It is not clear whether abnormal intrinsic factors such as aberrant neurophysiological processing predispose one to developing tspFHD or whether the intrinsic features observed in patients withtspFHD are a consequence of the disease.
Both early electrophysiological animal studies and human functional neuroimaging studies using functional magnetic resonance imaging (fMRI) and positron emission tomography (PET) have reported significant degradation of topography of the contralateral, primary sensory cortex (SI) digit representation of the affected and unaffected hands (Barbe et al., 2003; Blake et al., 2002; Byl et al.; 1996; Byl et al., 2007; Tempel and Perlmutter, 1993; Butterworth et al., 2003; Nelson et al., 2009). In these studies the somatotopic organization of the digits has been preserved (inferior to superior), however the receptive fields representing the dystonic and adjacent fingers become enlarged. A number of studies have used magnetoencephalography (MEG) to examine the timing and amplitude of cortical somatosensory responses following a moderately paced stimulus in the contralateral hemisphere to the affected hand in patients with tspFHD. (Elbert et al., 1998; Meunier et al., 2001; Byl et al., 2002; Candia et al., 2003; McKenzie et al., 2003; Tecchio et al., 2008). A few studies reported differences in amplitude and latency in contralateral S1 between the affected and unaffected hands of subjects with tspFHD compared with controls (McKenzie et al., 2003; Byl et al., 2003) while another study reported no difference in either amplitude or latency unless severity of dystonia was factored into the analysis (Byl et al., 2002).
There are many demonstrable clinical deficits observed in patients with tspFHD, including impairments in sensory discrimination (stereognosis and graphesthesia), reduced muscle strength of intrinsic versus extrinsic muscles) and reduced quality of performance at the target task (Byl et al., 1996, 2002; McKenzie et al., 2003, 2009). In the somatosensory domain, deficits in temporal discrimination are present in tspFHD, with individuals showing difficulty in evaluating the spacing and timing of stimuli (Bara-Jiminez et al., 2000a, b). Clinical measures of motor speed and motor control at the target task have been reported to correlate with MEG measures of latency and amplitude in contralateral SI in response to a moderately paced stimulus in subjects with tspFHD (McKenzie et al, 2003). However, it is unclear if a similar relationship is identifiable in the response properties of S2/PV, a region that receives direct projections from S1 (Disbrow et al., 2003). In healthy subjects there is usually a well-defined late response (80ms following stimulation) in MEG that corresponds to bilateral S2/PV activity associated with unilateral tactile stimuli (Hämäläinen et al., 1990; Hari et al., 1999; Hinkley et al., 2007). Furthermore, since only the contralateral hemisphere has been studied in tspFHD, it remains to be seen whether or not a similar relationship is identifiable in evoked fields of the ipsilateral hemisphere. It has been proposed that the ipsilateral hemisphere serves an inhibitory function in somatosensory processing, and that inhibition in the sensory domain is affected in tspFHD (Blatow et al., 2007; Tamura et al., 2009). Furthermore, previous somatosensory studies have focused only on moderately paced stimuli, and not complex stimulation. While decreased activity in contralateral S2/PV has been reported following tactile stimulation to the affected hands of subjects with tspFHD (Butterworth et al., 2003) it is unclear how this reduced activity relates to compromised motor ability, or the extent to which serial processing from S1 to secondary somatosensory/parietal ventral cortex (S2/PV) in response to cutaneous somatosensory stimulation differs from healthy controls.
The overall goal of this study was to bilaterally examine the timing and amplitude of activity across S1 and S2/PV in patients with tspFHD and matched control participants, and to relate any differences in cortical activity to clinical measures of behavioral deficits. Evoked responses to three categories of somatosensory stimuli were compared (low rate, high rate, novel). A secondary purpose of the study was to determine if clinical parameters of function, sensory discrimination, fine motor speed, strength, and motor control could be used to predict aberrant cortical sensory processing. We hypothesized subjects with tspFHD would show significant differences in somatosensory response amplitudes and latencies for high rate and novel stimuli in: a) primary and secondary somatosensory cortices; b) ipsilateral and contralateral hemispheres; and c) affected and unaffected hands. We also hypothesized that clinical measures of function, sensation, motor speed, strength, and motor control would correlate with and possibly predict aberrant somatosensory (S1 and S2/PV) abnormalities in patients with tspFHD.
Methods
Subjects
Subjects with tspFHD were diagnosed by neurologist specializing in movement disorders in order to participate in the study. During diagnosis, patients were screened for any sort of secondary dystonia (“psuedodystonia”) as only patients with idiopathic tspFHD were allowed to participate in this study. Subjects were clinically evaluated for severity using the Burke-Fahn-Mardsen dystonia movement scale (Burke et al., 1985). Inclusion criteria included: ages 21-75 years, clear dystonic movements related to the performance of a target task, no specific neurological disorder that would explain the signs and symptoms, and no Botox injections within the three months prior to participation in the study. Exclusion criteria included: systemic or neurologic disease associated with a known movement disorder, medical instability and electromagnetically activated medical equipment or devices which might cause damage to the sensitive detection circuits. All subjects with focal hand dystonia were recruited from the UCSF Faculty Practice in Physical Therapy and the Movement Disorders Clinic at UCSF.
Clinical Performance Measures
All subjects with focal hand dystonia were evaluated using a battery of clinical measures for function, sensation, motor speed, strength, and task-specific motor control to determine the relationship between clinical presentation and cortical activation measured with MEG (Byl et al., 1996; McKenzie et al., 2003). Overall level of function was assessed using the Café 40, a questionnaire that evaluates activities of daily living (Fung et al., 1997). Sensation was assessed using graphesthesia (a modified subtest from the Jean Ayers Sensory Integration Praxis Test) and stereognosis (Byl-Cheney-Boczai Sensory Discriminator) (Byl et al., 2002; see Byl et al., 2003 for methods) in order to evaluate higher levels of somatosensory processing. A sum sensory discrimination score was then calculated by adding the percent correct scores from both tests (McKenzie et al., 2003).
Motor speed and accuracy (digital reaction time and tapping speed) were assessed using a stopwatch and a finger tapper in order to quantify motor deficits associated with focal hand dystonia. The stopwatch measured digital reaction time as the speed at which the subject could start and stop a stopwatch (Bohannon 1995). Each digit was tested three times and the average of those three trials was recorded. A total average of the five digits was then calculated for each hand (for details, see Byl et al., 2003). Tapping speed was measured by the number of times a subject could depress a tapper (PAR Psychological Assessment) in a 10 second period of time (Dilks L, 2006). Each digit was tested and an overall average was calculated for each hand. This average was subtracted from the mean reaction time of healthy adults to determine a normative score. A sum motor speed score was then calculated by summing the normative score of the digital reaction time test with the average score from the tapping speed test.
Strength levels (power grip, pinch [lateral, 3 point chuck], lumbricals) were evaluated clinically to investigate weaknesses associated with the muscles of the hand. Power grip strength was measured with a handheld Jamar dynamometer (Peolsson et al., 2001). The 3 jaw chuck pinch strength, and lateral pinch strength were measured with a pinch dynamometer (McKenzie et al., 2003, Peolsson et al., 2001). Lumbrical strength was measured with a MicroFet dynamometer (see Byl et al., 2003 for methods). A sum score was then calculated for strength by summing the averages for each of the strength measures.
Task specific motor control was assessed using video analysis (Byl 2004). Subjects were asked to perform the target task. A group of raters observed the video. Using an ordinal score (0-4), blinded evaluators graded hand posture, movement patterns, and control of movement. A percent score of the total possible points was then calculated. If no dystonia was present, the score was expected to be close to 100%
All clinical measures had been previously pilot-tested. All tests had good interrater and intrarater reliability (Byl et al., 1996). Prior factor analyses were conducted for all tests, revealing that all clinical measures were considered an independent family (McKenzie et al., 2003).
Magnetoencephalogram (MEG) Recording and Stimulus Paradigm
MEG data was acquired with a 275-channel CTF Omega 2000 whole-head system from VSM MedTech (Coquitlam, BC, Canada) using 3rd order gradient correction at a 1200 Hz sampling rate. Head position relative to the MEG sensors was determined with three small coils placed at fiducial sites (nasion, right and left preauricular points) in order to detect head motion and for co-registration with structural MR images. Structural MR images were obtained for each subject using a 1.5T MRI scanner (GE Medical System, Milwaukee, WI) to acquire a 3D structural image and to determine the anatomic location of cortical activation (flip angle = 40°, TR/TE = 27/6 msecs, FOV = 240 × 240 mm, 1.5 mm slice thickness, 256 × 256 × 124 pixels).
Somatosensory stimuli were presented in three separate blocks: low rate (0.5 Hz ISI), high rate (3 Hz ISI), and an oddball paradigm where novel stimuli were interspersed with more frequent stimuli (3 Hz ISI, 10 msec jitter) to an adjacent digit (Figure 1). Standard and deviant stimuli were presented at probabilities of 0.83 and 0.17 respectively. Standard stimuli served as the background noise while the deviant stimuli served as the test stimuli. The three blocks were tested on both hands. For subjects with tspFHD, the most affected digit was selected for the deviant stimulus and the digit adjacent to the most affected digit (either unaffected or less affected) was selected for the standard. The most affected digit was also selected for the high rate and low rate blocks in subjects with tspFHD. The most affected digit was selected by the participant through self-report as being the digit that produced the dystonic symptoms during the task-specific behavior, and not necessarily the digit most compromised through dystonic posturing (as in the case of the index finger, see Rosset-Llobet et al., 2009). In the case that a single digit could not be isolated in the tspFHD group, the second digit (index finger; D2) was selected as the most affected and the third digit (middle finger; D3) as the neighboring digit. For healthy control subjects, D2 was used as the deviant and D3 as the standard. The tactile stimuli were delivered by pneumatically driven pulses (140 msecs duration) to the tips of the hand with a balloon diaphragm. The intensity of the stimuli was set at 17psi (pounds per square inch) and was detectable by all subjects. This somatosensory paradigm was similar to that employed by Zhu et al., 2007 in healthy individuals but has not to date been tested in patients with tspFHD.
Figure 1.

Somatosensory Paradigm. 1. Low rate (mean ISI; 2s) digit 2 (D2) stimulation (black bars alone). 2. High rate (mean ISI; 0.33s) D2 stimulation alone. 3. Oddball D2 stimulation with ipsilateral D3 stimulation as the standard stimulus (white bars). RD3 and LD3 were used as standards with RD2 and LD2 as deviants respectively in the healthy control group. The most affected digit on the affected hand of the tspFHD group was used as the deviant with the adjacent unaffected or less affected digit used as the standard and the corresponding digits matched on the unaffected hand of the tspFHD group.
Data Analysis
MEG sensor data was bandpass filtered at 2-40 Hz and trials with excessive noise or artifact in the raw sensor data were manually removed prior to analysis. Approximately 100 trials were averaged separately in each of the three blocks (low rate, high rate, and deviant stimuli in the oddball condition). The averaged datasets were then analyzed using an equivalent current dipole (ECD) model to localize the cortical activity (Hämäläinen et al., 1990). Somatosensory evoked fields (SEF) arising from the primary and secondary somatosensory cortices in the time window up to 150 milliseconds following the stimulus onset were analyzed (Figure 2). The early response (30-70 msecs) was analyzed for activation in the primary somatosensory cortex and the late response (70-130msecs) was analyzed for activation in secondary somatosensory cortex/parietal ventral area (S2/PV; Mertens et al., 2000; Zhu et al., 2007).
Figure 2.
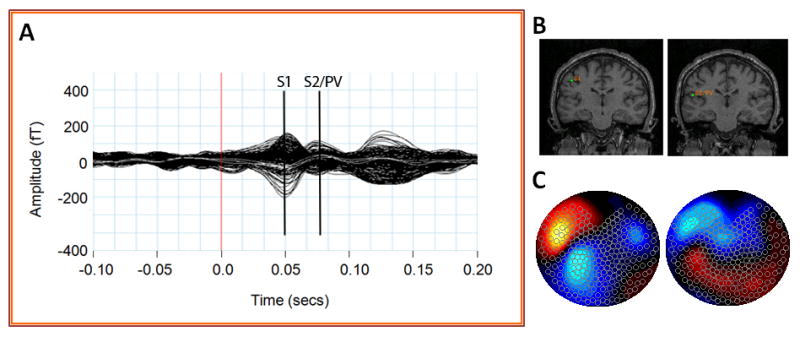
Summary of MEG sensor data during tactile stimulation of the second digit (RD2). Averaged MEG sensor data (A) produces two peaks in primary somatosensory (S1) and secondary somatosensory/parietal ventral cortex (S2/PV). Equivalent current dipole fits (B) and sensor topography maps (C) of these sensor peaks place these sources in the contralateral (left) hemisphere.
Sensor recordings from the hemisphere contralateral to the digit stimulated were chosen to determine the ECD of the strongest source. The position and orientation of the ECD corresponding to the early response was first found and then fixed. Another dipole corresponding to the late response was then added with the early one fixed. Dipoles corresponding to the ipsilateral early and late responses were then fitted and fixed successively (Figure 2B). Only sources with high goodness of fit (>85%) were accepted. Once a source was identified, the same dipole location was applied across the three conditions. The response latencies and amplitude (defined through the dipole moment (Q) of the source in nAm, see Hämäläinen et al., 1993) for all four dipole locations (contralateral S1, contralateral S2/PV, ipsilateral S1, ipsilateral S2/PV) were estimated for each different stimulus condition at the fixed source location based on the peaks within the early and late time periods in each hemisphere.
Statistical analysis of the somatosensory MEG data was performed using SPSS version 16 (SPSS, Chicago, IL). Spatial coordinates (x, y, z) of dipole source localizations were compared between groups using two-tailed paired (within-group) and unpaired (control vs. tspFHD) t-tests. ANOVAs were used to assess the statistical significance of the response amplitude (Q, in nAm) and latencies (in milliseconds) at these peaks in S1 and S2/PV with factors: group (tspFHD affected hand, tspFHD unaffected hand, healthy controls), condition (low rate, high rate, oddball), and hemisphere (contralateral, ipsilateral). Post hoc t-tests with a Bonferroni correction for multiple comparisons were then performed with a significance threshold of p≤0.05.
Correlation and Regression Analysis of Imaging Data with Clinical Performance Measures
The relationship between somatosensory MEG measures and clinical performance measures in the focal hand dystonia group was analyzed using the Pearson product-moment correlation coefficient in SPSS with significance set at p≤0.05. Additionally a feedforward stepwise linear regression analysis was performed to determine if clinical parameters could predict aberrant somatosensory processing variables for latency and dipole source strength on the contralateral and ipsilateral sides of the affected and unaffected hand. The affected hand and unaffected hand of subjects with focal hand dystonia were analyzed separately. Clinical performance measures included composite scores for function, sensation, motor speed, strength, and motor control. Somatosensory MEG measures included response amplitude (Q) and latency at peak amplitude. Only the MEG measures that differed significantly between tspFHD subjects and healthy controls in the group comparison were entered into the correlation and linear regression analyses.
Results
Fifteen patients with tspFHD were recruited for this study. From this group, thirteen right-hand affected subjects (9 males, 4 females; mean age 45.0 ± 10.4 years) were selected to participate in the MEG somatosensory paradigm and a battery of clinical measures. One subject was excluded because a structural MRI could not be obtained. A second subject was also excluded due to the presence of a pre-existing neurological disorder (eg. seizure disorder). Characteristics of the subjects are summarized in Table 1. Eleven subjects were right handed and two subjects were left handed. Seven subjects had writer's cramp, four subjects had musician's dystonia and two subjects had dystonia related to keyboarding. Thirteen volunteers (9 males, 4 females; mean age ± SD, 38.0 ± 10.0 years) served as healthy controls for the somatosensory paradigm. Healthy control subjects were age- and sex-matched to the tspFHD group. Eight control subjects were right handed and five subjects were left handed. Right and left handed subjects were included since no effect of handedness has been shown using this somatosensory paradigm (Zhu et al., 2007). Age did not differ significantly across groups. All subjects with focal hand dystonia and healthy volunteers gave written consent for the study as approved by the Committee on Human Research of the University of California, San Francisco.
Table 1.
Description of subjects with focal hand dystonia.
| Patient | Affected Hand | Dominant Hand | Target Task | Gender (M/F) |
Age (years) |
Most Affected Digit | Severity |
|---|---|---|---|---|---|---|---|
| 1 | Right | Left | Writing/Typing | M | 63 | D3 | Severe |
| 2 | Right | Right | Writing | M | 53 | D3 | Severe |
| 3 | Right | Right | Writing | M | 41 | D2 | Severe |
| 4 | Right | Right | Guitar | M | 48 | D3 | Severe |
| 5 | Right | Right | Typing | M | 43 | D2 | Severe |
| 6 | Right | Right | Writing | F | 46 | D2 | Moderate |
| 7 | Right | Right | Writing/Typing | M | 27 | D2 | Moderate |
| 8 | Right | Left | Piano | F | 60 | D4 | Moderate |
| 9 | Right | Right | Drums | M | 53 | D2 | Severe |
| 10 | Right | Right | Writing/Typing | M | 36 | D2 | Moderate |
| 11 | Right | Right | Writing | F | 40 | D2 | Severe |
| 12 | Right | Right | Guitar | M | 32 | D2 | Severe |
| 13 | Right | Right | Writing | F | 43 | D2 | Moderate |
| Healthy Controls | N/A | 8 R/5 L | N/A | 9M/4F | 24-66 | N/A | N/A |
Somatosensory Dipole Localizations
Dipole localization using co-registration of MEG data with structural MRI scans verified activation in the primary somatosensory cortex for the early response (30-70msecs) and secondary somatosensory cortex/parietal ventral area for the late response (70-130msecs). Group averaged amplitude (root mean square, [RMS]) responses to the oddball condition time-locked to stimulus onset (0 msecs) are illustrated in Figure 3. The grand mean amplitude (RMS) and latency of an early (S1) and late (S2/PV) evoked response to stimulation of the affected and unaffected hand of tspFHD subjects compared with healthy controls can be visualized in both the hemisphere contralateral (Figure 3A) and ipsilateral (Figure 3B) to the stimulated digit. Similar characteristic waveforms were generated for the low rate and high rate conditions. Spatial coordinates (x/y/z plane) for the dipole source location of S1 did not differ between the contralateral and ipsilateral responses for either right- or left-hand digit stimulation (all p's>0.15). Similarly, coordinates for the S2/PV source (x/y/z plane) did not differ between contralateral and ipsilateral dipole locations (all p's>0.05).
Figure 3.

Average amplitude (RMS) over time: Oddball condition. Average of the peak sensor amplitude (RMS: root mean square) from the time of the somatosensory stimulus at 0 msecs to 150 msecs after the stimulus for the ipsilateral (A) and contralateral (B) hemispheres. (B) is represented for the affected hands of subjects with tspFHD, the unaffected hands of subjects with tspFHD, and the right and left hands of healthy volunteers. The approximate early (S1) and late (S2/PV) peaks are marked (in red lines). Similar waveforms occur for both the low rate and high rate conditions.
Activation Levels in Primary Somatosensory Cortex (S1)
Mean response amplitude (Q) values and standard errors for contralateral and ipsilateral S1 are shown in Figures 4A and B respectively for tspFHD affected hand, tspFHD unaffected hand and the average of right and left hands for healthy controls for all three conditions (low rate, high rate, oddball). ANOVA revealed no significant interactions or differences in response amplitude between groups for either contralateral or ipsilateral S1 (Figures 4A,B).
Figure 4.

Dipole Moment (SQ) in S1 and S2/PV. Average of the peak sensor dipole moment (Q) for the ipsilateral and contralateral early S1 (30-70msecs) and late S2/PV (70-130msecs) responses under the three experimental conditions is compared between the affected hands of subjects with tspFHD, the unaffected hands of subjects with tspFHD, and the right and left hands of healthy volunteers. The three experimental conditions include the deviant stimuli at low rate (condition 1 in Figure 1, mean ISI: 2 secs), the deviant plus the standard stimuli or oddball condition (condition 3 in Figure 1, mean ISI: 0.33 secs), the deviant at high rate (condition 2 in Figure 1, mean ISI: 0.33 secs). Asterisks indicate the responses that are significantly different (p<0.05) from others that are connected by lines. A) Average dipole moment of contralateral S1 to the hand stimulated. B) Average dipole moment of ipsilateral S1 to the hand stimulated. C) Average dipole moment of contralateral S2/PV to the hand stimulated. D) Average dipole moment of ipsilateral S2/PV to the hand stimulated.
Activation Levels in Secondary Somatosensory Cortex and Parietal Ventral Area (S2/PV)
Mean response amplitude (Q) values and standard errors for contralateral and ipsilateral S2/PV in response to the three stimulus types are shown in Figures 4C and D respectively for tspFHD affected hand, tspFHD unaffected hand and the average of right and left hands for healthy controls. ANOVAs revealed a significant effect of group (p<0.001), condition (p<0.001) and hemisphere (p<0.050) for response amplitude, and a significant interaction between group and hemisphere (p=0.040) and hemisphere and condition (p=0.001). Post-hoc analyses (p≤0.05 after Bonferroni correction) revealed greater response amplitude of the evoked field in both contralateral and ipsilateral S2/PV for the affected hands of subjects with tspFHD compared with healthy controls for the high rate condition (Figure 4C,D). Post-hoc analyses also revealed greater response amplitude (Q) for the unaffected hands of subjects with tspFHD compared with healthy controls for the high rate condition in contralateral S2/PV (p≤0.05 after Bonferroni correction (Figure 4C) but not in ipsilateral S2/PV (Figure 4D). There were no significant differences in response amplitude between groups for the low rate condition in contralateral or ipsilateral S2/PV (Figure 4C,D).
Activation Timing in Primary Somatosensory Cortex (S1)
Response latency values (mean and standard errors) at peak amplitudes for contralateral and ipsilateral S1 for the three stimulus types are shown in Figures 5A and B for tspFHD affected hand, tspFHD unaffected hand and the average of right and left hands for healthy controls. ANOVAs revealed a significant effect of group (p<0.001) and hemisphere (p<0.050) and no significant interactions (all p>0.05) for response latency. Post-hoc analyses revealed a significantly later peak amplitude in contralateral S1 for the unaffected hands of subjects with tspFHD compared with healthy controls for the low rate condition and for both the affected hands of subjects with tspFHD compared with healthy controls and the unaffected hands of subjects with tspFHD compared with healthy controls for the oddball condition (p≤0.05 after Bonferroni correction) (Figure 5A). Although the response latencies were also later in tspFHD subjects for the high rate condition in contralateral S1, the differences between groups were not significant. However post-hoc analyses did reveal a significantly later latency at peak amplitude in ipsilateral S1 for the high rate condition for the affected hand of subjects with tspFHD compared with healthy controls (p≤0.05 after Bonferroni correction) (Figure 5B). There were no significant differences in the latencies between groups for the low rate and oddball conditions in ipsilateral S1.
Figure 5.

Latency of S1 and S2/PV responses. Average latency at the peak sensor amplitude (RMS) for the ipsilateral and contralateral early S1 (30-70msecs) and late S2/PV (70-130 msecs) responses under three experimental conditions is compared between the affected hands of subjects with tspFHD, the unaffected hands of subjects with tspFHD, and the right and left hands of healthy volunteers. The three experimental conditions include the deviant stimuli at low rate (condition 1 in Figure 1, mean ISI: 2 secs), the deviant plus the standard stimuli or oddball condition (condition 3 in Figure 1, mean ISI: 0.33 secs), the deviant at high rate (condition 2 in Figure 1, mean ISI: 0.33 secs). Asterisks indicate the responses that are significantly different (p<0.05) from others that are connected by lines. A) Average latency in contralateral S1 to the hand stimulated. B) Average latency in ipsilateral S1 to the hand stimulated. C) Average latency in contralateral S2/PV to the hand stimulated. D) Average latency in ipsilateral S2/PV to the hand stimulated.
Activation Timing in Secondary Somatosensory Cortex and Parietal Ventral Area (S2/PV)
Mean latency values at peak amplitudes and standard errors for contralateral and ipsilateral S2/PV are shown in Figures 5C and D for tspFHD affected hand, tspFHD unaffected hand and the average of right and left hands for healthy controls. ANOVAs revealed a significant effect of group (p<0.050) and condition (p<0.050) and no significant interactions (all p>0.05). Post-hoc analyses revealed no significant differences in latencies in contralateral S2/PV between groups. Post-hoc analyses showed a significantly later latency in ipsilateral S2/PV for the affected hand of subjects with tspFHD compared with healthy controls for the high rate condition while the latency for the low rate condition in the affected hands of subjects with tspFHD was significantly earlier than healthy controls (p≤0.05 after Bonferroni correction) (Figure 5D). There were no significant differences in the latency between groups for the oddball condition in ipsilateral S2/PV.
Differences in Clinical Performance Measures
In the tspFHD group, correlations (Pearson's r) between clinical composite scores (sensory, motor, strength, CAFÉ 40) were conducted in order to estimate the degree of independence between these measures. No significant correlations were observed between any two measures for either performance with the affected or unaffected hand (all r<0.5). The average scores for each of the clinical measures in the subjects with tspFHD are displayed with average scores of healthy controls from historical normative data in Figure 6. Significant differences between groups were calculated using the standard error of the mean to account for differences in sample sizes. Individuals with tspFHD performed poorly on tests of sensory acuity (graphesthesia, stereognosis) with both the affected and unaffected hands, compared to healthy controls. For measures of motor speed, those in the tspFHD group were significantly faster in the digital reaction time test while using either hand. While no significant difference was seen in pinch strength (3 jaw chuck or lateral) lumbrical strength was significantly weaker for both hands in the tspFHD group. Similarly, ratings of task-specific motor performance were significantly higher in the tspFHD group when performing the behavior with either the affected or unaffected hand, indicating poor motor skill during the task. No significant difference was seen in functional status/Quality of Life as assessed by the Café 40.
Figure 6.

Clinical performance measures. Average clinical measures for tspFHD affected hand, tspFHD unaffected hand, and normative data from healthy controls including (A) sensory measures of graphesthesia and stereognosis, (B) motor speed measures of tapping speed using a Tapper and digital reaction time measured with a stopwatch, (C) grip, 3 chuck pinch, lateral pinch, and lumbrical strength, and (D) functional independence measured by the Café 40 questionnaire.
Correlation and Linear Regression Analyses
The correlations made between the behavioral performance measures and the MEG measures that differed significantly between tspFHD subjects and healthy controls are summarized in Table 2. A correlation of 0.5 was considered clinically significant (explains 25% of the variance). There were seven correlations where r>0.50, but only three of these were statistically significant (p<0.05). Three of the response latency effects correlated with sensory or motor variables (Table 2, Figure 6). There were no clinically or statistically significant correlations between clinical measures and amplitude differences.
Table 2.
Pearson's correlation coefficients for the affected hands and unaffected hands of subjects with tspFHD for the conditions found to be significantly different than healthy controls in the MEG somatosensory paradigm (Q, latency). A single asterisk indicates the correlations that are statistically significant (p<0.05). Double asterisks indicate the correlations that are clinically significant (r>0.05).
| Sensory Score | Motor Score | Strength | Function | Task-Specific Motor Control | |
|---|---|---|---|---|---|
| Q | |||||
| High rate condition, contralateral hemisphere, S2/PV, affected digits | -.33 | -.19 | .02 | .23 | .48 |
| High rate condition, contralateral hemisphere, S2/PV, unaffected digits | -.47 | -.25 | .25 | -.03 | na |
| High rate condition, ipsilateral hemisphere, S2/PV, affected digits | -.56** | -.26 | -.02 | -.09 | .55** |
| Latency | |||||
| Low rate condition, contralateral hemisphere, S1, unaffected digits | -.04 | .39 | .13 | .14 | na |
| Oddball condition, contralateral hemisphere, S1, affected digits | -.49 | -.26 | -.04 | -.17 | .45 |
| Oddball condition, contralateral hemisphere, S1, unaffected digits | .04 | .12 | .13 | -.35 | na |
| High rate condition, ipsilateral hemisphere, S1, affected digits | .59* | .17 | .30 | .05 | -.24 |
| Low rate condition, ipsilateral hemisphere, S2/PV, affected digits | -.03 | .58* | .56* | .53** | .47 |
| High rate condition, ipsilateral hemisphere, S2/PV, affected digits | .09 | .14 | .17 | .28 | .51** |
Sensory Measures
There was a statistically significant correlation between the sensory score (sum of percent correct answers for graphesthesia and stereognosis) for the affected hand and the latency in ipsilateral S1 for the high rate condition (Figure 6A). A higher sensory score was associated with a longer latency at peak amplitude. There were no other statistically significant correlations between clinical sensory measures and MEG measures. The sensory score was also a significant predictor of the latency in ipsilateral S1 of the affected hand for the high rate condition using the stepwise linear regression model (Beta=0.6, p<0.05).
Motor Speed Measures
There was a statistically significant correlation between motor speed score (average sum of tapper and digital reaction) for the affected hand and the latency in ipsilateral S2/PV for the low rate condition (Figure 6B). High motor speed scores (faster motor speed) were associated with increased ipsilateral S2/PV latency in the affected hand. There were no other statistically significant correlations between clinical motor speed measures and MEG measures. Motor speed was not a significant predictor of the sensory MEG measures using the stepwise linear regression model.
Strength Measures
There was a statistically significant correlation between the strength (average sum of grip, 3 jaw chuck pinch, lateral pinch, and lumbrical strength) of the affected hand and the latency in ipsilateral S2/PV for the low rate condition (see Figure 6C). Stronger grip, pinch, and lumbricals were associated with increased latency in ipsilateral S2/PV. There were no other statistically significant correlations between strength and MEG measures. Using the stepwise linear regression model, strength was not a significant predictor of the sensory MEG measures.
Quality of Life Measures and Task-Specific Performance
As there were no statistically significant correlations between the Café 40 and MEG measures, this functional score did not predict any of the sensory MEG scores. While there were clinically important correlations between task-specific motor control and sensory MEG measures (r>0.5 between task specific motor control and high rate ipsilateral response amplitude (Q) and ipsilateral latency in S2/PV for the affected digits), these correlations were not statistically significant. Task-specific motor control was not a significant predictor of the sensory MEG measures using stepwise linear regression.
Discussion
The present study used MEG to isolate unique patterns of cortical somatosensory processing in subjects with task-specific focal hand dystonia. These patterns included alterations in the amplitude (dipole moment strength) and latency of activity in both S1 and S2/PV, in both the hemisphere contralateral and ipsilateral to the most affected hand. Activation in these regions depended on the type of stimuli being delivered to the hand. Specifically, latency differences in contralateral S1 were present in the low rate and oddball conditions, while latency differences in ipsilateral S1 and S2/PV were present in the high rate condition. The amplitude of activity in S2/PV was greater in tspFHD bilaterally in response to high-rate stimulation, but only ipsilaterally during the mismatch condition. The amplitude and latency of activity in the ipsilateral hemisphere (both S1 and S2/PV) correlated with clinical measures (sensory, motor, strength) as well as accurately predicted sensory performance in this patient group. Therefore, this increase in latency and amplitude of an evoked response in the ipsilateral hemisphere are directly related to sensorimotor impairments found in task-specific focal hand dystonia. These findings provide evidence to accept our hypotheses that i) individuals with tspFHD show an abnormal dipole moment strength and response latency in S1 and S2/PV bilaterally, and that ii) processing impairments in the ipsilateral hemisphere are directly related to impacted sensory and motor abilities.
Abnormal amplitude of activation in the somatosensory cortices of subjects with tspFHD
We did not find any significant differences in the amplitude (dipole moment strength) of the response in S1 between subjects with tspFHD and healthy controls for low rate, high rate, or novel stimuli. This suggests the altered spatial representations well-characterized in tspFHD (Byl et al., 1996; Elbert et al., 1998) do not necessarily have an effect on the amplitude of cortical activity in S1, independent of the rate of stimulation (high vs. low) or the context (e.g. novel) in which the stimuli are delivered. Although previous studies have reported increased SEF response amplitude to moderately paced stimuli (albeit in less severly affected cases of tspFHD, see McKenzie et al., 2003) this finding is consistent with previous work examining these response properties in this population (Byl et al., 2002). Given that a large amount of somatosensory information is processed serially from S1 to S2/PV (Blatow et al., 2007; Manzoni et al., 1989; Disbrow et al., 2003), one could hypothesize that the amplitude of the response in S2/PV should be consistent with the lack of amplitude changes in S1. However increased dipole moment strength (Q) for high rate stimulation was observed in contralateral S2/PV for both affected and unaffected hands of subjects with tspFHD. Previous studies using fMRI have reported a decrease in activation in contralateral S2/PV during vibratory tactile stimulation (Butterworth et al., 2003). This discrepancy may be due to either differences between the two imaging modalities (BOLD signal in fMRI vs. dipole strength MEG) or differences between the type of tactile stimulus presented (tactile vibration vs. pneumatic taps). Furthermore, an increase in S2/PV response amplitude was only identified in our own study in response to high rate stimulation (Figure 4). It is likely that, in tspFHD, aberrant activation levels are present only during rapid changes in pressure against the skin, with an increase in activity at frequency ranges ∼0.3Hz and a decrease in activity at higher frequencies (vibration). Like contralateral S2/PV, ipsilateral S2/PV response amplitude was abnormally high in the patient group only during high-rate stimulation. However, this increased response amplitude was only statistically significant when the affected hand was stimulated. Abnormal activation in S2/PV (and not S1) may be due to direct, parallel inputs from thalamic nuclei to cortical fields within the Sylvian fissure. Increased thalamic receptive field size has been reported in both thalamotomy studies of tspFHD (Lenz et al., 1999) and non-human primate models of task-specific focal hand dystonia (Blake et al., 2002). Therefore, it is highly likely that this abnormal activity in patients with tspFHD is dependent on an interaction between S2/PV and structures other than S1.
Abnormal latency of activation in the somatosensory cortices of subjects with tspFHD
Although we only observed an increase in response amplitude in S2/PV, there were significant differences in response latency in both S1 and S2/PV in patients with tspFHD. These changes were dependent on the type of tactile stimuli being delivered. In contralateral S1, a late response latency was identified in the tspFHD patients following low rate and novel stimuli (Figure 5). This increased latency may be a result of expanded, overlapping receptive fields in S1 that may contribute to the increased processing time for tactile input. This is consistent with previous work by Byl and colleagues (2003) who reported a trend towards increased latencies in contralateral S1 (although earlier latencies in S1 have also been reported, see Byl et al. 2002). Interestingly, a delay in contralateral S1 activity did not seem to influence the timing of activity in S2/PV of the same hemisphere, with peak latency of the S2/PV region comparable to controls across the three conditions. Preserved S2/PV response latency in tspFHD in spite of a delay of activity in S1 suggests that compensatory mechanisms (possibly coming from parallel inputs from thalamic nuclei) maintain a proper timing of activation in this region. A divergent pattern is seen in the ipsilateral hemisphere, with an increase in S1 response latency coincident with an increase in the latency of the S2/PV response, but only for high-rate tactile stimulation of the affected hand (Figure 5). A delay in ipsilateral (but not contralateral) S1 and S2/PV activity indicates that serial interactions between these two regions are compromised when processing specific categories of stimuli.
Additionally the timing of processing between S1 and S2/PV may be faster in subjects with tspFHD when the tactile stimulus is not associated with the target task. This would be indicative of normal plasticity. There were earlier latencies in ipsilateral S1 (although not significant) and significantly earlier latencies in ipsilateral S2/PV for low rate stimulation to the affected hands of subjects with tspFHD. This early activity in ipsilateral S2/PV may contribute to clinical parameters of motor speed (Figure 7B) and lumbrical strength (Figure 7C). This correlation between cortical activity and behavioral performance speaks to the possibility that, in tspFHD, rapid reaction times develop at a cost to grip strength in the affected hand and that this relationship is mediated by a rapid S2/PV response in the ipsilateral hemisphere.
Figure 7.

Scatter plots of the significant correlations (p<0.05) between MEG measures and clinical performance measures. A) Correlation between the sensory score (sum of the percentage correct answers for the measures of graphesthesia and stereognosis) and the latency at the peak amplitude in ipsilateral S1 of the hand stimulated for the high rate condition in the affected hands of subjects with tspFHD. B) Correlation between the motor score (sum of the average scores of the finger tapper and stopwatch) and the latency at the peak amplitude in ipsilateral S2/PV of the hand stimulated for the low rate condition in the affected hands of subjects with tspFHD C) Correlation between the sum strength score (grip, 3 jaw chuck pinch, lateral pinch, and lumbricals) and the latency at the peak amplitude in ipsilateral S2/PV of the hand stimulated for the low rate condition in the affected hands of subjects with tspFHD.
Relationship between clinical measures and MEG sensory measures
Clinically our subjects displayed similar impairments in performance measures as reported in previous studies (Byl et al., 2002, McKenzie et al., 2003, 2009). Interestingly, many of these clinical deficits strongly correlated with the timing of activity in S1 and S2/PV. For example, we found that increased latency in ipsilateral S1 for the high rate condition correlated with higher sensory function (improved accuracy). Interestingly, these clinical sensory function scores (stereognosis, graphesthesia) were able to act as predictors for this abnormally late ipsilateral S1 response. A similar correlation was seen between increased ipsilateral S2/PV response latency and faster motor speed and higher strength. Perhaps the increased processing time in ipsilateral S1 and ipsilateral S2/PV are compensatory mechanisms to improve sensory discrimination and sensory feedback between S2/PV and the premotor cortex. Alternatively increased latency in ipsilateral S1 and S2/PV could indicate an attempt to improve intracortical inhibition and sensorimotor processing.
Although not statistically significant we found several other correlations of clinical significance (r>0.5, explaining 25% of the variance; Table 2). A correlation between latency in ipsilateral S2/PV (high rate, affected hands) with both scores on the Café 40 and motor control at the target task could suggest that increased processing time is associated with better clinical performance. In addition a correlation between ipsilateral S2/PV amplitude (high rate) and motor control at the target task suggests that increased activity enhances intracortical inhibition and more precise motor control.
Clinical Implications
While sensory and motor retraining paradigms that target and remediate abnormal activation patterns have been used clinically to restore function in patients with tspFHD, these approaches have only been partially effective in remapping the response properties of cortical fields in contralateral S1 (Byl et al., 2002, 2003; Candia et al., 2003; Zeuner et al., 2005). This current imaging study confirms that aberrant neurophysiology extends well beyond contralateral S1 to both S2/PV and ipsilateral regions and includes changes in both response amplitude as well as latency for both affected and unaffected hands. These findings suggest retraining may need to be bilateral, potentially simultaneous and include the domains of sensory processing (e.g. light touch) as well as cortical sensory processing (e.g. graphesthesia and stereognosis). Increased response amplitude in S2/PV bilaterally for both affected and unaffected hands suggests high levels of sensory processing targeting S2/PV (e.g. object discrimination, haptic exploration, and Braille reading). These elements of the retraining should be emphasized, possibly through a focus on tactile discrimination across both hands in order to quiesce abnormal response amplitude in S2/PV. Longer latencies in ipsilateral S1 and S2/PV, which are associated with better clinical performance across sensory discrimination, motor speed and strength, are of particular interest If these pathways involve forms of inhibition and selectivity in the sensory (S1 and S2/PV) domain then it could be of value to activate these ipsilateral pathways to provide appropriate sensory feedback to the motor system for the initiation of desired, voluntary movements. However it is not clear how to specifically activate and retrain the ipsilateral pathways. Although it is not clear if bilateral practice would help activate the ipsilateral pathways to increase inhibition, evidence suggests that rehabilitation of both hemispheres would improve remediation of the most affected body structure. In patients after stroke, bilateral repetitive transcranial magnetic stimulation improved motor performance of the affected hemiparetic hand (Takeuchi et al., 2009). As our sample included both patients with writer's and musician's cramp, bilateral training could be applied to either group, as behavioral interventions have been shown to be effective across both categories of hand dystonia (McKenzie et al., 2009).
Limitations of the study
Although the findings of the present study clearly demonstrate significant differences in the way tactile inputs are processed in S1 and S2/PV in tspFHD, there are some limitations to interpreting these findings. These limitations may have contributed to some of the more subtle (and often nonsignificant) effects observed in our dataset. For example, a handful of consistent, clinically important correlations between task-specific performance and evoked responses (latency and dipole moment strength) did not reach significance in our cohort. This trend in the data could be improved by employing a more sensitive (perhaps kinematic) measure of task-specific motor performance (as is used in Spector et al., 2007). In addition, although clinically significant, there were no statistically significant correlations between the MEG measures and functional independence/quality of life as assessed with the Café 40 questionnaire. This may be a result of a ceiling effect of the Café 40 in this group of subjects, as all of the patients were functioning at a level similar to healthy adults. It could also be argued that group differences we observe in the MEG sensor data are due to changes in tactile sensory threshold levels (given that tspFHD participants were grossly impaired in measures of tactile acuity, and that the same stimulation level (17psi) was used across the two groups). However, very specific changes in response amplitude and latency were dependent on the type of stimulus (low rate, high rate, oddball) delivered to the digits, making it unlikely that these changes are due to stimulus detection levels alone. It is also possible that the subjective sensory threshold, which varies from participant to participant, could account for some of the effects observed in our study. Engaging the sensory system through behaviors such as active movement can magnify the amplitude of the response in both S1 and S2/PV (Mima et al., 1999). Recent work in MEG has shown that the perceptual strength of a sensory stimulus can influence response properties, particularly in S2/PV, where parameters such as attention can magnify a sensory response (Fujiwara et al., 2002). It is also possible that certain cognitive parameters, such as attention (as in the oddball condition) could shift source location in S2/PV. Furthermore, it is possible that mild, involuntary contractions of the affected hand observable through EMG during MEG recording might contribute to changes in the SEF (such as “gating” effects present even during passive movements of the hand, see Kakigi et al., 2000). This is unlikely as, in tspFHD, it has been shown that there is minimal coherence between EMG recordings from the hand and MEG evoked fields (Tecchio et al., 2008). Although our sample size was more than sufficient for a neuroimaging study (N=13/group) it is also possible that these trends in the data may become more pronounced with either a larger or more homogenous sample.
Future Directions and Conclusion
The evoked responses to tactile stimulation identified in MEG data can be used as identifiers of cortical plasticity and are modifiable following a treatment intervention in tspFHD (McKenzie et al., 2003). Future work using MEG will allow us to track changes in the amplitude and latency of responses in these regions following intervention. The stabilization of abnormal sensory responses should occur within the response properties of specific brain areas that correlate with clinical parameters. Learning-based sensorimotor training (LBSMT) is one rehabilitative intervention designed to target sensory discrimination and task-specific motor behavior in tspFHD (Zeuner et al., 2005; Byl et al., 2009). It would be important to carry out a longitudinal study that tracks both improvement in task specific performance and changes in response amplitude and latency following LBSMT in this patient group.
Based on the results of the present study, it is evident that abnormal sensory processing in tspFHD extends beyond contralateral primary somatosensory cortex. In fact, deviations in response timing and amplitude are more pronounced in S2/PV, particularly in the ipsilateral hemisphere, where latency differences correlate with compromised manual ability. It is not clear how these abnormal response properties interact with or are dependent on processes such as intracortical inhibition, somatosensory topography or functions within the motor system. Existing models of tspFHD postulate that abnormal processing and increased gain in the somatosensory system contribute to increased activity in the motor system and aberrant muscle contractions (Sanger et al., 2000). Further exploration into this interaction between the sensory and motor systems is necessary to understand the complex pathophysiology behind this debilitating condition.
Highlights.
This study explores processing anomalies in somatosensory cortex in task-specific focal hand dystonia (tspFHD) using magnetoencephalography (MEG),
In tspFHD, deviations in response latency and amplitude were identified in both primary and secondary somatosensory cortex across the two hemispheres (ipsi- and contralateral to the affected hand).
Aberrant response properties are certainly related to impairments of tactile acuity, motor speed and strength; information that can be used to guide future behavioral interventions.
Acknowledgments
Funding: This work was supported by National Institutes of Health [R01DC4855, R01DC6435 and NIH/NCRR UCSF-CTSI grant UL1 RR024131 to S.S.N.]; a Dystonia Medical Research Foundation Fellowship awarded to L.B.N.H. and grants from the Dana Foundation.
Footnotes
Publisher's Disclaimer: This is a PDF file of an unedited manuscript that has been accepted for publication. As a service to our customers we are providing this early version of the manuscript. The manuscript will undergo copyediting, typesetting, and review of the resulting proof before it is published in its final citable form. Please note that during the production process errors may be discovered which could affect the content, and all legal disclaimers that apply to the journal pertain.
References
- Altenmüller E, Jabusch HC. Focal hand dystonia in musicians: phenomenology, etiology and psychological trigger factors. J Hand Ther. 2009;22(2):144–154. doi: 10.1016/j.jht.2008.11.007. [DOI] [PubMed] [Google Scholar]
- Bara-Jimenez W, Shelton P, Sanger TD, Hallett M. Sensory discrimination capabilities in patients with focal hand dystonia. Ann Neurol. 2000;47:377–380. [PubMed] [Google Scholar]
- Bara-Jiminez W, Shelton P, Hallett M. Spatial discrimination is abnormal in focal hand dystonia. Neurology. 2000;12:1869–1873. doi: 10.1212/wnl.55.12.1869. [DOI] [PubMed] [Google Scholar]
- Barbe MF, Barr AE, Gorzelany I, Amin M, Gaughen JP, Safadi FF. Chronic repetitive reaching and grasping results in decreased motor performance and widespread tissue responses in a rat model of MSD. J Orthop Res. 2003;21(1):167–76. doi: 10.1016/S0736-0266(02)00086-4. [DOI] [PMC free article] [PubMed] [Google Scholar]
- Blake DT, Byl NN, Cheung S, Bedenbaugh P, Nagarajan S, Lamb M, et al. Sensory representation abnormalities that parallel focal hand dystonia in a primate model. Somatosens Mot Res. 2002;19(4):347–357. doi: 10.1080/0899022021000037827. [DOI] [PMC free article] [PubMed] [Google Scholar]
- Blatow M, Nennig E, Durst A, Sartor K, Stippich C. fMRI reflects functional connectivity of human somatosensory cortex. Neuroimage. 2007;37:927–936. doi: 10.1016/j.neuroimage.2007.05.038. [DOI] [PubMed] [Google Scholar]
- Bohannon RW. Stopwatch for measuring thumb movement time. Percept Mot Skills. 1995;81:123–126. doi: 10.2466/pms.1995.81.1.211. [DOI] [PubMed] [Google Scholar]
- Burke RE, Fahn S, Marsden CD, Bressman SB, Moskowitz C, Friedman J. Validity and reliability of a rating scale for the primary torsion dystonias. Neurology. 1985;35:73–77. doi: 10.1212/wnl.35.1.73. [DOI] [PubMed] [Google Scholar]
- Butterworth S, Francis S, Kelly E, McGlone F, Bowtell R, Sawle GV. Abnormal cortical sensory activation in dystonia: an fMRI study. Mov Disord. 2003;186:673–682. doi: 10.1002/mds.10416. [DOI] [PubMed] [Google Scholar]
- Byl NN, Hamati D, Wilson F. The sensory consequences of repetitive strain injury in musicians: Focal dystonia of the hand. JBack Musculoskeletal Rehabil. 1996;7:27–39. doi: 10.3233/BMR-1996-7105. [DOI] [PubMed] [Google Scholar]
- Byl NN, Merzenich MM, Jenkins WM. A primate genesis model of focal hand dystonia and repetitive strain injury: 1. Learning-induced dedifferentiation of the representation of the hand in the primary somatosensory cortex in adult monkeys. Neurology. 1996;47(2):508–520. doi: 10.1212/wnl.47.2.508. [DOI] [PubMed] [Google Scholar]
- Byl NN, Leano J, Cheney LK. The Byl-Cheney-Boczai Sensory Discriminator: Reliability, validity, and responsiveness for testing stereognosis. J Hand Ther. 2002:315–330. doi: 10.1016/s0894-1130(02)80003-5. [DOI] [PubMed] [Google Scholar]
- Byl NN, Nagarajan SS, Merzenich MM, Roberts T, McKenzie A. Correlation of clinical neuromusculoskeletal and central somatosensory performance: variability in controls and patients with severe and mild focal hand dystonia. Neural Plast. 2002;9:177–203. doi: 10.1155/NP.2002.177. [DOI] [PMC free article] [PubMed] [Google Scholar]
- Byl NN, Nagarajan SS, McKenzie AL. Effect of sensory discrimination training on structure and function in patients with focal hand dystonia: A case series. Arch Phys Med Rehabil. 2003;84:1505–1514. doi: 10.1016/s0003-9993(03)00276-4. [DOI] [PubMed] [Google Scholar]
- Byl NN. Focal Dystonia. In: Mackin EJ, Callahan AD, Skirven TM, Schneider LH, Osterman AL, editors. Rehabilitation of the Hand and Upper Extremity. Mosby Publishers; 2004. pp. 2053–2075. [Google Scholar]
- Byl NN. Aberrant learning in individuals who perform repetitive skilled hand movements: Focal hand dystonia—Part 2. J of Bodyw Mov Ther. 2006;10(4):261265. [Google Scholar]
- Byl NN, Merzenich MM, Cheung S, Bedenbaugh P, Nagarajan SS, Jenkins WM. A primate model for studying focal dystonia and repetitive strain injury: effects on the primary somatosensory cortex. Phys Ther. 2007;77(3):269–284. doi: 10.1093/ptj/77.3.269. [DOI] [PubMed] [Google Scholar]
- Byl NN, Archer ES, McKenzie A. Focal hand dystonia: effectiveness of a home program of fitness and learning-based sensorimotor and memory training. J Hand Ther. 2009;22(2):183–197. doi: 10.1016/j.jht.2008.12.003. [DOI] [PubMed] [Google Scholar]
- Candia V, Wienbruch C, Elbert T, Rochstroh B, Ray W. Effective behavioral treatment of focal hand dystonia in musicians alters somatosensory cortical organization. PNAS. 2003;100(13):7942–7946. doi: 10.1073/pnas.1231193100. [DOI] [PMC free article] [PubMed] [Google Scholar]
- Charness ME, Ross MH, Shefner JM. Ulnar neuropathy and dystonic flexion of the fourth and fifth hand: clinical correlation in musicians. Muscle and Nerve. 1996;19:431–437. doi: 10.1002/mus.880190403. [DOI] [PubMed] [Google Scholar]
- Dilks L. Validity study of the Western Psychological Services finger tapping test. Am J of Psychol Res. 2006;2:8–13. [Google Scholar]
- Disbrow E, Litinas E, Recanzone GH, Padberg J, Krubitzer L. Cortical connections of the second somatosensory area and the parietal ventral area in macaque monkeys. J Comp Neurol. 2003;462(4):382–399. doi: 10.1002/cne.10731. [DOI] [PubMed] [Google Scholar]
- Elbert T, Candia V, Altenmuller E, Rau H, Sterr A, Rockstroh B, et al. Alteration of digital representations in somatosensory cortex in focal hand dystonia. NeuroReport. 1998;9:3571–3575. doi: 10.1097/00001756-199811160-00006. [DOI] [PubMed] [Google Scholar]
- Fujiwara N, Imai M, Nagamine T, Mima T, Oga T, Takeshita K, et al. Second somatosensory area (SII) plays a significant role in selective somatosensory attention. Brain Res Cogn Brain Res. 2002;14:389–397. doi: 10.1016/s0926-6410(02)00141-6. [DOI] [PubMed] [Google Scholar]
- Fung S, Byl N, Melnick M, Callahan P, Selinger A, Ishii K, et al. Functional outcomes: The development of a new instrument to monitor the effectiveness of physical therapy. Eur J Phys Med Rehabil. 1997;2:31–41. [Google Scholar]
- Gasser T, Windgassen K, Bereznai B, Kabus C, Ludolph AC. Phenotypic expression of the DYT1 mutation: a family with writer's cramp of juvenile onset. Ann Neurol. 1998;44(1):126–128. doi: 10.1002/ana.410440119. [DOI] [PubMed] [Google Scholar]
- Hämäläinen H, Kekoni J, Sams M, Reinikainen K, Naatanen R. Human somatosensory evoked potentials to mechanical pulses and vibration: contributions of SI and SII somatosensory cortices to P50 and P100 components. Electroencephalogr Clin Neurophysiol. 1990;75:13–21. doi: 10.1016/0013-4694(90)90148-d. [DOI] [PubMed] [Google Scholar]
- Hämäläinen H, Hari R, Ilmoniemi RJ, Knuutila J, Lounasmaa OV. Magnetoencephalography—theory, instrumentation, and applications to noninvasive studies of the working brain. Rev Mod Phys. 1993;65:413–497. [Google Scholar]
- Hari R, Forss N. Magnetoencephalography in the study of human somatosensory cortical processing. Lond B Biol Sci. 1999;354(1387):1145–1154. doi: 10.1098/rstb.1999.0470. [DOI] [PMC free article] [PubMed] [Google Scholar]
- Hinkley LB, Krubitzer LA, Nagarajan SS, Disbrow EA. Sensorimotor Integration in SP, PV, and Parietal rostroventral areas of the human sylvian fissure. J Neurophysiol. 2007;97:1288–1297. doi: 10.1152/jn.00733.2006. [DOI] [PMC free article] [PubMed] [Google Scholar]
- Jabusch HC, Muller SV, Altenmuller E. Anxiety in musicians with focal dystonia and those with chronic pain. Mov Disord. 2004;19:1169–1175. doi: 10.1002/mds.20110. [DOI] [PubMed] [Google Scholar]
- Jankovic J. Can Peripheral Trauma Induce Dystonia and Other Movement disorders? Yes! Mov Disord. 2001;16:7–12. doi: 10.1002/1531-8257(200101)16:1<7::aid-mds1005>3.0.co;2-0. [DOI] [PubMed] [Google Scholar]
- Kakigi R, Hoshiyama M, Shimojo M, Naka D, Yamasaki H, Watanabe S, et al. The somatosensory evoked magnetic fields. Prog Neurobiol. 2000;61:495–523. doi: 10.1016/s0301-0082(99)00063-5. [DOI] [PubMed] [Google Scholar]
- Lenz FA, Byl NN. Reorganization in the cutaneous core of the human thalamic principal somatic sensory nucleus (ventral caudal) in patients with dystonia. J Neurophysiol. 1999;82:3204–3212. doi: 10.1152/jn.1999.82.6.3204. [DOI] [PubMed] [Google Scholar]
- Manzoni T, Fabri M, Conti F. The colossal connections of the primary somatosensory cortex and the neural basis of midline fusion. Exp Brain Res. 1989;76:251–266. doi: 10.1007/BF00247886. [DOI] [PubMed] [Google Scholar]
- McKenzie AL, Nagarajan SS, Roberts TP, Merzenich MM, Byl NN. Somatosensory representation of the hand in clinical performance in patients with focal hand dystonia. Am J Phys Med Rehabil. 2003;82(10):737–749. doi: 10.1097/01.PHM.0000087458.32122.14. [DOI] [PubMed] [Google Scholar]
- McKenzie AL, Goldman S, Barrango C, Shrime M, Wong T, Byl NN. Differences in physical characteristics and response to rehabilitation for patients with hand dystonia: musician's cramp compared to writer's cramp. J Hand Ther. 2009;22(12):172–181. doi: 10.1016/j.jht.2008.12.006. [DOI] [PubMed] [Google Scholar]
- Meunier S, Garnero L, Ducorps A, Mazieres L, Lehericy S, du Montcel ST, et al. Human brain mapping in dystonia reveals both endophenotypic traits and adaptive reorganization. Ann Neurol. 2001;50:521–527. doi: 10.1002/ana.1234. [DOI] [PubMed] [Google Scholar]
- Mertens M, Lutkenhoner B. Efficient neuromagnetic determination of landmarks in the somatosensory cortex. Clin Neurophysiol. 2000;111(8):1478–1487. doi: 10.1016/s1388-2457(00)00349-7. [DOI] [PubMed] [Google Scholar]
- Mima T, Sadato N, Yazawa S, Hanakawa T, Fukuyama H, Yoshiharu Y, et al. Brain structures related to active and passive finger movements in man. Brain. 1999;122:1989–1997. doi: 10.1093/brain/122.10.1989. [DOI] [PubMed] [Google Scholar]
- Nelson AJ, Blake DT, Chen R. Digit-specific aberrations in the primary somatosensory cortex in Writer's cramp. Ann Neurol. 2009;66(2):146–54. doi: 10.1002/ana.21626. [DOI] [PubMed] [Google Scholar]
- Opavsky R, Hlustik P, Kanovsky P. Cortical Plasticity and its implications for focal hand dystonia. Biomed Pap Med Fac Univ Palacky Olomouc Czech Repub. 2006;150(2):223–226. doi: 10.5507/bp.2006.031. [DOI] [PubMed] [Google Scholar]
- Peolsson A, Hedlund R, Oberg B. Intra- and inter-tester reliability and reference values for hand strength. J Rehab Med. 2001;33:36–41. doi: 10.1080/165019701300006524. [DOI] [PubMed] [Google Scholar]
- Quartarone A, Rizzo V, Bagnato S, Morgante F, Sant'Angelo A, Romano M, et al. Homeostatic-like plasticity of the primary motor hand area is impaired in focal hand dystonia. Brain. 2005;128:1943–1950. doi: 10.1093/brain/awh527. [DOI] [PubMed] [Google Scholar]
- Rosset-Llobet J, Candia V, Fabregas i Molas S, Dolors Rosines I Cubells D, Pascual-Leone A. The challenge of diagnosing focal hand dystonia in musicians. Eur J Neurol. 2009;(16):864–869. doi: 10.1111/j.1468-1331.2009.02610.x. [DOI] [PMC free article] [PubMed] [Google Scholar]
- Sanger TD, Merzenich MM. Computational model of the role of sensory disorganization in focal task-specific dystonia. J Neurophysiol. 2000;84(5):2458–2464. doi: 10.1152/jn.2000.84.5.2458. [DOI] [PubMed] [Google Scholar]
- Simonetta-Moreau M, Lourenco G, Sangla S, Mazieres L, Vidailhet M, Meunier S. Lack of inhibitory interaction between somatosensory afferent inputs and intracortical inhibitory interneurons in focal hand dystonia. Mov Disord. 2006;21(6):824–834. doi: 10.1002/mds.20821. [DOI] [PubMed] [Google Scholar]
- Spector JT, Branforbrener AG. Methods of evaluation of musician's dystonia: critique of measurement tools. Mov Disord. 2007;22(3):309–312. doi: 10.1002/mds.21214. 15. [DOI] [PubMed] [Google Scholar]
- Stinear JW, Byblow WD. Impaired modulation of corticospinal excitability following subthreshold rTMS in focal hand dystonia. Hum Mov Sci. 2004;23(3-4):527038. doi: 10.1016/j.humov.2004.08.022. [DOI] [PubMed] [Google Scholar]
- Takeuchi N, Tada T, Toshima M, Matsuo Y, Ikoma K. Repetitive transcranial magnetic stimulation over bilateral hemispheres enhances motor function and training effect of paretic hand in patients after stroke. J Rehabil Med. 2009;41(13):1049–1054. doi: 10.2340/16501977-0454. [DOI] [PubMed] [Google Scholar]
- Tamura Y, Ueki Y, Lin P, Vorbach S, Mima T, Kakigi R, et al. Disordered plasticity in the primary somatosensory cortex in focal hand dystonia. Brain. 2009;132:749–755. doi: 10.1093/brain/awn348. [DOI] [PMC free article] [PubMed] [Google Scholar]
- Tecchio F, Melgari JM, Zappasodi F, Porcaro C, Milazzo D, Cassetta E, et al. Sensorimotor integration in focal task-specific hand dystonia: A magnetoencephalagraphic assessment. Neuroscience. 2008;154(2):563–571. doi: 10.1016/j.neuroscience.2008.03.045. [DOI] [PubMed] [Google Scholar]
- Tempel LW, Perlmutter JS. Abnormal cortical responses in patients with Writer's cramp. Neurology. 1993;44(11):2252–57. doi: 10.1212/wnl.43.11.2252. [DOI] [PubMed] [Google Scholar]
- Zeuner KE, Shill HA, Sohn YH, Molloy FM, Thornton BC, Dambrosia JM, et al. Motor training as treatment in focal hand dystonia. Mov Disord. 2005;20(3):335–341. doi: 10.1002/mds.20314. [DOI] [PubMed] [Google Scholar]
- Zhu Z, Disbrow EA, Zumer JM, McGonigle DJ, Nagarajan SS. Spatiotemporal integration of tactile information in human somatosensory cortex. BMC Neuroscience. 2007;8:21. doi: 10.1186/1471-2202-8-21. [DOI] [PMC free article] [PubMed] [Google Scholar]