Abstract
Dispersion in a commercial polymeric monolith was simulated on a sample geometry obtained by direct imaging using high-resolution electron microscopy. A parallelized random walk algorithm, implemented using a velocity field obtained previously by the lattice-Boltzmann method, was used to model mass transfer. Both point particles and probes of finite size were studied.
Dispersion simulations with point particles using periodic boundaries resulted in plate heights that varied almost linearly with flow rate, at odds with the weaker dependence suggested by the experimental observations and predicted by theory. This discrepancy resulted from the combined effect of the artificial symmetry in the velocity field and the periodic boundaries implemented to emulate macroscopic column lengths. Eliminating periodicity and simulating a single block length instead resulted in a functional dependence of plate heights on flow rate more in accord with experimental trends and theoretical predictions for random media. The lower values of the simulated plate heights than experimental ones are attributed in part to the presence of walls in real systems, an effect not modeled by the algorithm. On the other hand, analysis of transient dispersion coefficients and comparison of lateral particle positions at the entry and exit hinted at non-asymptotic behavior and a strong degree of correlation that was presumably a consequence of preferential high-velocity pathways in the raw sample block.
Simulations with finite-sized probes resulted in particle trajectories that frequently terminated at narrow constrictions of the geometry. The amount of entrapment was predicted to increase monotonically with flow rate, evidently due to the relative contributions to transport of convection that carries particles to choke-points and diffusion that dislodges these entrapped particles. The overall effect is very similar to a flow-dependent entrapment phenomenon previously observed experimentally for adenovirus.
Keywords: Monolith, CIM disk, dispersion, random walk, image-based simulation, entrapment
1. Introduction
Chromatographic monoliths are contiguous blocks of solid with a macroporous network permitting bulk flow of liquids, which promotes convective transport throughout the geometry. The flow and mass transfer characteristics of these media have been characterized extensively by experiment, through application of analytical tools and concepts developed for packed particle beds. For instance, peak broadening behavior is often expressed in terms of the plate height equation attributed to van Deemter [1]:
| (1) |
Here h is the reduced plate height, expressed as a function of the reduced velocity or Péclet number given by
| (2) |
where uzavg is the average axial velocity, de the equivalent particle diameter and Dm the molecular diffusivity of the solute. The constants A, B and C in eqn. (1) are parameters that characterize the strengths of the individual contributions to axial dispersion due to convective effects, molecular diffusion and solute transport and adsorption at the particle interface and within particles. Experimentally obtained reduced HETP (h) curves in both polymeric [2–6] and silica [7–9] monoliths suggest that the role of interphase mass transfer (the C term) is diminished and the contribution of mechanical dispersion (the A term) to the overall plate height is higher, compared to the case for packed beds.
Eqn. (1) and extensions such as the Knox equation [10] are useful for basic evaluation of performance, for example when used for comparisons among different types of monoliths or different solutes [11,12], but its predictive power remains limited since A, B and C are essentially treated as fitting parameters. More detailed microscopic models based on the underlying convective, mass transfer and adsorption phenomena are available and frequently used, such as the coupling model of Giddings [13], which identifies several length scales of interaction among the dispersion sources. However, these are also based on assumptions about the geometry and the corresponding flow field and involve several additional parameters, the values of which must be assumed or obtained experimentally.
More rigorous approaches start from the complete set of transport equations, incorporating varying degrees of detail. Analytical solutions of the complete transport equations, such as those of the general rate model, remain intractable and numerical solutions introduce complexities of their own such as numerical dispersion [14,15]. Therefore, simplifications are often made, for example by utilizing lumped parameters such as a constant axial dispersion coefficient that has to be determined by experiment [16,17], assuming radial homogeneity, and simplifying the transport equations by ignoring effects of certain physical phenomena based on their expected contribution to the band profiles.
A complete interpretation of observed transport and adsorption phenomena thus requires consideration of the fundamental underlying microscopic mechanisms [12,18], which are intimately linked to the interaction of flow and dispersion with the explicit geometry under consideration [13,19,20]. In complex geometries such as those of the monoliths, the motivation to start from the detailed microstructure arises not only from the need to reproduce the correct functional dependence among macroscopic variables but also because certain medium-specific phenomena appear to be effected by the geometry itself. For example, results of virus pulse injections in polymeric monoliths exhibit a decrease of exit peak area with increasing flow rate, in what is apparently a reversible mechanical entrapment of the solute in the stationary-phase structure [21]. The proposed explanation for this phenomenon hinges upon the nature of the steric interaction of virus particles with the narrow pores of the monolith, an effect that can only be assessed and predicted by a pore-scale view of transport.
Advances in imaging methods and the capabilities of computational hardware and software have enabled detailed analyses employing explicit pore-scale representations of complex geometries. Simulation methods based on such direct structural information are now well established, and have been used successfully to model flow and dispersion in diverse geometries such as fractal constructs [22], sphere packs [23–36], internal networks of porous particles [37] and more recently a silica monolith [20,38]. In a previous article [39], we presented results for the simulation of flow in a three-dimensional reconstruction of a sample block (Figure 1) of a commercially available polymeric monolith disk, the CIMTM disk from BIA Separations, using the lattice-Boltzmann (LB) methodology. In this work, the findings of the flow simulation are utilized to model dispersion in the same structure, for point and finite-size solute particles.
Figure 1.
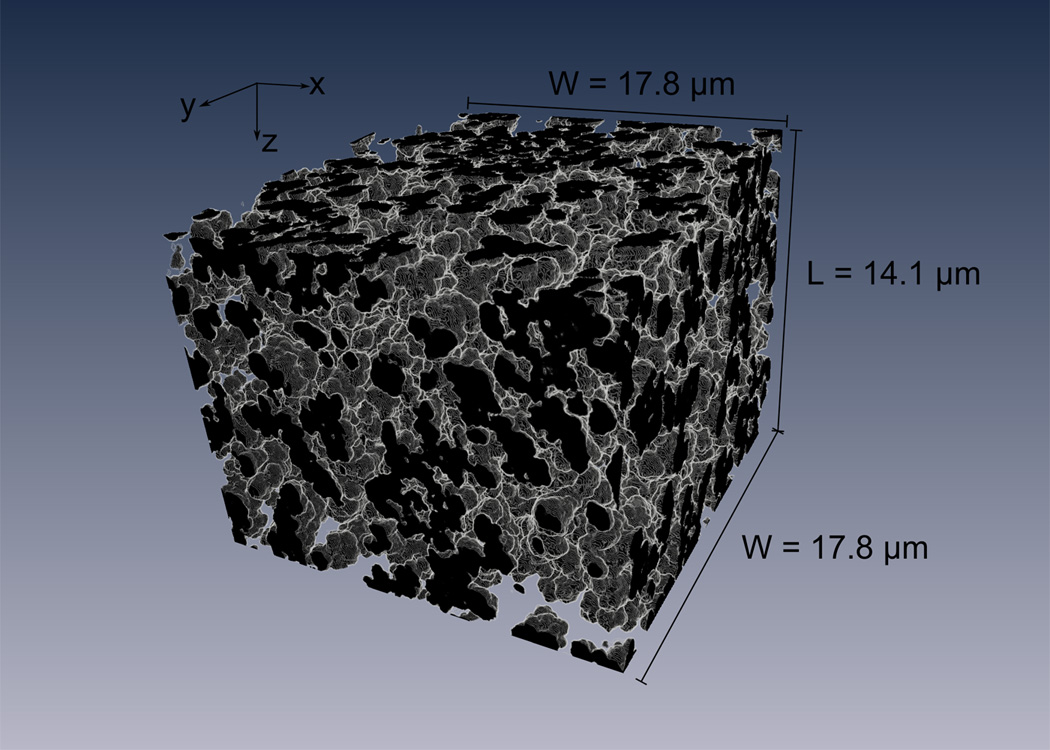
A rendering of the reconstructed monolith structure, with the length (L) and width (W) dimensions indicated. Black is solid.
A Lagrangian particle tracking method, more generally referred to as a random walk algorithm, is used for simulation of mass transfer, whereby individual trajectories of a large number of particles are utilized to simulate bulk dispersion. This class of methods is based on the mathematical theory of Brownian motion established by Einstein [40] and Langevin [41], and has been widely applied to the more general problem of solving the convection-diffusion equation [22–32,34,35,39–42]. The random walk method avoids the problems of numerical dispersion and stability suffered by finite-element and finite-difference methods at high Péclet numbers [24], and provides an intuitive particle-based model of transport that can be implemented on top of an existing flow model [42]. The algorithm as used in this study does have its limitations: particle-particle interactions are ignored, the flow field is uncoupled from particle motion (in that the particles cannot alter the velocity field) and it may be difficult to implement bulk concentration-dependent phenomena such as chemical reactions. However, for simulations involving dilute pulse injections of unretained solutes, as is the case for this study, these constraints are not as relevant.
2. Materials and Methods
2.1 Sample Geometry and Flow
The preparation, serial-section imaging and image processing of the sample were described in the previous article [39]. The ‘raw’ block of Figure 1 obtained thus had dimensions 962×962×756 voxels (17.8 µm × 17.8 µm × 14.1 µm in x, y and z respectively). As in the modeling of flow, the geometry used for the dispersion simulations was obtained by ‘mirroring’ this raw-block in all three dimensions in order to achieve edge-to-edge continuity of the structure, resulting in a final sample geometry of 1922×1922×1510 voxels (35.6 µm × 35.6 µm × 28.2 µm).
The calculation of the velocity distribution within the reconstructed monolith has also been described in detail previously [39]. For the base case of the LB simulations, flow within the mirrored block was modeled for a preset pressure drop of 15.9 kPa along the axial direction. The mobile phase was assumed to be water with a kinematic viscosity (ν) of 10−6 m2/s. Within the calculated flow field, the local Reynolds number (Rei = (de · ui)/ν, for pore velocity ui with an equivalent particle diameter, de, of 1.9 µm) at even the highest pore velocities remains below 0.025, hence creeping flow can be assumed, allowing the detailed velocity distribution at other imposed pressure drops to be obtained simply by linear scaling.
2.2 Random Walk Simulations
The discretized form of generalized stochastic differential equation for the motion of a single particle [43,44] is the basis for the random walk simulation of dispersion. Solving this equation for a large number of particles amounts to solving the probabilistic Fokker-Planck equation (FPE) of an ensemble [43,44], which in turn is analogous to obtaining the solution for the convection-diffusion equation [42,45,46]. The temporal variation of particle coordinates can be expressed by:
| (3) |
Here r is the particle coordinate vector, u the local velocity vector as defined by the flow field, Dm the molecular diffusion coefficient of the simulated particles and Δξ1 a random normal deviate. In this formulation, the displacement of a particle at each step reflects the sum of individual convective and diffusive contributions.
In the specific implementation of the random-walk algorithm employed in this work, local velocity values were obtained by a first-order trilinear interpolation of the scaled LB flow field values. To avoid overshoot errors [46], the fixed time step Δt was chosen sufficiently small so that at the largest local velocity of the highest flow rate, a particle cannot traverse more than a fraction of one voxel in a single step, in analogy with the Courant-Friedrichs-Lewy criterion [47]. To simulate macroscopic column lengths, periodic boundary conditions were employed in three dimensions, meaning that particles that exit from either side of the block are reintroduced from the corresponding opposite edge. Collisions with solid walls were handled using simple bounce-back [48].
Because of the considerable size (about 166 GB) of the geometry and velocity information that had to be loaded into memory for fast and efficient processing of data, a parallel implementation was used. The parallelization of the random walk algorithm of this study closely follows that of Schure et al. [28]. The parallel code was written in Fortran 90, compiled using the Portland Group Inc. Fortran compiler and run on a Redhat Linux cluster of 16 quad-core Dell R610 computers equipped with 3.0 GHz Intel Xeon processors and 3.0 GB of RAM per processor. The computers were interconnected with 10-Gigabit Ethernet switches and inter-processor communication was implemented by the message passing interface (MPI) protocol [49] routines.
As a fixed column length (Lc) was simulated in all runs, the wall time varied inversely with the simulated average velocity. For the highest velocity setting (uzavg = 0.0195 m/s) the average wall time was 4.5 hours for a single run with 5000 particles and a time step of 10−8 s.
2.3 Plate Heights and Axial Dispersion Coefficients
At the end of each run, the simulated elution curve was obtained as an exit time distribution histogram compiled from individual elution times of the particles. The average retention time and the plate heights were calculated from the first and second moments of the exit time distribution. The average retention time is given as:
| (4) |
where N is the number of particles and ti are the particle exit times. The (reduced) plate heights are calculated by:
| (5) |
The related axial dispersion coefficient Dax and its normalized value D*ax are then obtained from h using:
| (6) |
2.4 Emulation of Probes of Finite Size
To represent the interaction of probes of finite size with the monolith, the geometry was transformed to simulate the diminished pore volume accessible to the center of mass of a probe with a finite size, as opposed to the full pore space that can be sampled by a point probe. This was implemented by eroding the pore volume with a structuring element equivalent to the probe of finite size [50–52]. An example application is in Figure 2, which shows a two-dimensional cross-section of a monolith sample that has been eroded by a three-dimensional spherical probe with a diameter of 5 voxels. The white regions indicate the portions of the pore space that have been eroded from the raw geometry, i.e., transformed into solid, illustrating the slightly diminished volume accessible to the finite-sized probe. The velocity distribution remains unchanged regardless of the size and shape of the probe, consistent with the aforementioned assumption of the flow field being uncoupled from mass transfer.
Figure 2.
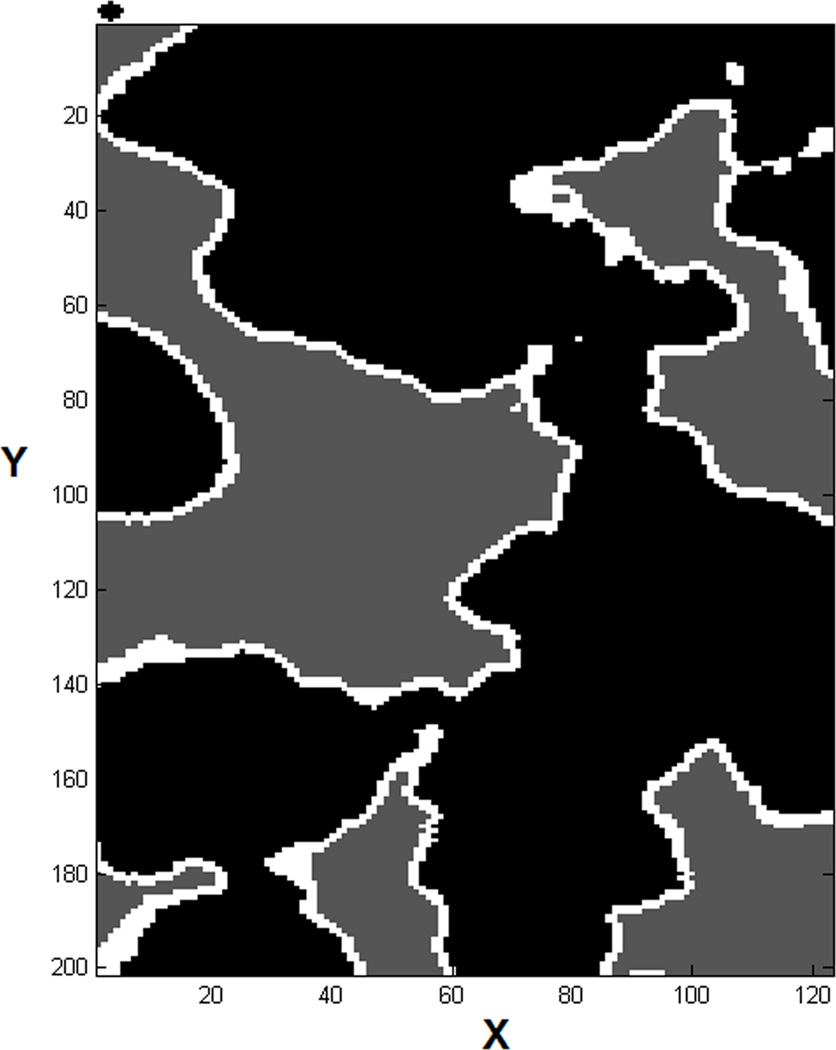
A two-dimensional portion of a section of the sample geometry eroded by a spherical probe with a diameter of 5 voxels, a cross-section of which is shown to scale above the top left corner of the image. The black regions indicate the pre-erosion solid geometry while the white outline represents the pore geometry that has been transformed into solid after erosion. The remaining pore space after erosion is shown as dark gray.
The erosion procedure can require considerable computing time depending on the size of the probe, and a new geometry has to be generated for every unique probe size and shape, but the benefit is a simpler code structure and the (generally) increased speed of the simulations due to the avoidance of a computationally expensive collision detection algorithm invoked at each step.
3. Results and Discussion
3.1 Dispersion of Point Particles at Macroscopic Column Length Scales
Prior to the simulation of mass transfer in the monolith sample, the random walk code was validated using simpler systems for which analytical solutions of both the velocity field and the dispersion coefficients were available [53,54]. The computed results for asymptotic dispersion in Poiseuille flow in cylindrical tubes, square ducts and infinite parallel plates showed excellent agreement with the analytical solutions.
For simulations in the monolith sample, a generic point particle with a molecular diffusivity of 1.0·10−10 m2/s was assumed, as an approximation of small to medium molecular weight proteins such as lysozyme (Dm = 1.1·10−10 m2/s [55]) and ovalbumin Dm = 0.8·10−10 m2/s [56]). The range of the flow rates and the corresponding Re and Pe values are displayed in Table 1. This range was chosen to include the flow rates used in the experimental work of Trilisky et al. [21,57] using the same monolith. However, the highest flow rate (uzavg = 0.0195 m/s) is outside the recommended operating conditions of the CIM disk, and was included as a hypothetical case to investigate the model behavior at extreme conditions.
Table 1.
The range of flow rates simulated for the point particle runs
Re = (de · uzavg)/ν, with de = 1.9 µm and ν = 10−6 m2/s. uzavg is the average axial pore velocity
Eqn. (2) with de = 1.9 µm and Dm = 10−10 m2/s
The trajectories of 5000 point particles in a column length 0.005 m were simulated for each run. The default time step was 10−8 s, although a larger value of 10−7 s was used for flow rates corresponding to Pe values smaller than 0.37. For all velocities, the average retention time calculated by eqn. (4) deviated from the value based on the column length and average velocity by less than 1.0 percent.
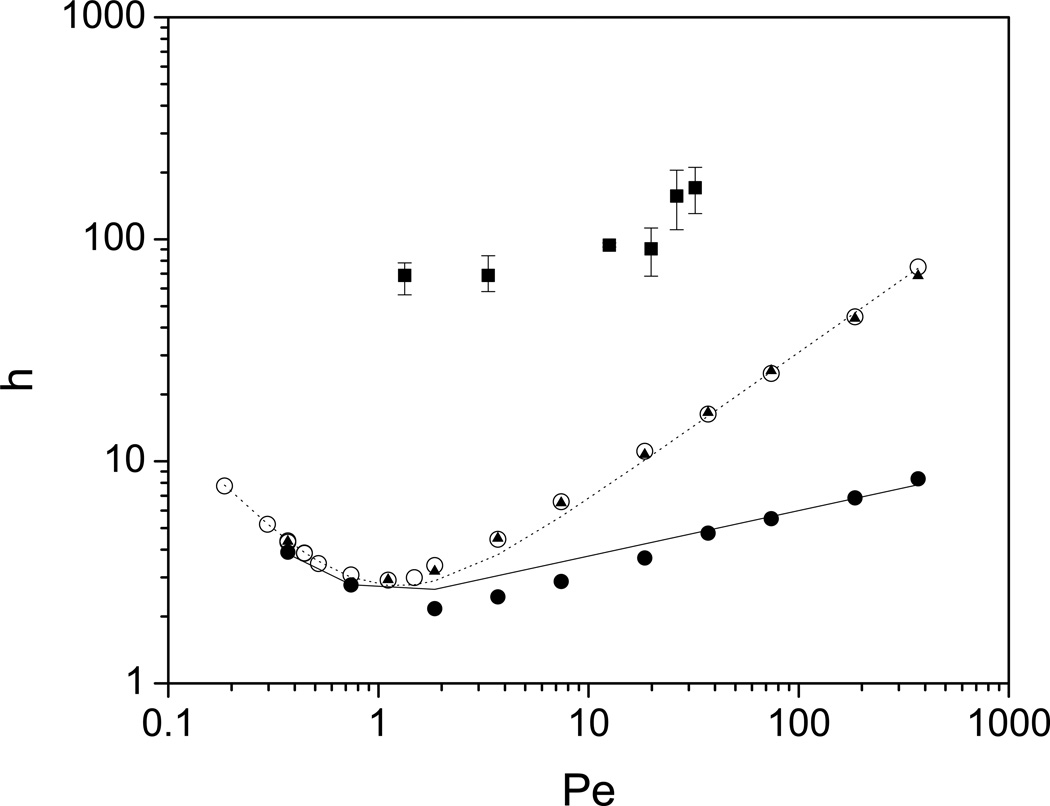
The reduced plate heights for column simulations using two different time steps of 10−8 and 10−7 s were calculated using eqn. (5), and are displayed in Figure 3. Reduced HETP data for an additional simulation set, designated as the ‘single-block’ data, are also plotted and discussed in section 3.2. For all simulation sets, curve fits of the data (dashed and continuous curves) were obtained using a variation of the Knox equation, where the linear term in Pe, identical to the C-term in the van Deemter equation (eqn. (1)), was removed, i.e.:
| (7) |
In the original formulation of Knox [10], the exponent n was set at 0.33 but we treat it as an adjustable parameter here.
Figure 3.
The plate height curves for point-size probe column simulations with two different time steps, Δt = 10−8 s (▲) and Δt = 10−7 s (○); the single-block simulation set (●); the modified Knox fits to the simulation data (the dashed and continuous lines), and the experimental results (■) of Trilisky et al. for ovalbumin [55].
The data points for the two simulation sets employing the different time steps show that the algorithm is largely insensitive to Δt for the values tested. The most noticeable difference is at the highest flow rate, presumably because the highest values of the velocity field for the larger Δt of 10−7 s are expected to result in Courant numbers slightly higher than one, likely giving rise to overshoot errors.
The topmost data set in Figure 3 displays experimentally obtained results for h [58] for ovalbumin in the CIM monolith. These data were recomputed from the original so that all plate heights and Pe numbers were based on the value of equivalent diameter obtained in the current study. Compared to the experimental data, it is obvious that the particle simulations do not capture the physical dispersion behavior. Part of the discrepancy can be ascribed to flow non-idealities that are not accounted for in the model, such as the wall effects that are discussed later, but the bigger cause for concern is the appreciable difference in the functional trends between the simulated and experimental data.
Characterizing the dependence of the plate height on Pe is a useful first step in resolving the underlying reasons for this difference. The modified Knox relation of Eqn. (7) yields the fit values of A = 1.43, B = 1.36 and n = 0.667, and captures the trends of the simulation data well over the entire range (Figure 3, dashed line). While the low end of the Pe range follows the molecular diffusion-dominated form as expected, the magnitude of n is surprisingly large, suggesting that axial dispersion scales with Pe1.67 (per eqn. (6)) at high flow rates. This approaches the theoretically predicted value of 2 for flow fields where (lateral) mechanical dispersion is absent and velocity biases among streamlines are eliminated by diffusive motion alone, such as for flow in ordered arrays or for Taylor-like dispersion in ducts and tubes [35,59,60]. As the experimental h values in Figure 3 suggest, however, monolithic media are expected to show behavior more akin to random media, where lateral dispersion scales with the flow rate and contributes to the elimination of velocity bias. This in turn leads to a much weaker dependence of the axial dispersion coefficient, Dax, on flow rate, estimated to vary as Pe1.0 to Pe·ln(Pe), with the latter often approximated by Pe1.2[61–63].
Analysis of particle trajectories, and the local velocity field that forms the deterministic part of the motion, point to the ultimate cause of this unexpectedly strong coupling to Pe. As can be clearly observed for the example depicted in Figure 4a, particle trajectories at high flow rates exhibit a distinct spiral pattern, with the lateral directions reversed periodically. Inspection of lateral components of the flow field indicates that this behavior is caused directly by the velocity field. Figure 4b displays the local x-velocities for two sections of the mirrored sample block: section 250, above the mid-section of the geometry (756 voxels or 14.1 µm) and section 1250, which is below. A reversal of the lateral directions between these sections is evident, the exact location of which is found to be at the half and full mirrored-block lengths. Correspondingly, for simulation of macroscopic lengths with periodic boundaries, the lateral spread of the particles is artificially constrained by the block length, leading to the high scaling of the axial dispersion with flow rate due to an insufficient contribution of lateral dispersion to eliminate velocity biases as mentioned above. It can be noted in each plate of Figure 4b that the local velocities change sign across the centerline of each section as well, that is, an ‘anti-symmetry’ can be identified along the width of the block.
Figure 4.
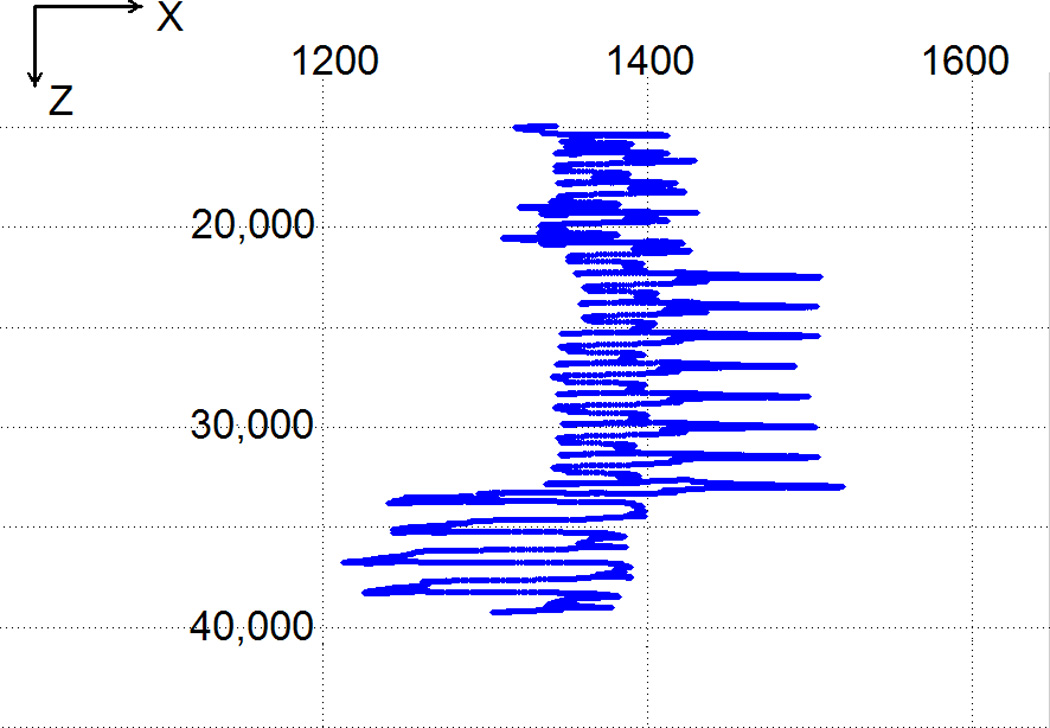
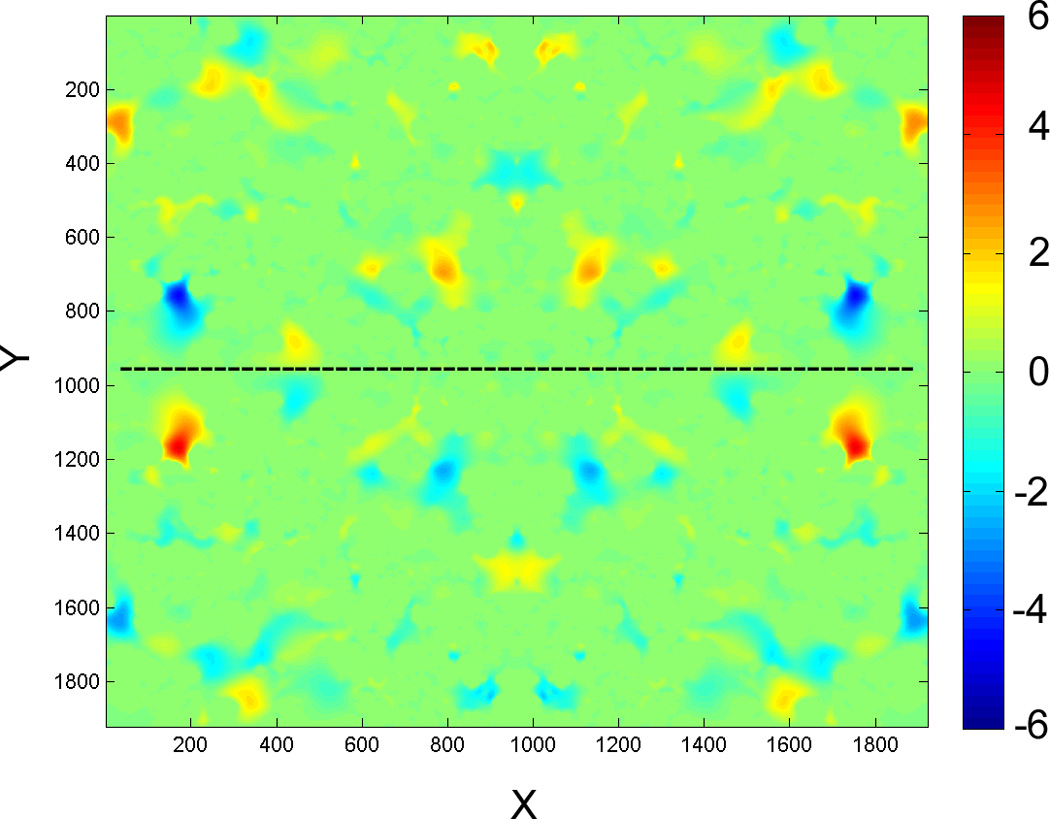
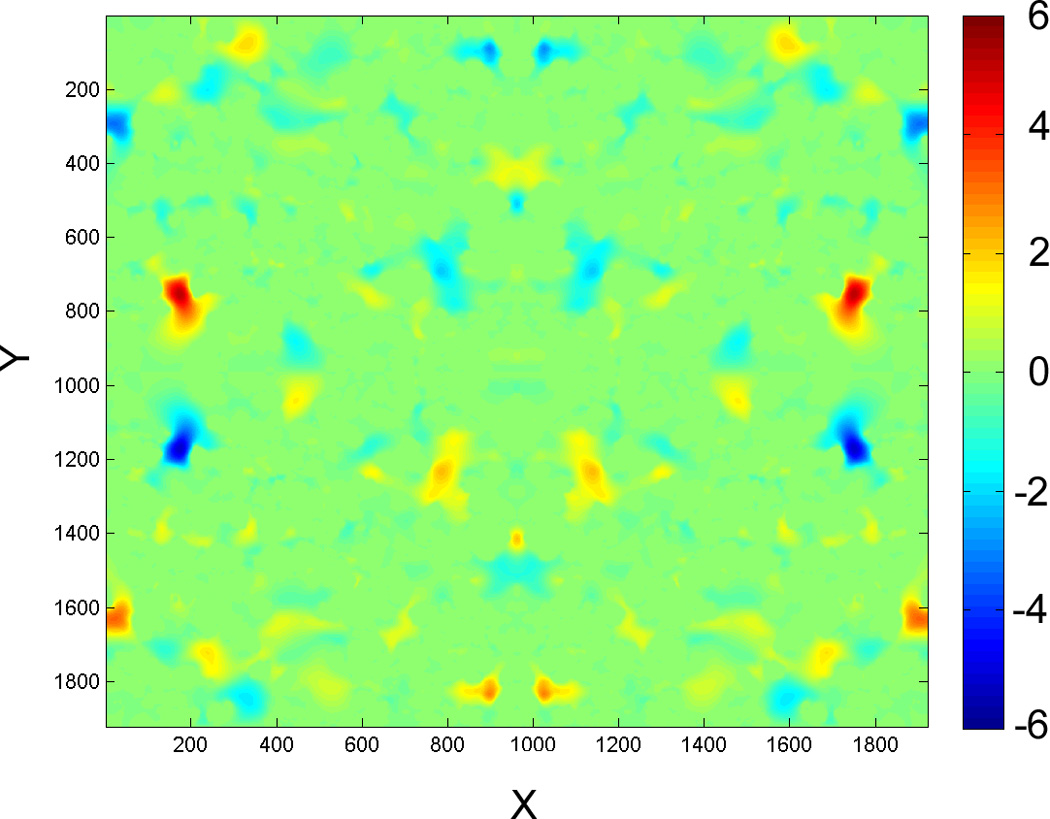
(a) An example trajectory of a particle at Pe = 3710, displaying the x and z coordinates in voxels. (b) Local x-velocity values at section 250 (top, black dashes indicate centerline) and section 1250 (bottom). Color map scale of velocities is identical for both plates.
While the exact reasons for this artificial symmetry are not clear, it can be surmised that the inherent symmetry of the mirrored geometry employed for the flow simulations is the basis for the artifact. An additional complication is that this symmetrical flow distribution is used in conjunction with periodic boundaries, which have previously been reported to cause a spurious contribution to dispersion [24,64] in simulations of random sphere packs. Although a similar contribution could be anticipated for the geometry in this study as well, considering the fact that a particle is exposed to the symmetry immediately and throughout the block length, whereas the effects of periodicity are only ‘felt’ at the block borders, it can be suggested that the constraint of lateral motion via the former effect is the dominant factor in the observed discrepancy.
3.2 Dispersion of Point Particles in a Single Raw Block
To avoid the reversal of lateral particle trajectories at every half-block length of the mirrored structure, an alternative approach was used where the particles were started at the entry section of the raw block of Figure 1 and allowed to stream until reaching its final section, i.e., 756 voxels only, rather than to use the full mirrored block with periodic boundaries in order to simulate a macroscopic column length. In the following discussion, these are referred to as ‘single-block simulations’ to differentiate them from the ‘column’ simulations of the previous section.
The plate height curve obtained for these simulations (Figure 3, continuous curve), indicate that single-block simulation h values are considerably lower than those for the column simulations at mid to high range of the flow rates, and follow a slope more similar to that of the experimental data points. A fit of eqn. (7) this time gives a lower Pe exponent of 0.20, which is essentially the same as the theoretical prediction for random media without liquid holdup [61]. A similarly weak dependence on Pe has been observed in simulations of silica monoliths as well [38].
The discrepancy between the single-block simulation results and the experimental data of Figure 3 may be attributed at least in part simply to the absence of wall effects as mentioned previously. In packed beds, for example, it is known that the packing order close to the wall and the radial stress exerted by the bed on the wall promote a comparatively distorted flow field and increased local plate heights [65–68]. Wall effects have also been observed in silica monoliths [38,69]. The reduced local separation efficiency in the monoliths is attributed to the structural difference between the wall and the core regions caused by the shrinkage of the monolithic rod during the manufacturing process [69], presumably leading to the formation of the large pores observed at the interface of the monolith material and the cladding [38].
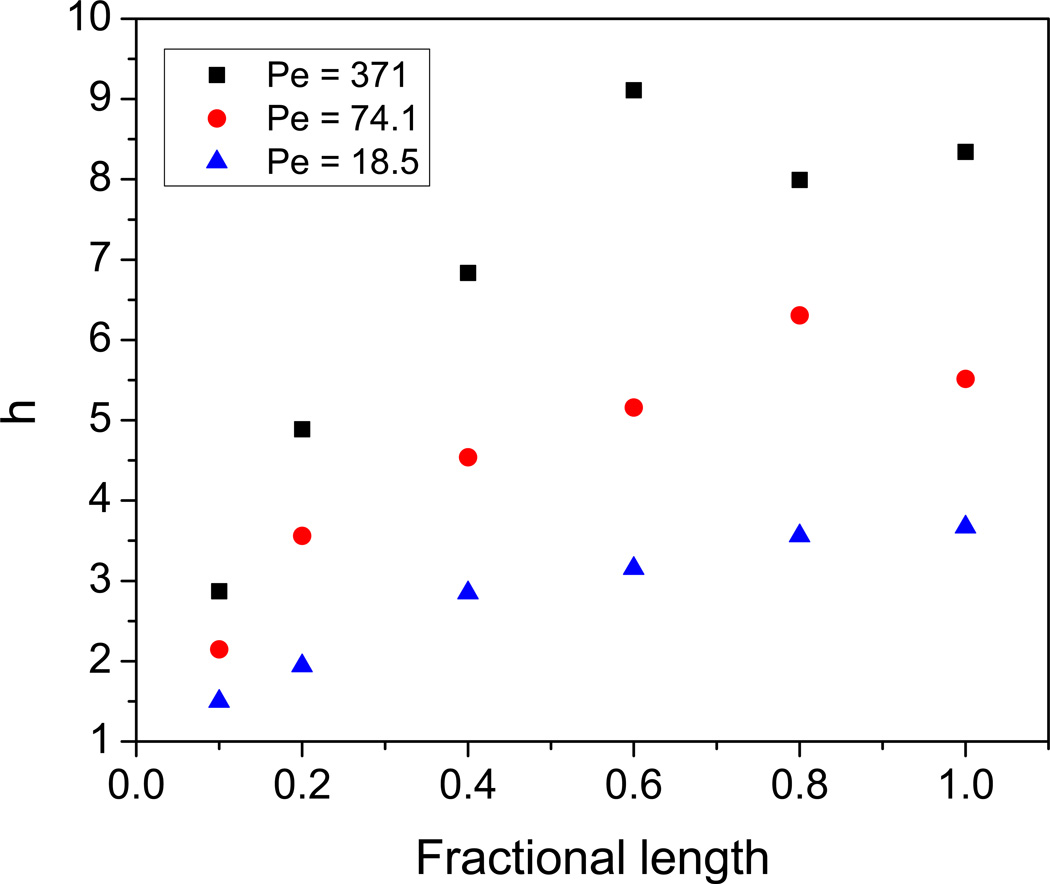
Based on NMR measurements and simulations in packed beds, Scheven et al. proposed that the overall effective dispersion can be expressed as the sum of an intrinsic dispersivity characterizing the homogeneous bulk pore volume and a term to account for flow heterogeneities due to sample morphology, including wall effects [70]. They suggested that for a set flow rate, both of these terms are constant in the asymptotic limit and therefore the overall effective dispersivity exceeds the intrinsic by a fixed amount, which seems consistent with the results in Figure 3 for the experimental values and the simulation results for the single-block. On the other hand, it is important to assess whether the latter correspond to long-time, stable, i.e. asymptotic, dispersion behavior. This was done by simulating lengths smaller than the raw block to obtain plate heights as a function of the fractional block-length. The resultant h curves are displayed in Figure 5 for several flow rates.
Figure 5.
Reduced plate heights as a function of fractional raw-block length (L = 14.1 µm).
Although the trends in this plot suggest that the dispersion values are converging, it is difficult to confirm that the final values at the raw-block length (i.e., corresponding to fractional length 1.0 in the plot) are indeed asymptotic, especially considering the significant scatter at the higher flow rates. A factor that considerably influences the transient evolution of the axial dispersion, warranting further investigation, is the presence of high-velocity pathways within the simulated flow field of the sample block. This key feature of the velocity distribution is illustrated in Figure 6, which plots the local velocity values in the core of the sample block. The high velocities, depicted as bright green, cluster to form channels like the torus-shaped region in the figure. Theoretical analyses indicate that such preferential pathways control the dispersion behavior, as the characteristic length scales are defined by the average distance required by solute particles to sample these paths [26,30].
Figure 6.
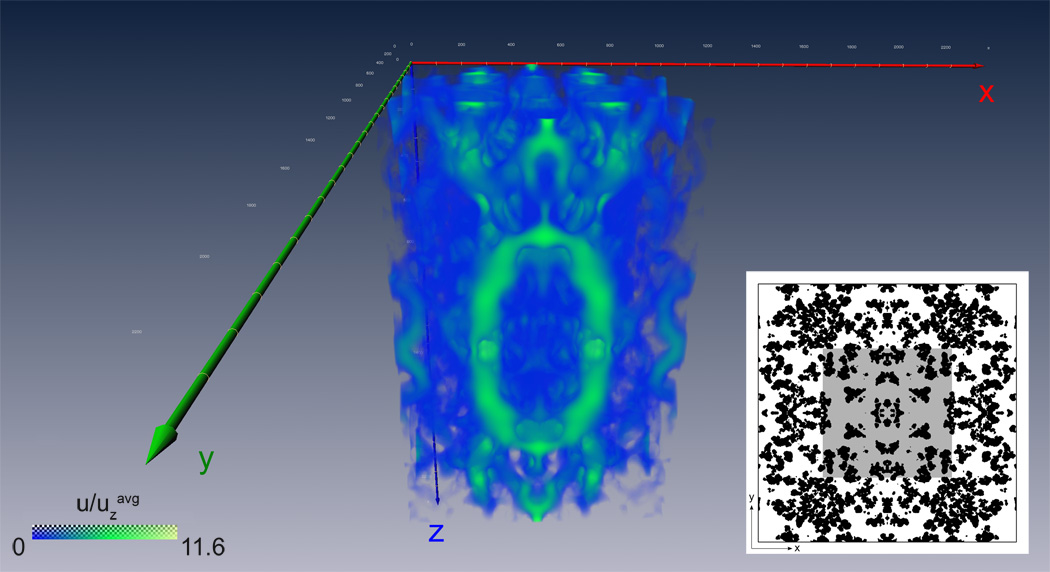
Plot of scaled u (total velocity) values in the central region of the sample block. Inset displays the topmost x-y cross section of this region as the shaded area on the first section of the sample block for perspective. The values are coded by a combined gradient of color and transparency, with the velocities displayed as opaque green at their highest, a translucent mixture of green and blue at mid-range, and completely transparent, therefore invisible at solid voxels where the total vector is zero. (For interpretation of the references to color in this figure legend, the reader is referred to the web version of this article.)
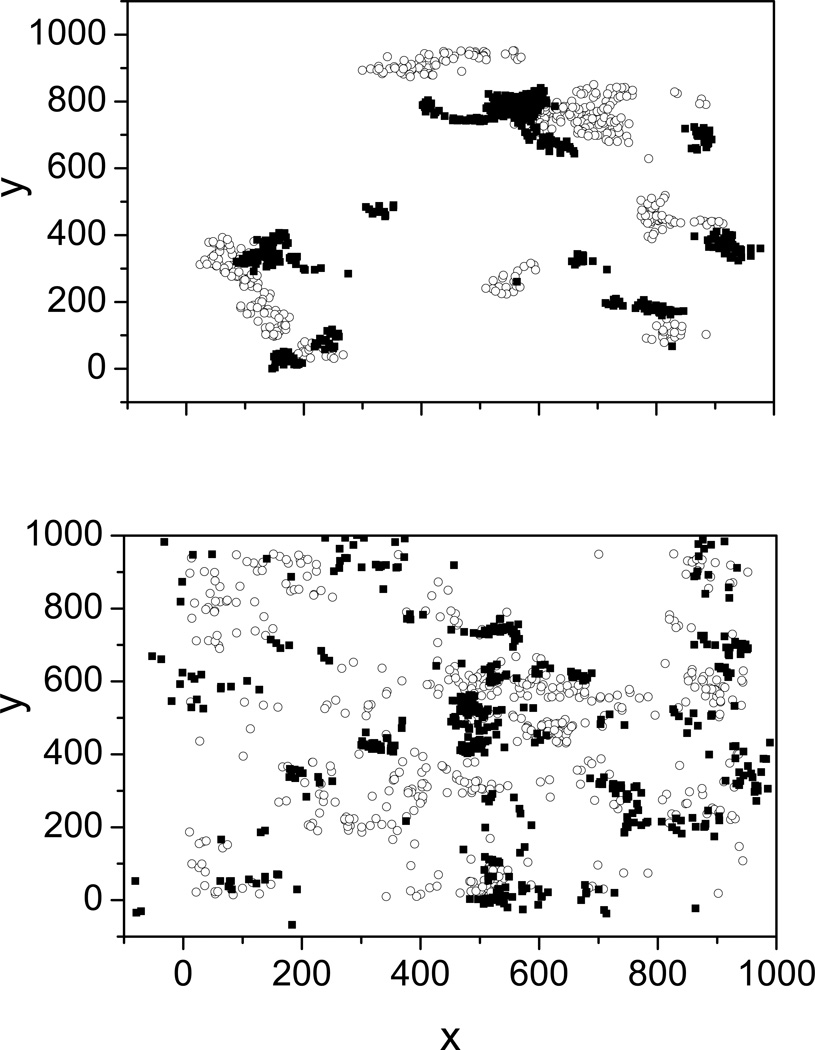
A qualitative sense of whether these high-velocity pathways do indeed influence particle trajectories can be obtained by the inspection of the initial and final lateral (x-y) positions of the particles, with respect to how fast they exit from the geometry. If there are indeed preferential pathways suggestive of channeling, the exit lateral positions of the particles should be correlated to their initial lateral positions. This analysis was carried out by sorting the exit times of the particles and selecting the top and bottom 10 percent of the total ensemble. The initial and final coordinates of these particles are plotted in Figure 7.
Figure 7.
Initial (○) and final (■) coordinates slowest (bottom) 500 particles forming a simulated peak of 5000 particles for a single-block run. Pe = 371.
It is apparent that both the initial and the final positions of the ‘fast’ particles (top graph) are heavily clustered. The slowest particles do not display as obvious a pattern, however, and are more extensively scattered throughout the entry and exit sections. This means that for the faster trajectories, exit times are strongly correlated with the initial positions; in other words, the preferential pathways or ‘channels’ within the 3D geometry have a significant impact on the overall dispersion. High-velocity channels like those in Figure 6 could of course be present in a physical monolith, but are unlikely on the scale of its entire geometry, which seems to be the case for the 3D sample in this work.
3.3 Dispersion of Finite-Sized Particles
A probe with a diameter of 92.5 nm and a diffusivity of 10−11 m2/s was used for the finite-size particle simulations, which approximately model the dispersion of adenovirus 5 (Ad5) with an equivalent diameter of 120 nm and a diffusivity of 0.37·10−11 m2/s [71,72]. The reconstructed monolith geometry was accordingly eroded by a 3D sphere of 5 voxels in diameter to emulate the pore space accessible to the probe, resulting in a decreased total apparent porosity of 0.507 compared to 0.570 for the raw structure. A macroscopic column length of 3 mm was simulated, with other parameters and the range of velocities simulated remaining the same as those used for the point particles summarized in Table 1.
The first moments obtained from particle exit time distributions were about 10 percent lower than the expected values based on the column length and uzavg. As mentioned, this discrepancy was less than one percent for point particles, which means that the larger probes travel faster. This is due to inaccessibility of the solid walls to the centers of the larger particles due to their larger diameters [73], resulting in trajectories that do not sample the lower velocities near these wall regions, and consequently faster trajectories for the particles. The expected proportional change in average velocity due to the decrease of accessible pore volume can be calculated from the lower apparent porosity. For the porosity values noted above, the expected difference in retention times is calculated as 11 percent, close to the value observed from the simulations.
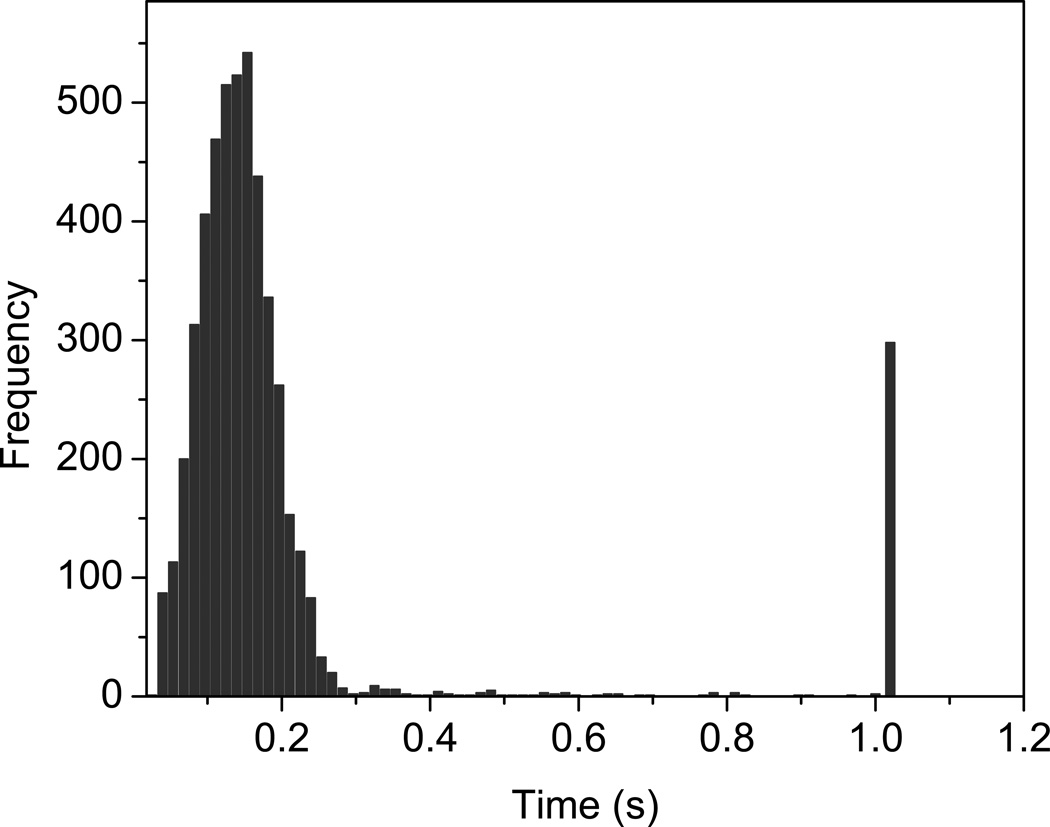
The plate heights for the column simulations are obviously subject to the symmetry issue of the flow field as well, and consequently were found to exhibit a trend similar to that for the point particle data. A fit of the modified Knox relation (eqn. (7)) yielded a value of 0.72 for the exponent n, marginally higher than that obtained for the point particles. However, a more specific and distinct reason for studying probe particles of finite size is the apparent entrapment of particles within the geometry. At the beginning of each run in the random-walk algorithm, a timeout period based on the slowest percentile of the axial velocity distribution is designated; if a particle does not elute before this time point, it is assumed to be ‘stuck’. Except for rare cases in which a particle was initially positioned at a dead-end pore by the random placement algorithm, all point particles were seen to elute from the simulated column length significantly before the end of this specified timeout period. For finite particle size simulations, on the other hand, a significant portion did not elute within this time frame, especially at the higher velocities. Figure 8 depicts the simulated elution profile at the highest Pe number, where the particles that do not exit before the allocated time form the peak at 1.00 s, the preset timeout value for that flow rate.
Figure 8.
The histogram of elution times for finite size particles at the highest flow rate (Pe = 3710). The peak between 1.00 and 1.02 corresponds to the particles that did not elute within the allocated timeout period.
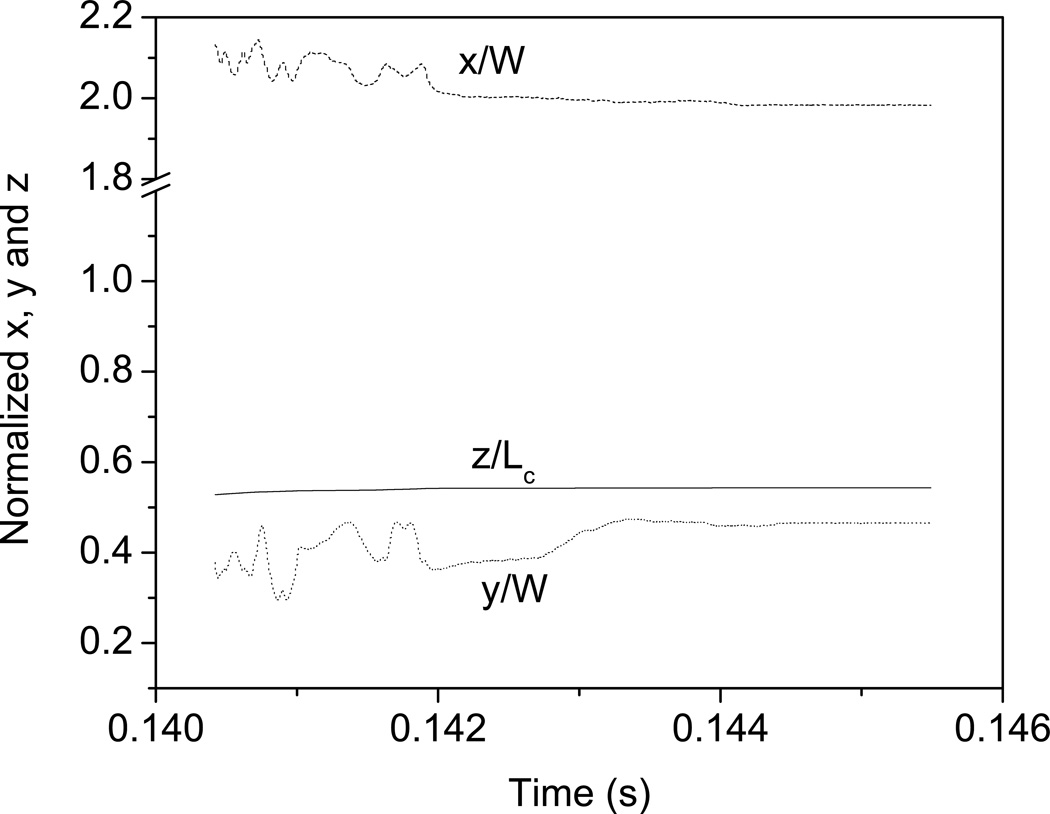
A trace of the global position as a function of time for a ‘timed-out’ particle is given in Figure 9, where it can be seen that the coordinates gradually converge to a single point approximately halfway through the simulated column length and remain unchanged for the rest of the simulation. All other trapped particles examined were seen to exhibit similar behavior, confirming that the timeouts correspond to the termination of the trajectories.
Figure 9.
Normalized global coordinates as a function of time for an entrapped particle. The lateral coordinates are normalized by the block width W, whereas the axial coordinate is normalized by the simulated column length, Lc. The final normalized coordinates at timeout are 1.98, 0.465 and 0.543 for x, y and z respectively.
The particular final location of Figure 9 was investigated further by isolating the geometry and the flow field of that region and running partial simulations for the finite-sized probe, by releasing particles numerous times at a point slightly upstream of the entrapment point. Figure 10 displays two examples of these runs, with the open circles representing the individual trajectory steps for the particle, and the red cones indicate the magnitude and direction of local velocities. Figure 10a is for the highest flow rate (Pe = 3710), where it can be seen that once the particle is released (at the position marked by the filled circle) it follows the local flow field, reaching the trap region corresponding to the asymptotic coordinates of Figure 9, and remaining in the immediate vicinity for the rest of the simulation. The trap region itself is a narrow constriction through which appreciable flow occurs, yet it is small enough to prevent the passage of the modeled probe.
Figure 10.
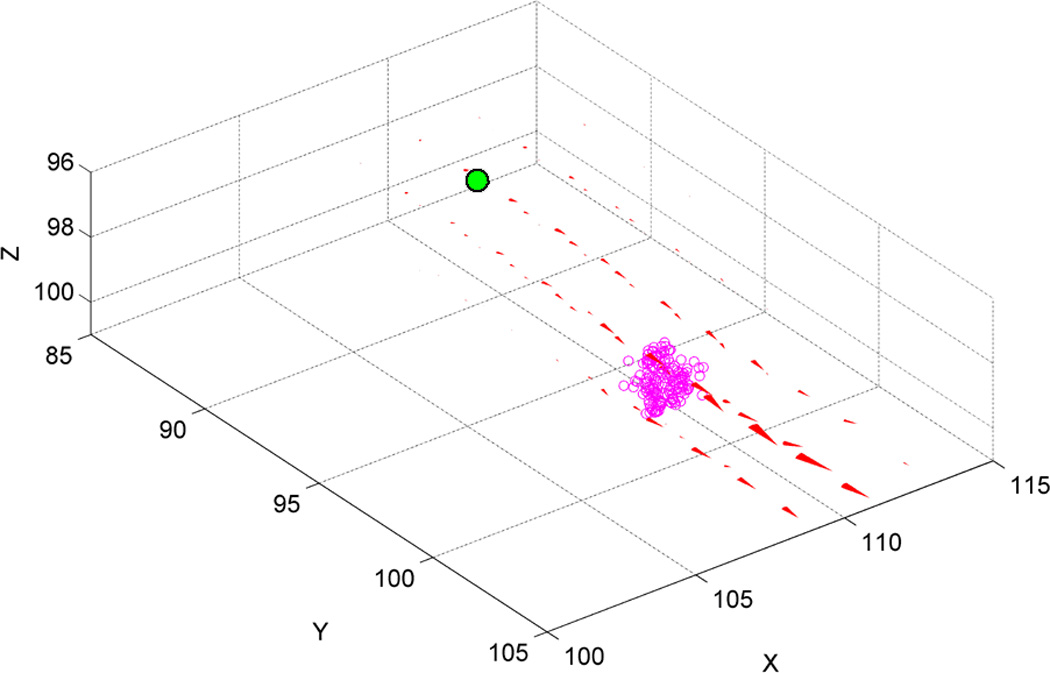
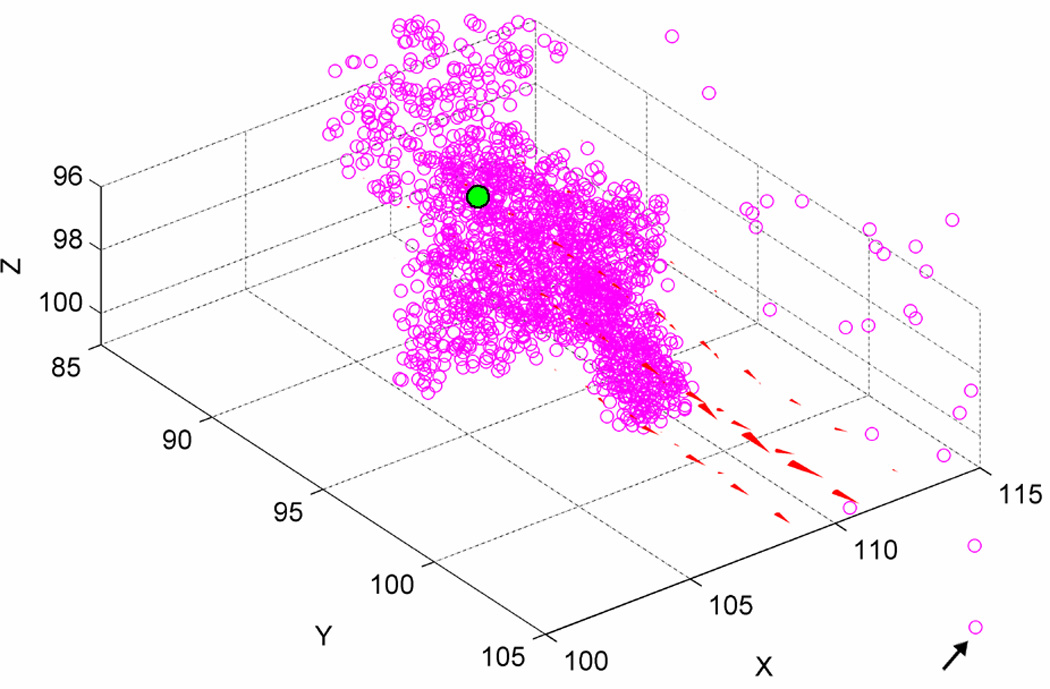
Example trajectories (open circles) within the flow field (red cones) for a single particle released in the immediate vicinity of the stagnation coordinates of Figure 9. The filled green circle outlined in black indicates the starting coordinates of the particle. (a) High flow rate, Pe = 3710. (b) Low flow rate (Pe = 371); black arrow indicates the final trajectory point visible in this perspective.
The trajectory in Figure 10b, on the other hand, was obtained for a slower flow rate (Pe = 371), and illustrates a much more interesting outcome. When the particle is released in this case, even though it is carried to the choke-point by the flow field, the stochastic component of the overall motion formed by the diffusive steps is sufficiently effective to allow the particle to probe the entire void space available, as indicated by the diffusion cloud formed by the multitude of points of the trajectory. This relative increase in mobility enables the particle to eventually leave the stagnation point, in the particular case of Figure 10b by backtracking to its point of entry and switching to a more favorable path.
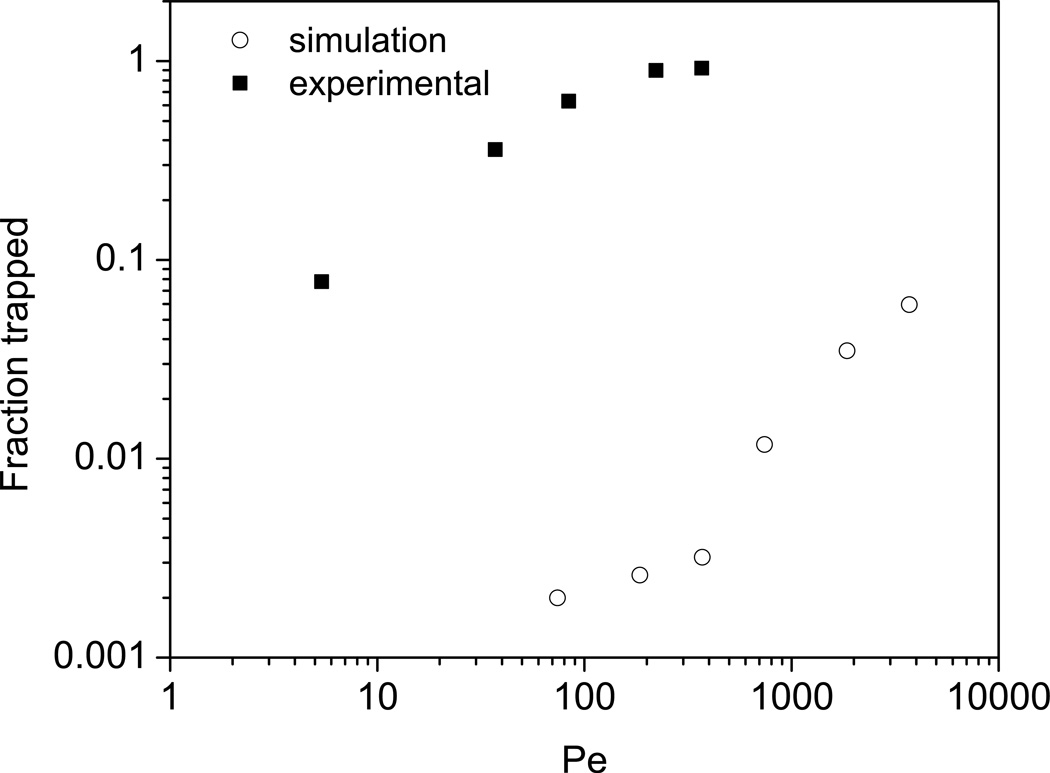
A previous experimental study [21] using Ad5 particles in the CIM monoliths yielded results similar to the entrapment phenomenon described above. Specifically, pulse injections of Ad5 onto a stack of 4 CIM monolith disks under non-retentive conditions were observed consistently to result in elution peaks with areas smaller than would be expected from the total injected mass. The decrease in the peak area varied directly with the flow rate employed, and furthermore the ‘missing’ mass of particles was recovered from the column when the flow rate was decreased to a low value. The authors explained this phenomenon by a flow-based, convective entrapment mechanism, where large particles that are forced by the flow field into constrictions narrower than the particle diameter remain trapped unless a series of random diffusive moves carry them to alternative open paths. At high velocities, where convective contributions to transport are dominant, diffusion is inadequate to overcome the velocity bias and particles remain at their positions of entrapment. At lower velocities, however, when convection and diffusion are of comparable magnitude, the latter is sufficient to dislocate the particle onto a favorable trajectory. The behavior indicated by the case studies of Figure 10 closely resemble the qualitative characterization of the entrapment mechanism, providing support for this hypothesis within the framework of the model employed.
A comparison between the simulated and experimental cases of entrapment is made (Figure 11) by plotting the number fraction of entrapped particles in the simulations along with the fraction of peak area that is ‘lost’ relative to the expected area from mass balance observed in the pulse experiments. Although the simulations anticipate the existence of the entrapment phenomenon and predict correctly that it will increase with flow rate due to the diminishing contribution of diffusion, it is evident that the extent of entrapment is underpredicted by a large margin. Possible reasons for these lower estimates are the use of a smaller particle diameter and a higher value of the diffusion coefficient (10−11 m2/s in the simulations vs. 0.37·10−11 m2/s for Ad5) and the fact that the experimental results were obtained for a stack of 4 CIM disks, whereas the simulated length was for a single monolith disk, leading to a decreased frequency of entrapment. The artificial restriction of the lateral dispersion discussed in 3.2 is also expected to contribute to this difference, by limiting the sampling frequency of the choke-points by the particles. However, the fact that this phenomenon arises in the simulations without any model adjustments is encouraging, and indicates that key aspects of the microscopic transport mechanisms are correctly captured by the rigorous random-walk solution.
Figure 11.
Comparison of the entrapment behavior predicted by simulations (○) with the experimental results (■)[21]. The simulation results are the number fraction of particles that do not elute within the specified timeout period, while the experimental data are the fraction of the solute mass trapped within the column.
4. Conclusions
This work illustrates the feasibility of direct image-based approaches for chromatographic modeling in that it provides examples for the high-resolution capture of a microstructure, its characterization by image processing methods and the application of mesoscopic models for the simulation of transport. A particular advantage is that the image-based approach allows an explicit description of the geometry, enabling a much more rigorous analysis of solute-stationary phase interaction. However, the results also highlight one of the key challenges associated with this approach, which is the question of how representative a sample is of the macroscopic structure in order to obtain transient dispersion characteristics consistent with the physical system. Provided that this criterion is met, the methodology developed is sufficiently robust and flexible to accommodate these alternatives, and remains promising for future applications.
Achieving predictive modeling of dispersion behavior requires overcoming several additional challenges that this work reveals. In addition to the absence of wall effects two separate issues are believed to contribute to the discrepancies between the dispersion simulations of this work and macroscopic measurements, namely the artificial restriction of lateral motion by the periodic reversal of the lateral velocity components and the channeling effects that dominate dispersion within a single block length. Both of these issues may potentially be addressed by the use of a larger sample, which could allow the simulation of dispersion without resorting to periodic boundaries, at the same time averaging out the anomalies introduced by the local features that are further emphasized by the mirroring procedure. The difficulty however, is to determine a priori whether such an alternative sample will be satisfactory itself. Reliable metrics that provide guidance in assessing the overall utility of a sample as a ‘typical’ element of the global geometry should be used for this purpose and could be addressed by future research. One option previously demonstrated for various random media is to characterize the sample geometry using statistical correlations, and to use them to estimate macroscopic transport properties [74–77]. These estimates can then be compared with experimentally obtained bulk values, to decide whether the sample can be considered to be representative of the whole.
Highlights.
Dispersion in a monolith modeled by random walk on a reconstructed 3-D sample.
Macroscopic column lengths show exaggerated dispersion due to imposed symmetry.
Simulations for actual sample yield plate height dependence consistent with theory.
Simulations of finite-size probes show trapping in crevices, as seen for adenovirus.
Acknowledgments
Financial support for this work was provided by the National Institutes of Health (NIH) under grant R01 GM75047.
Footnotes
Publisher's Disclaimer: This is a PDF file of an unedited manuscript that has been accepted for publication. As a service to our customers we are providing this early version of the manuscript. The manuscript will undergo copyediting, typesetting, and review of the resulting proof before it is published in its final citable form. Please note that during the production process errors may be discovered which could affect the content, and all legal disclaimers that apply to the journal pertain.
References
- 1.van Deemter JJ, Zuiderweg FJ, Klinkenberg A. Chem. Eng. Sci. 1956;5:271. [Google Scholar]
- 2.Hahn R, Jungbauer A. Anal. Chem. 2000;72:4853. doi: 10.1021/ac000688y. [DOI] [PubMed] [Google Scholar]
- 3.Hahn R, Panzer M, Hansen E, Mollerup J, Jungbauer A. Sep. Sci. Technol. 2002;37:1545. [Google Scholar]
- 4.Jungbauer A. J. Chromatogr. A. 2005;1065:3. doi: 10.1016/j.chroma.2004.08.162. [DOI] [PubMed] [Google Scholar]
- 5.Jungbauer A, Hahn R. J. Chromatogr. A. 2008;1184:62. doi: 10.1016/j.chroma.2007.12.087. [DOI] [PubMed] [Google Scholar]
- 6.Hahn R, Tscheliessnig A, Bauerhansl P, Jungbauer A. J. Biochem. Biophys. Methods. 2007;70:87. doi: 10.1016/j.jbbm.2006.09.005. [DOI] [PubMed] [Google Scholar]
- 7.Minakuchi H, Ishizuka N, Nakanishi K, Soga N, Tanaka N. J. Chromatogr. A. 1998;828:83. doi: 10.1016/s0021-9673(96)00944-2. [DOI] [PubMed] [Google Scholar]
- 8.Minakuchi H, Nakanishi K, Soga N, Ishizuka N, Tanaka N. J. Chromatogr. A. 1997;762:135. doi: 10.1016/s0021-9673(96)00944-2. [DOI] [PubMed] [Google Scholar]
- 9.Minakuchi H, Nakanishi K, Soga N, Ishizuka N, Tanaka N. J. Chromatogr. A. 1998;797:121. doi: 10.1016/s0021-9673(96)00944-2. [DOI] [PubMed] [Google Scholar]
- 10.Bristow P, Knox J. Chromatographia. 1977;10:279. [Google Scholar]
- 11.Leinweber FC, Lubda D, Cabrera K, Tallarek U. Anal. Chem. 2002;74:2470. doi: 10.1021/ac011163o. [DOI] [PubMed] [Google Scholar]
- 12.Leinweber FC, Tallarek U. J. Chromatogr. A. 2003;1006:207. doi: 10.1016/s0021-9673(03)00391-1. [DOI] [PubMed] [Google Scholar]
- 13.Giddings JC. Dynamics of Chromatography. New York: Marcel Dekker; 1965. [Google Scholar]
- 14.Czok M, Guiochon G. Comput. Chem. Eng. 1990;14:1435. [Google Scholar]
- 15.Guiochon G, Felinger A, Shirazi DG, Katti AM. Fundamentals of Preparative and Nonlinear Chromatography. Amsterdam: Academic Press; 2006. [Google Scholar]
- 16.Miyabe K, Cavazzini A, Gritti F, Kele M, Guiochon G. Anal. Chem. 2003;75:6975. doi: 10.1021/ac0302206. [DOI] [PubMed] [Google Scholar]
- 17.Miyabe K, Guiochon G. J. Phys. Chem. B. 2002;106:8898. [Google Scholar]
- 18.Vervoort N, Gzil P, Baron GV, Desmet G. Anal. Chem. 2003;75:843. doi: 10.1021/ac034345m. [DOI] [PubMed] [Google Scholar]
- 19.Sederman AJ, Johns ML, Alexander P, Gladden LF. Chem. Eng. Sci. 1998;53:2117. [Google Scholar]
- 20.Hlushkou D, Bruns S, Tallarek U. J. Chromatogr. A. 2010;1217:3674. doi: 10.1016/j.chroma.2010.04.004. [DOI] [PubMed] [Google Scholar]
- 21.Trilisky EI, Lenhoff AM. Biotechnol. Bioeng. 2009;104:127. doi: 10.1002/bit.22370. [DOI] [PMC free article] [PubMed] [Google Scholar]
- 22.Salles J, Thovert JF, Delannay R, Prevors L, Auriault JL, Adler PM. Phys. Fluids A. 1993;5:2348. [Google Scholar]
- 23.Maier RS, Kroll DM, Davis HT, Bernard RS. Internat. J. Modern Phys. C. 1998;9:1523. [Google Scholar]
- 24.Maier RS, Kroll DM, Bernard RS, Howington SE, Peters JF, Davis HT. Phys. Fluids. 2000;12:2065. doi: 10.1098/rsta.2001.0951. [DOI] [PubMed] [Google Scholar]
- 25.Maier RS, Kroll DM, Bernard RS, Howington SE, Peters JF, Davis HT. Phil. Trans. R. Soc. A. 2002;360:497. doi: 10.1098/rsta.2001.0951. [DOI] [PubMed] [Google Scholar]
- 26.Maier RS, Schure MR, Gage JP, Seymour JD. Water Resour. Res. 2008;44 W06S03. [Google Scholar]
- 27.Maier RS, Bernard RS. J. Comput. Phys. 2010;229:233. [Google Scholar]
- 28.Schure MR, Maier RS, Kroll DM, Davis HT. Anal. Chem. 2002;74:6006. doi: 10.1021/ac0204101. [DOI] [PubMed] [Google Scholar]
- 29.Schure MR, Maier RS, Kroll DM, Davis HT. J. Chromatogr. A. 2004;1031:79. doi: 10.1016/j.chroma.2003.12.030. [DOI] [PubMed] [Google Scholar]
- 30.Schure MR, Maier RS. J. Chromatogr. A. 2006;1126:58. doi: 10.1016/j.chroma.2006.05.066. [DOI] [PubMed] [Google Scholar]
- 31.Kandhai D, Hlushkou D, Hoekstra AG, Sloot PMA, Van As H, Tallarek U. Phys. Rev. Lett. 2002;88 doi: 10.1103/PhysRevLett.88.234501. 234501. [DOI] [PubMed] [Google Scholar]
- 32.Kandhai D, Tallarek U, Hlushkou D, Hoekstra A, Sloot PMA, Van As H. Phil. Trans. R. Soc. A. 2002;360:521. doi: 10.1098/rsta.2001.0952. [DOI] [PubMed] [Google Scholar]
- 33.Maier RS, Kroll DM, Kutsovsky YE, Davis HT, Bernard RS. Phys. Fluids. 1998;10:60. [Google Scholar]
- 34.Daneyko A, Höltzel A, Khirevich S, Tallarek U. Anal. Chem. 2011;83:3903. doi: 10.1021/ac200424p. [DOI] [PubMed] [Google Scholar]
- 35.Daneyko A, Khirevich S, Höltzel A, Seidel-Morgenstern A, Tallarek U. J. Chromatogr. A. 2011;1218:8231. doi: 10.1016/j.chroma.2011.09.039. [DOI] [PubMed] [Google Scholar]
- 36.Khirevich S, Höltzel A, Daneyko A, Seidel-Morgenstern A, Tallarek U. J. Chromatogr. A. 2011;1218:6489. doi: 10.1016/j.chroma.2011.07.066. [DOI] [PubMed] [Google Scholar]
- 37.Langford JF, Schure MR, Yao Y, Maloney SF, Lenhoff AM. J. Chromatogr. A. 2006;1126:95. doi: 10.1016/j.chroma.2006.06.060. [DOI] [PubMed] [Google Scholar]
- 38.Hlushkou D, Bruns S, Holtzel A, Tallarek U. Anal. Chem. 2010;82:7150. doi: 10.1021/ac101393b. [DOI] [PubMed] [Google Scholar]
- 39.Koku H, Maier RS, Czymmek KJ, Schure MR, Lenhoff AM. J. Chromatogr. A. 2010;1218:3466. doi: 10.1016/j.chroma.2011.03.064. [DOI] [PMC free article] [PubMed] [Google Scholar]
- 40.Einstein A. Ann. Phys. 1905;17:549. [Google Scholar]
- 41.Langevin P. C. R. Acad. Sci. (Paris) 1908;146:530. [Google Scholar]
- 42.Kinzelbach W, Uffink G. NATO ASI Ser., Ser. E. 1991;202:761. [Google Scholar]
- 43.Gardiner CW. Handbook of Stochastic Methods. Berlin, Germany: Springer-Verlag; 1985. [Google Scholar]
- 44.Ito K. In: Kyosi Ito Selected Papers. Stroock DW, Varadhan SRS, editors. New York, NY: Springer-Verlag; 1987. [Google Scholar]
- 45.LaBolle EM, Fogg GE, Tompson AFB. Water Resour. Res. 1996;32:583. [Google Scholar]
- 46.Thompson AFB, Vomvoris EG, Gelhar LW. Report Number 316 (Ralph M. Parsons Laboratory for Water Resources and Hydrodynamics) Cambridge, Mass: Massachusetts Institute of Technology; 1988. [Google Scholar]
- 47.Courant R, Friedrichs K, Lewy H. IBM J. Res. Dev. 1967;11:215. [Google Scholar]
- 48.Szymczak P, Ladd AJC. Phys. Rev. E: Stat., Nonlinear, Soft Matter Phys. 2003;68 doi: 10.1103/PhysRevE.68.036704. 036704. [DOI] [PubMed] [Google Scholar]
- 49.Gropp W, Lusk E, Skjellum A. Using MPI : portable parallel programming with the message-passing interface. Cambridge, Massachusetts: MIT Press; 1999. [Google Scholar]
- 50.Serra J. Image Analysis and Mathematical Morphology. London: Academic Press; 1982. [Google Scholar]
- 51.Vogel HJ, Roth K. Adv. Water Resour. 2001;24:233. [Google Scholar]
- 52.Yao Y, Czymmek KJ, Pazhianur R, Lenhoff AM. Langmuir. 2006;22:11148. doi: 10.1021/la0613225. [DOI] [PubMed] [Google Scholar]
- 53.Chatwin PC, Sullivan PJ. Fluid Mech. 1982;120:347. [Google Scholar]
- 54.Taylor G. Proc. R. Soc. London, A. 1953;219:186. [Google Scholar]
- 55.Brune D, Kim S. Proc. Natl. Acad. Sci. U. S. A. 1993;90:3835. doi: 10.1073/pnas.90.9.3835. [DOI] [PMC free article] [PubMed] [Google Scholar]
- 56.Bello MS, Rezzonico R, Righetti PG. Science. 1994;266:773. doi: 10.1126/science.266.5186.773. [DOI] [PubMed] [Google Scholar]
- 57.Trilisky EI, Koku H, Czymmek KJ, Lenhoff AM. J. Chromatogr. A. 2009;1216:6365. doi: 10.1016/j.chroma.2009.07.005. [DOI] [PMC free article] [PubMed] [Google Scholar]
- 58.Trilisky EI, Lenhoff AM. J. Chromatogr. A. 2010;1217:7372. doi: 10.1016/j.chroma.2010.09.040. [DOI] [PMC free article] [PubMed] [Google Scholar]
- 59.Koch DL, Cox RG, Brenner H, Brady JF. J. Fluid Mech. 1989;200:173. [Google Scholar]
- 60.Giddings JC. Unified Separation Science. New York: Wiley, Inc.; 1991. [Google Scholar]
- 61.Koch DL, Brady JF. J. Fluid Mech. 1985;154:399. [Google Scholar]
- 62.Saffman PG. J. Fluid Mech. 1959;6:321. [Google Scholar]
- 63.Sahimi M. Rev. Mod. Phys. 1993;65:1393. [Google Scholar]
- 64.Lowe CP, Frenkel D. Phys. Rev. Lett. 1996;77:4552. doi: 10.1103/PhysRevLett.77.4552. [DOI] [PubMed] [Google Scholar]
- 65.Knox JH, Laird GR, Raven PA. J. Chromatogr. A. 1976;122:129. [Google Scholar]
- 66.Knox JH, Parcher JF. Anal. Chem. 1969;41:1599. [Google Scholar]
- 67.Farkas T, Guiochon G. Anal. Chem. 1997;69:4592. [Google Scholar]
- 68.Shalliker RA, Broyles BS, Guiochon G. J. Chromatogr. A. 2000;888:1. doi: 10.1016/s0021-9673(00)00517-3. [DOI] [PubMed] [Google Scholar]
- 69.Abia JA, Mriziq KS, Guiochon GA. J. Chromatogr. A. 2009;1216:3185. doi: 10.1016/j.chroma.2009.02.034. [DOI] [PubMed] [Google Scholar]
- 70.Scheven UM, Harris R, Johns ML. Phys. Rev. Lett. 2007;99 doi: 10.1103/PhysRevLett.99.054502. 054502. [DOI] [PubMed] [Google Scholar]
- 71.Trilisky EI, Lenhoff AM. J. Chromatogr. A. 2007;1142:2. doi: 10.1016/j.chroma.2006.12.094. [DOI] [PubMed] [Google Scholar]
- 72.Oliver CJ, Shortridge KF, Belyanin G. Biochim. Biophys. Acta, Gen. Subj. 1976;437:589. doi: 10.1016/0304-4165(76)90026-x. [DOI] [PubMed] [Google Scholar]
- 73.Brenner H, Edwards DA. Macrotransport Processes. Boston, MA: Butterworth-Heinemann; 1993. [Google Scholar]
- 74.Yeong CLY, Torquato S. Phys. Rev. E: Stat., Nonlinear, Soft Matter Phys. 1998;58:224. [Google Scholar]
- 75.Coker DA, Torquato S, Dunsmuir JH. J. Geophys. Res. 1996;101:17497. [Google Scholar]
- 76.Bruns S, Hara T, Smarsly BM, Tallarek U. J. Chromatogr. A. 2011;1218:5187. doi: 10.1016/j.chroma.2011.05.090. [DOI] [PubMed] [Google Scholar]
- 77.Hlushkou D, Bruns S, Seidel-Morgenstern A, Tallarek U. J. Sep. Sci. 2011;34:2026. doi: 10.1002/jssc.201100158. [DOI] [PubMed] [Google Scholar]


