

Abstract
The purpose of this study was to investigate the relationship between liver fat-fraction (FF) and diffusion parameters derived from the intravoxel incoherent motion (IVIM) model. 36 subjects with suspected nonalcoholic fatty liver disease (NAFLD) underwent diffusion weighted (DW) MR imaging with 10 b-values and spoiled gradient recalled echo imaging for fat quantification with six echos. Correlations were measured between FF, R2*, diffusivity (D) and perfusion fraction (f). The primary finding was that no significant correlation was obtained for D vs FF or f vs FF. Significant correlations were obtained for D vs R2* (r = −0.490, p = 0.002) and f vs D (r = −0.458, p = 0.005). The conclusion is that hepatic steatosis does not affect measurement of perfusion or diffusion and therefore is unlikely to confound the use of apparent diffusivity to evaluate hepatic fibrosis.
Introduction
Magnetic resonance (MR) imaging is increasingly used in noninvasive assessment of liver disorders (1). Diffusion weighted (DW) imaging, and in particular the intravoxel incoherent motion (IVIM) model, has frequently been used to explain reduced apparent diffusion coefficient (ADC) measurements in cirrhotic livers (2, 3, 4). The IVIM model attributes DW imaging signal changes in the low b-value range to microcirculatory perfusion that, on the scale of an imaging voxel, mimics random molecular motion, while signal changes in the high b-value range reflect ordinary diffusion (5, 6, 7).
The perfusion parameters derived from IVIM modeling have been proposed as potential biomarkers of liver fibrosis as the microcirculatory environment is altered by deposition of collagen and other macromolecules in perisinusoidal space (space of Disse) as well as closure of fenestrations along the endothelium separating the sinusoidal and perisinusoidal space. Together, these alterations have the consequences of expanding the perisinusoidal space and compressing the sinusoids, causing resistance to sinusoidal blood flow and thus reduced microcirculatory perfusion. The passage of water molecules from sinusoidal to perisinusoidal space, within perisinusoidal space and from perisinusoidal space into hepatocytes is also restricted, hence reduced diffusion.
In some respects, hepatic steatosis has a similar effect to fibrosis on diffusion/perfusion. Fat accumulates as droplets in the hepatocytes which cause hepatocyte swelling, distortion of the microcirculatory anatomy and compression of sinusoids (8). Thus fat in the liver may have a similar effect on diffusion/perfusion, mimicking the changes associated with fibrosis. A second difficulty due to fat is due to imperfect suppression of the fat signal; since fat diffuses very slowly (low D), any residual fat signal would tend to lower the measured diffusivity. Fat frequently coexists with fibrosis, however the relationship between IVIM parameters and liver fat have not been well studied in human subjects.
The relationship between diffusion/perfusion and liver fat needs to be understood if IVIM measurements are to be developed further for fibrosis assessment, as fat may confound the relationship between IVIM parameters and liver fibrosis. The main purpose of this study is to address this gap in knowledge by prospectively assessing the cross-sectional relationship between liver fat-fraction (FF) and IVIM parameters. Based on the introductory remarks, we anticipate a negative correlation for D versus FF and f versus FF.
Material and Methods
MR Imaging
This prospective, cross-sectional, single site study was approved by an institutional review board and was compliant with the Health Insurance Portability and Accountability Act. Subjects with suspected non-alcoholic fatty liver disease were recruited consecutively between January and August 2010 (36 total, 14 male, 22 female, ages 11 – 62). None of the subjects had a known diagnosis of liver fibrosis at time of study. Additionally, none of the subjects had morphological changes of advanced fibrosis, as interpreted by a interpreting radiology body imaging fellow. Informed consent was obtained from the subject or legal guardian. Examinations were performed on a 3.0T scanner (Signa Excite HDx, GE Healthcare, Milwaukee, WI) in the supine position with an 8-channel torso array coil centered over the liver. Field of view was 40–44 cm depending on body habitus. Two imaging protocols were performed, one for diffusion/perfusion and one for fat quantification.
Diffusion Weighted Imaging
2D multi-slice axial DW spin echo, echo planar imaging (EPI) with spectral-spatial water excitation, 5 minute free breathing with 10 averages and 10 b-values: 0, 2, 5, 10, 20, 50, 100, 200, 500, and 800 s/mm2, parallel imaging factor 2, TE 43.8 ms, TR 3500 ms, matrix 128×160, partial k-space (factor 0.6, homodyne reconstruction) and bandwidth ±250kHz. The long free-breathing acquisition is a compromise to average away physiological and measurement noise. Typical image quality is shown in Figure 1. Breath-hold sequences can prevent respiratory artifacts but are limited to a single average with lower signal to noise ratio.
Figure 1.

Typical images for the DW EPI acquisitions (note window/level is identical). Signal amplitude was recorded at ten b-values between 0 and 800 and modeled using bi-exponential analysis (Eq 1).
Fat Quantification
2D multislice axial spoiled gradient recalled (SPGR) echo with six fractional echos (factor 0.8) acquired in a 24 second breath-hold with TE = ΔTE = 1.15 ms. A bipolar echo train was used. The TR was 140–180 ms, flip angle 10°, matrix 192×192 and bandwidth 142–166 kHz, following a previous study (9). Typical image quality is shown in Figure 2.
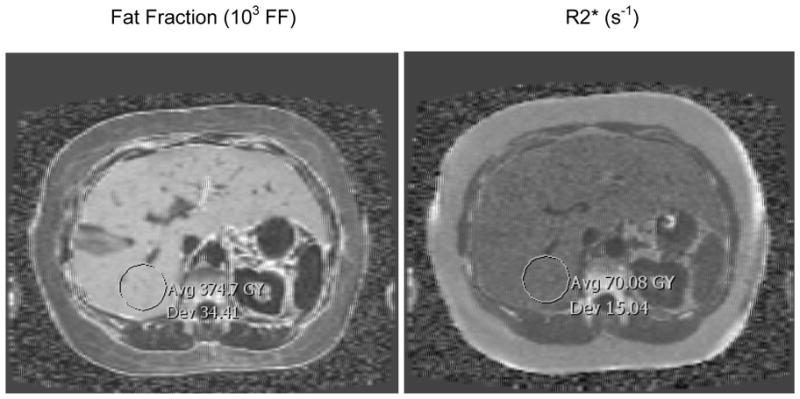
Figure 2.

Typical images for the spoiled gradient echo acquisitions for fat quantification (note window/level is identical). Signal amplitude was recorded at six echo times and modeled using an oscillating exponential decay.
Data Fitting
Parametric maps of the diffusion coefficient (D) and perfusion fraction (f) were created from DW images. The MR signal was curve-fitted to a biexponential decay with b-value (2, 3)
| (1) |
where Sb is the signal intensity, f is the perfusion fraction (i.e. fraction of the signal attributable to the microcirculation component), D is diffusivity of liver parenchyma and Dfast is the diffusivity of the perfusion component. Unknown parameters were (scaling term) S0, f, D and Dfast.
Parametric maps of the fat fraction (FF) and R2* were generated from SPGR images by curve-fitting (9). Briefly, the variation in signal amplitude with TE was modeled, taking into account the R2* decay and fat spectrum of the liver (10). The unknown parameters were a scaling term, fat fraction and R2*.
In both DW EPI and SPGR data, the best-fit variables were obtained by unconstrained nonlinear least squares optimization using the Levenberg-Marquardt algorithm. Negative values obtained in some variables were not physiologically meaningful but reflect measurement noise in the data and were retained for transparency.
Statistical Analysis
A radiology body imaging fellow manually placed an approximately 30 mm2 circular region of interest (ROI) over the right lobe of the liver in an area relatively free from imaging artifact at corresponding areas on the parametric maps. Values from the ROIs were recorded for analysis. Correlation coefficients and p-values between the four parameters were calculated using MATLAB (The Mathworks, Natick, MA). Since each measured parameter was tested for three different correlations, a Bonferroni correction is appropriate to increase the stringency for significance to p < 0.017.
Results
Preliminary analysis showed curve-fitting the Dfast parameter was prone to unacceptable scatter, likely due to the small fraction of signal exhibiting rapid decay (f ~ 0.1) that resulted in acute sensitivity to measurement noise. To improve robustness in the fitting process, Dfast was assigned a fixed value following previous reports that found Dfast to be approximately 70 × 10−3 mm2/s in human liver (2, 11). This is around 70 times greater than typical values of D. Figure 3 indicates that this value of Dfast is consistent with the IVIM data obtained in the present study and Table I shows that f and D are largely insensitive to Dfast over a wide range.
Figure 3.

DW signal versus b-value. ROIs from two livers with low and high values of f (0.03 and 0.22, respectively) are represented. Best fit curves from least squares fitting of Eq 1 are over-plotted on the data assuming fixed Dfast = 0.07 as discussed in the text. Note the low b-value points are well-modeled by the approximation (inset shows a magnification of the low b-value region). Fitted values are given in Table I.
Table 1.
Justification of fixing Dfast. Sensitivity of fitting parameters to changes in Dfast for two subjects (“1” and “2”) with low and high perfusion fractions, respectively, using the data of Figure 3. Note D and f are fairly insensitive to changes in Dfast within a factor of 2 of the literature value of 70. Also shown are the results of unconstrained fitting using variable Dfast, which shows when f is low the procedure is numerically unstable and Dfast values are unreliable. Errors represent the 95% confidence intervals and r2 gives a measure of the goodness of fit.
| Subject | Dfast (10−3 mm2/s) | D (10−3 mm2/s) | f | r2 |
|---|---|---|---|---|
| 1 | 35 (fixed) | 0.97 ± 0.05 | 0.029 ± 0.023 | 0.992 |
| 70 (fixed) | 0.98 ± 0.04 | 0.033 ± 0.020 | 0.993 | |
| 140 (fixed) | 0.99 ± 0.04 | 0.037 ± 0.019 | 0.993 | |
| 1299 ± 3037 | 1.00 ± 0.04 | 0.043 ± 0.019 | 0.994 | |
| 2 | 35 (fixed) | 0.70 ± 0.20 | 0.21 ± 0.09 | 0.841 |
| 70 (fixed) | 0.73 ± 0.24 | 0.22 ± 0.08 | 0.865 | |
| 140 (fixed) | 0.80 ± 0.23 | 0.21 ± 0.08 | 0.862 | |
| 88 ± 10 | 0.75 ± 0.28 | 0.22 ± 0.09 | 0.867 |
Figure 4 shows the typical quality of fitted maps. It is evident that the perfusion fraction is not well estimated, which is likely a consequence of the relatively small signal available from this component of tissue (typically 10 % of the total signal). The DW EPI sequence is also vulnerable to artifacts from the use of strong gradients (eddy currents), long readout times (T2 signal loss, T2* blurring, susceptibility-induced distortions) and homodyne reconstruction (signal loss in areas with rapid phase variation).
Figure 4.

Examples of parametric maps of diffusion (D), perfusion fraction (f), fat fraction (FF) and R2* obtained from the images series in Fig 1 and 2. Note the values have been scaled into a convenient integer range for DICOM compatibility (×106, ×102, ×103 and ×1, respectively). Also there are slight numerical differences compared to Fig 3 due to fitting ROIs rather than each pixel separately; the differences are negligible, e.g. D = 9.5 in Figure 3 versus 9.48 in Figure 4.
A more quantitative measure of the variability in the maps is given by the mean divided by the standard deviation in the ROI markers. Note the values on the maps have been scaled into a convenient integer range for DICOM compatibility (×106, ×102, ×103 and ×1, respectively). The mean to standard deviation ratios are 11.5 (D), 0.808 (f), 10.9 (FF) and 4.66 (R2*). These ratios are highly dependent on the value of the numerator (subject dependent) and are reported merely as a guide to the typical precision.
Figure 5 contains the main results of the study, i.e. the correlations between the different parameters. Statistical properties are listed in Table II. The plots of primary interest are diffusion coefficient (D) versus fat fraction (FF) and perfusion fraction (f) with fat fraction (FF), which were both anticipated to be negatively correlated. However, while negative correlations were observed, they were not statistically significant. Two of the other comparisons exhibited statistically significant correlation: f versus D and D versus relaxivity (R2*).
Figure 5.

Correlation plots. Correlation between different parameters (n=36 subjects): FF=fat fraction, R2*=decay rate, f=perfusion fraction, D=diffusion coefficient. Two statistically significant trends were detected in the data: D vs R2* (top right) and f vs D (bottom right).
Table 2.
Results of statistical correlations for the plots in Figure 5.
| Regression | Slope / Intercept | Correlation Coeff. | p value |
|---|---|---|---|
| R2* vs FF | 0.247 / 45.53 | 0.265 | 0.118 |
| D vs FF | −0.00199 / 1.099 | −0.152 | 0.377 |
| D vs R2* | −0.00690 / 1.408 | −0.490 | 0.002 |
| f vs FF | −0.0672 / 6.49 | −0.209 | 0.222 |
| f vs R2* | 0.0338 / 3.77 | 0.098 | 0.571 |
| f vs D | −11.2 / 17.45 | −0.458 | 0.005 |
Discussion
Based on MR properties, the liver can be categorized into four components: parenchyma, fat, interstitial fluid and macromolecular tissue. The latter is not visible on MR images but may be inferred from magnetization transfer (12). In addition, multiecho imaging is used to gauge iron content (13, 14, 15, 16) and DW imaging to detect lesions based on diffusion properties. More recently, the apparent diffusivity of parenchyma has also been considered a potential biomarker of fibrosis (2, 17).
However, previous studies have indicated that steatosis, as well as collagen deposits associated with fibrosis, can decrease the microcirculation of interstitial fluid (8), which would complicate the use of apparent diffusivity as a marker of fibrosis. Laser Doppler flowmetry in rabbits has shown that hepatic steatosis reduces overall hepatic blood flow and parenchymal microcirculation in transplanted livers (18). The same modality in steatotic human liver grafts demonstrated decreased tissue perfusion compared to normal grafts (19). In positron emission tomography, type II diabetic human subjects with high liver triglyceride showed decreased hepatic parenchymal perfusion (20).
Despite a plausible pathophysiologic model, the present study found no statistically significant correlation between hepatic fat fraction (FF) and two parameters derived from diffusion imaging, namely perfusion fraction (f) and diffusion coefficient (D). The former is a measure of the rapid initial decay of signal with increasing b-value whereas the latter is due to conventional diffusion. A third IVIM parameter (Dfast) could not be reliably estimated and was assigned a fixed value based on previous work (2,11). According to the intravoxel incoherent motion (IVIM) model, Dfast is a measure of the rate of flow of interstitial fluid whereas perfusion fraction (f) should measure the volume fraction of interstitial fluid independent of rate of flow or capillary geometry (6).
Regarding the discrepancy between this IVIM result and previous results correlating steatosis and perfusion, the previous studies were performed with a Doppler-based technique that is sensitive to both velocity changes and volumetric changes, often reported in “flux units”. It is possible that the lack of correlation in the present study between f (a volumetric number) and FF indicates velocity is the parameter that changes in the context of steatosis. While phantom experiments have validated the signal losses at low b-value due to pseudo-random flow (21), the validation of f and Dfast in relation to volume fraction and flow velocity still require further study.
Two incidental findings in the present study were: (i) a significant negative correlation between f and D, and (ii) a significant negative correlation between D and R2*. The first correlation may be due to the assumption of fixed Dfast, since Table 1 indicates a weak dependence of f and D on the value chosen for Dfast; thus the correlation may be artefactual. The second correlation indicates rapid R2* relaxation rates are associated with lower diffusion rates, which is consistent with the action of macromolecules that cause signal dephasing (through residual dipolar coupling) and also inhibit the free motion of water molecules. There is also the suggestion of a positive correlation between R2* and FF, if the two data points with highest FF are excluded. The interaction between FF and R2* is not simple, since fat has several components that broaden the spectrum and mimic R2* decay at short TE ranges (22, 23), hence errors in the fat spectrum will tend to manifest as R2* decay.
There were several limitations to the present study. Firstly, the number of patients recruited was small (n=36). Given this limitation, it was not feasible to separate subjects into differing degrees of hepatic steatosis, which theoretically could uncover a threshold where steatosis may begin to influence microcirculation. Additionally, near the time of the study, serum liver function tests and liver biopsies were not obtained, thus concurrent hepatitis and fibrosis were not controlled. In regards technical considerations, the TE range for FF measurement was not well suited to accurate R2* measurement. A wider TE range would (in principle) give more reliable R2* although careful consideration of the multiple fat components is required. The R2* is a difficult parameter to interpret clinically and R1 or R2 are often preferred for iron quantification (13, 14, 15, 16). Methods of IVIM apply strong motion sensitization gradients, which require a long TE and introduces T2-weighting. Ideally, the perfusion fraction (f) should be estimated using a short TE to better reflect the proton densities of interstitial fluid and liver parenchyma. If interstitial fluid has similar properties to blood or liver parenchyma (T2s of 50 to 70 ms) then T2-weighting will not have a large effect on the signal. A similar argument applies to T1, although the use of a long TR means T1-weighting is likely to be small. Lastly the imaging gradients themselves induce unavoidable diffusion weighting with a b-value is of the order 1 s/mm2, which would reduce the measured f by e(−Dfast) ≈0.93 (assuming Dfast = 70 × 10−3 mm2/s).
In conclusion, the clinical implication of the present study was that no significant correlation was found between hepatic fat fraction and microcirculatory perfusion fraction as measured by IVIM. Therefore, hepatic steatosis is unlikely to confound the use of apparent diffusivity to evaluate hepatic fibrosis.
Acknowledgments
Support was provided by GE Healthcare and by NIH Grant R01 #DK075128.
Footnotes
Publisher's Disclaimer: This is a PDF file of an unedited manuscript that has been accepted for publication. As a service to our customers we are providing this early version of the manuscript. The manuscript will undergo copyediting, typesetting, and review of the resulting proof before it is published in its final citable form. Please note that during the production process errors may be discovered which could affect the content, and all legal disclaimers that apply to the journal pertain.
References
- 1.Sijens PE. Parametric exploration of the liver by magnetic resonance methods. Eur Radiol. 2009;19:2594. doi: 10.1007/s00330-009-1470-y. [DOI] [PMC free article] [PubMed] [Google Scholar]
- 2.Luciani A, Vignaud A, Cavet M, et al. Liver Cirrhosis: Intravoxel Incoherent Motion MR Imaging—Pilot Study. Radiology. 2008;249:891. doi: 10.1148/radiol.2493080080. [DOI] [PubMed] [Google Scholar]
- 3.Yamada I, Aung W, Himeno Y, Nakagawa T, Shibuya H. Diffusion coefficients in abdominal organs and hepatic lesions: evaluation with intravoxel incoherent motion echo-planar MR imaging. Radiology. 1999;210:617. doi: 10.1148/radiology.210.3.r99fe17617. [DOI] [PubMed] [Google Scholar]
- 4.Patel J, Sigmund EE, Rusinek H, et al. Diagnosis of cirrhosis with intravoxel incoherent motion diffusion MRI and dynamic contrast-enhanced MRI alone and in combination: Preliminary experience. J Magn Reson Imaging. 2010;31:589. doi: 10.1002/jmri.22081. [DOI] [PMC free article] [PubMed] [Google Scholar]
- 5.Le Bihan D, Breton E, Lallemand D, et al. MR imaging of intravoxel incoherent motions: application to diffusion and perfusion in neurologic disorders. Radiology. 1986;161:401. doi: 10.1148/radiology.161.2.3763909. [DOI] [PubMed] [Google Scholar]
- 6.Le Bihan D, Breton E, Lallemand D, Aubin ML, Vignaud J, Laval-Jeantet M. Separation of diffusion and perfusion in intravoxel incoherent motion MR imaging. Radiology. 1988;168:497. doi: 10.1148/radiology.168.2.3393671. [DOI] [PubMed] [Google Scholar]
- 7.Le Bihan D. Intravoxel Incoherent Motion Perfusion MR Imaging: A Wake-Up Call. Radiology. 2008;249:748. doi: 10.1148/radiol.2493081301. [DOI] [PubMed] [Google Scholar]
- 8.McCuskey RS, Ito Y, Robertson GR, McCuskey MK, Perry M, Farrell GC. Hepatic microvascular dysfunction during evolution of dietary steatohepatitis in mice. Hepatology. 2004;40:386. doi: 10.1002/hep.20302. [DOI] [PubMed] [Google Scholar]
- 9.Yokoo T, Bydder M, Hamilton G, Middleton MS, Gamst AC, Wolfson T, Hassanein T, Patton HM, Lavine JE, Schwimmer JB, Sirlin CB. Nonalcoholic fatty liver disease: diagnostic and fat-grading accuracy of low-flip-angle multiecho gradient-recalled-echo MR imaging at 1.5 T. Radiology. 2009;251:67. doi: 10.1148/radiol.2511080666. [DOI] [PMC free article] [PubMed] [Google Scholar]
- 10.Hamilton G, Yokoo T, Bydder M, Cuite I, Schroeder ME, Sirlin CB, Middleton MS. In vivo charactericationi of the liver fat 1H MR Spectrum. NMR in Biomedicine. doi: 10.1002/nbm.1622. (available online 12 Dec 2010) [DOI] [PMC free article] [PubMed] [Google Scholar]
- 11.Lee J, Shiehmorteza M, Schroeder ME, Hansen KH, Bydder M, Sirlin C. Liver diffusion/perfusion using biexponential analysis with 30 b-values. Proc Intl Soc Mag Reson Med. 2010;18:2658. [Google Scholar]
- 12.Boss A, Martirosian P, Kuper K, Fierlbeck G, Claussen CD, Schick F. Whole-Body Magnetization Transfer Contrast Imaging. J Magn Reson Imaging. 2006;24:1183. doi: 10.1002/jmri.20754. [DOI] [PubMed] [Google Scholar]
- 13.Bonkovsky HL. Hepatic iron concentration: noninvasive estimation by means of MR imaging techniques. Radiology. 1999;212:227. doi: 10.1148/radiology.212.1.r99jl35227. [DOI] [PubMed] [Google Scholar]
- 14.Gandon Y, Olivié D, Guyader D, Aubé C, Oberta F, Sebille V, Deugnier Y. Non-invasive assessment of hepatic iron stores by MRI. Lancet. 2004;363:357. doi: 10.1016/S0140-6736(04)15436-6. [DOI] [PubMed] [Google Scholar]
- 15.Wood JC, Enriquez C, Ghugre N, et al. MRI R2 and R2* mapping accurately estimates hepatic iron concentration in transfusion-dependent thalassemia and sickle cell disease patients. Blood. 2005;106:1460. doi: 10.1182/blood-2004-10-3982. [DOI] [PMC free article] [PubMed] [Google Scholar]
- 16.Tziomalos K, Perifanis V. Liver iron content determination by magnetic resonance imaging. World Journal of Gastroenterology: WJG. 2010;16:1587. doi: 10.3748/wjg.v16.i13.1587. [DOI] [PMC free article] [PubMed] [Google Scholar]
- 17.Taouli B, Ehman RL, Reeder SB. Advanced MRI methods for assessment of chronic liver disease. American Journal of Roentgenology. 2009;193:14. doi: 10.2214/AJR.09.2601. [DOI] [PMC free article] [PubMed] [Google Scholar]
- 18.Seifalian AM, Piasecki C, Agarwal A, Davidson BR. The Effect of Graded Steatosis on Flow in the Hepatic Parenchymal Microcirculation. Transplantation. 1999;68(6) doi: 10.1097/00007890-199909270-00009. [DOI] [PubMed] [Google Scholar]
- 19.Seifalian AM, Chidambaram V, Rolles K, Davidson BR. In vivo demonstration of impaired microcirculation in steatotic human liver grafts. Liver Transplantation. 1998;4:71. doi: 10.1002/lt.500040110. [DOI] [PubMed] [Google Scholar]
- 20.Rijzewijk LJ, van der Meer RW, Lubberink M, Lamb HJ, Romijn JA, de Roos A, Twisk JW, Heine RJ, Lammertsma AA, Smit JW, Diamant M. Liver fat content in type 2 diabetes: relationship with hepatic perfusion and substrate metabolism. Diabetes. 2010;59:2747. doi: 10.2337/db09-1201. [DOI] [PMC free article] [PubMed] [Google Scholar]
- 21.Moteki T, Horikoshi H. Evaluation of Hepatic Lesions and Hepatic Parenchyma Using Diffusion-Weighted Echo-Planar MR With Three Values of Gradient b-Factor. J Magn Reson Imaging. 2006;24:637. doi: 10.1002/jmri.20682. [DOI] [PubMed] [Google Scholar]
- 22.Glover GH. Multipoint Dixon Technique for Water and Fat Proton and Susceptibility Imaging. J Magn Reson Imaging. 1991;1:521. doi: 10.1002/jmri.1880010504. [DOI] [PubMed] [Google Scholar]
- 23.Bydder M, Yokoo T, Hamilton G, Middleton MS, Chavez AD, Schwimmer JB, Lavine JE, Sirlin CB. Relaxation effects in the quantification of fat using gradient echo imaging. Magn Reson Imaging. 2008;26:347. doi: 10.1016/j.mri.2007.08.012. [DOI] [PMC free article] [PubMed] [Google Scholar]